INTRODUCTION
Owing to the fish meat’s being quite rich in protein, lipid, mineral material and vitamin, and high of biological value, it is an important food source for providing qualified and balanced diet for people. Fish meat proteins have been important for human beings because they are easily digested and which is considered as a main source of fat-soluble vitamins. Animal protein is big problem in people health especially development country. Solving this deficiency can be done through processes such as surimi new sources of protein, using these sources efficiently, evaluating these products and lengthening their storage time. The results of these efforts have made important contribution to country’s economical level [1]. With these specialties its consumption amount is rising every day, because it is a meat type that children, pregnant and nursing mothers, people with cardiovascular and gastric disease and people who are on diet with animal fat can consume reliably [2,3].
Surimi is a fish mince that is minced, washed and frozen, and added cryoprotectant for the long shelf life during the storage, and it is a tasteless and scentless
product [4]. Surimi can also be described as myofibrillar protein (MP) concentrate of fish meat [5,6]. The most important determinant specialities of surimi quality are; emulsion characteristics, colour, scent and taste [7]. The protein in its myofibrillar structure gives its emulsion characteristic to the surimi. With this flexibility, surimi is used for producing various fabrication products [8]. After the emulsion characteristic, colour is the most important factor in surimi quality. Surimi’s colour is affected by the protein and the fat content of the raw material. In parallel with the quality of used raw material, the surimi’s quality improves [7].
Commercially a large part of the surimi is especially produced from Alaska Pollack (Theragra chalcoramma)
which is a fish with white meat in Japan [9]. On the other hand, 60 different kinds of fish like codfish, herring, haddock, mackerel, sardine, anchovy and rockfish are used in fresh surimi production [8]. But when deciding on the kind to use in surimi production, fishing amount and economy have also important roles. Today, the main purpose of surimi products from all over the world is to provide a healthy diet and a good alternative to the shellfish. Made by adding supplementary ingredients and
The Determination of Quality Changes of Vacuum-Packaged Rainbow Trout
(Oncorhynchus mykiss) Surimi Stored in the Refrigerator
M. Emin ERDEM1* Serkan KORAL2 Vedat TAN2 Can BULUT2 İrfan KESKİN1 1 Sinop University, Faculty of Fisheries, 57000, Akliman, SİNOP
2 Rize University, Faculty of Fisheries, 53100, RİZE
*Corresponding Author Received : 21.07.2010
e-mail: [email protected] Accepted : 23.09.2010
Abstract
This study is aimed to determine the chemical composition and the shelf life of the rainbow trout (Oncorhynchus mykiss) being turned into surimi in the refrigerator conditions. The trout taken from a rainbow trout (Oncorhynchus mykiss) farm situated in Rize are brought to the laboratory of Rize University Faculty of Aquaculture, and their head and internal organs were cleaned out, then they are flayed. The fish turned into fillet were ground in the grinder (3 mm). After one day, starch 4%, sugar 3%, salt 1.5%, sorbitol 0.3% are added into the filtered mince and mixed. Then, each approximately 250 g, 8 pieces as vacuum packaged were kept in the refrigerator conditions (4±1°C) throughout the analysis.
With the aim of examining the change in the nutritional value and the quality during 4°C storage of surimi, organoleptic and chemical analyses are carried out periodically (10 days). In the sample of surimi kept in the refrigerator vacuum packaged, the starting TVB-N, TBA, TMA amounts in order were determined as 7.01 mg/100 g, 0.55 mg malonaldehyde/kg, 0.18 mg/100 g. These values have increased through the storage, and spoiled in the 68th day by exceeding the limit value according to the TVB-N criteria. In the day of spoilage, both the TBA value measured as 4.51 mg malonaldehyde/kg and TMA value as 2.68 mg/100 g have stayed in the allowed limit values.
At the end of the 50th day, as a result of the points that a panellist group of 6 people gave organoleptic, the trout surimi has fallen under the
consumption limits according to taste criteria.
natural aroma “Surimi” brings the taste of shellfish to our tables, combining it with health with its low cholesterol, calories and fat rates [10].
In Turkey, the annual production of the rainbow trout that is used as raw material in the study is 61 173 ton. The 58 433 ton of it is provided from inland waters and 2 740 ton is from the cages under the sea [11].
In the periods when the production is high, the trout can be used in making surimi as the fat rate in the meat’s structure is optimum. Also, it can be the reason of choice to use it as raw material because of its high rate of production in Turkey. Different kinds of fish are used as raw material for the surimi technology which is quite new in Turkey, besides tests on production of surimi made of trout are carried out.
MATERIALS AND METHODS
MaterialAs the study material, taken from a firm who does trout farming in Rize, 11 trout which total weigh was 6 kg (average 536.72 g) and average height was 33.63 cm were used.
Methods
Preparation of Surimi
The head and internal organs of the fish are cleaned out; the fish are filleted, flayed and made of minced fish (3 mm). The obtained mince is washed two times for 20 minutes with water cooled with ice and once again it is cooled. Finally, it was washed with water containing salt 0.3%, and prefiltering procedure was applied for 30 minutes. After the prefilt, for the dehydration (removing of over water) process, the mince is put in cloth bags and pressed for one day in the refrigerator conditions. Into the dehydrated mince, supplemental materials (cryoprotectant) prepared from starch 4%, sugar 3%, salt 1,5%, sorbitol 0.3% were added and mixed. The obtained trout surimi in shape of 250 g vacuum-packages was kept in refrigerator conditions throughout the analysis (Figure 1).
Fresh fish ↓
Head, fins and internal organs of the extracted ↓
Remove fillets ↓
Fish minced ↓
Washing (in ice) and filtering ↓ Pressing Process ↓ Cryoprotectant to Participate ↓ Surimi ↓ Pocketing (250 g) ↓ Storage (4±1°C)
Figure 1. Surimi manufacturing process steps Analyses
Surimi during storage at 4°C, the change in nutritional value and quality for 10 days to investigate sensory, physical and chemical analysis were made.
Sensory analyses
Sensory analyses to assess the six panellists were involved. Panellists overall product appearance, flavour (fried in oil), odour and texture properties assessed over 5 points in terms of.
Chemical Analysis
pH analyses were calculated with Orion Mark (8156BNUWP-USA) digital pH meters, according to Curran et al. [12]. TVB-N analyses were performed according to Antonacopoulos [13]. TMA-N and TBA analyses were calculated according to Tarladgis et al. [14].
Chemical compositions were analyzed according to methods stated for crude protein [15], crude lipid [16], dry matter [17] and crude ash [15].
Statistical analysis
The data were evaluated using analysis of variance [18].
RESULTS
Biochemical composition
Biochemical composition results on the first, the 30th
and the 68th day of the fresh trout and surimi used in the
research are calculated over two parallels, and are given as ± standard deviation in Table 1.
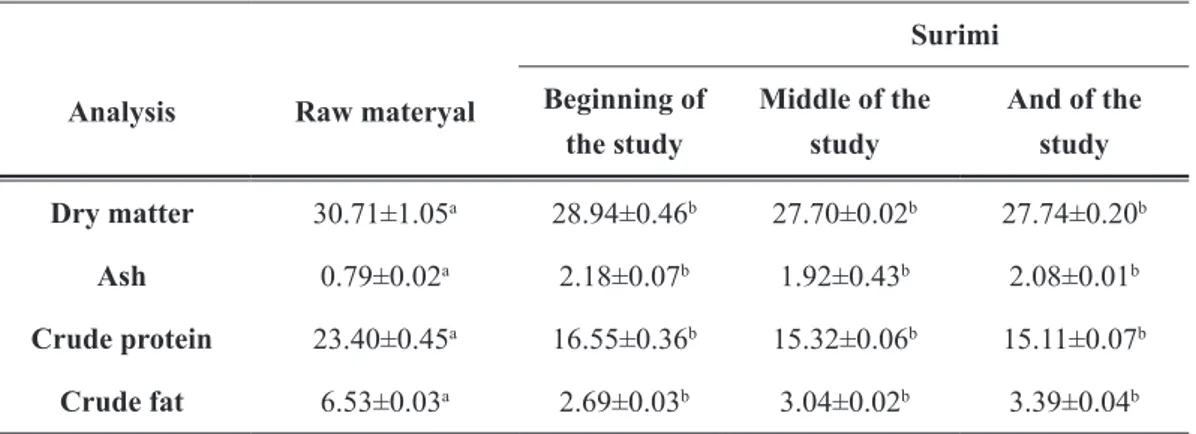
Crude protein, crude fat, dry matter, ash rates of fresh trout are measured, in order to 23.40%, 6.53%, 30.71%, 0.79%, respectively. During the storage, on the first, the 30th and the 68th day, biochemical analyses are carried
out with the aim of determining the change in nutritional value. Averagely the amounts have changed between; dry matter amounts 27.70%, ash 2%, protein amounts 15% and fat 3,20%. As a result of the analyses done on the first, the middle of the study and of the study (68th
day) day of surimi, the apparent decrease of these rates is considered (30th day) and the statistically significant
(p<0.05). It is considered that this decrease is the result of that sarcoplasmic protein and fat solved in water during washing and filtering is resolved from the fish meat. In ash rates, a significant increase has been identified in the surimi, and this increase is considered as the result of preservative additives.
Meat Yield
In surimi process, after the cleaning, filleting, flaying, grinding, filtering of 6 kg trout and adding the additives, 2.108 kg surimi was obtained in totally. The resulting surimi’s yield after all these processes was found as 35.13%.
Analysis results of quality changes
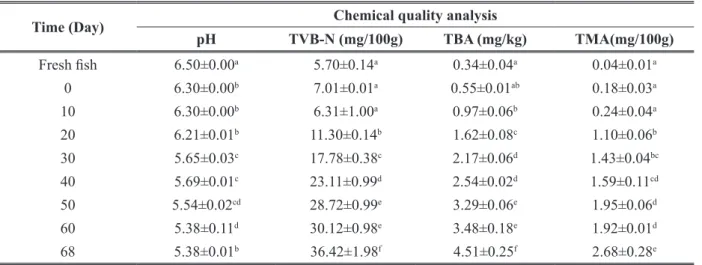
The analysis findings of shelf life changes during storage were shown in Table 2. pH value which was found 6.50 in fresh trout was detected as 5.38 on the last day of storage (p<0.05). One of the chemical quality standards TVB-N, was found 5.70 mg/100 in fresh trout. This value has risen up depending on the storage duration, and exceeded the limit value by reaching 36.42 value on the 68th day. The rise on the 20th day and on the following
analysis days was considered significant (p<0.05). TBA value was found as 0.34 mg malonaldehyde/ kg in fresh fish has reached the value of 4.51 mg malonaldehyde/kg at the end of 68 days storage. The rise on the 20th day and on the following analysis days
was found statistically as significant (p<0.05). According to the TMA analysis results, it was calculated as 0.04 mg/100 g in the fresh material, 1.10 mg/100 g on the 20th
day and 2.68 mg/100 g on the last day of storage (p<0.05) (Table 2).
Findings of Sensory Evaluation
The organoleptic assessment results of 6 panellists in terms of appearance, taste, odor, tissue and the general average of these results are shown in Table 3. Seemingly, the surimi sample has fallen under the consumable point after the 60th day, and the changes after the 20th day were
considered statistically significant. Although the average point the panellists gave according to taste criteria was 4.67 points at the beginning, the points given through the storage have fallen down, and on the 50th day by falling
down under the limit value (1.9) it became inconsumable (Table 3).
But until the day on which chemical spoilage occurred according to the other criteria of sensory analysis, the analyses are carried on. When it has fallen down the limit value after the 60th day according to scent criteria, it has stayed a bit higher than the limit value till the end of the analysis according to tissue criteria. In the values given by taking the average of all criteria a constant fall down occured depending on the storage duration, and on the day of spoilage according to taste criteria, the average point is detected as 2.34.
Table 1. The biochemical composition of the fresh trout and surimi used in the research (%)
(a,b,...): Different letters in the same row indicate statistical difference (p<0.05)
Analysis Raw materyal
Surimi Beginning of the study Middle of the study And of the study Dry matter 30.71±1.05a 28.94±0.46b 27.70±0.02b 27.74±0.20b Ash 0.79±0.02a 2.18±0.07b 1.92±0.43b 2.08±0.01b Crude protein 23.40±0.45a 16.55±0.36b 15.32±0.06b 15.11±0.07b Crude fat 6.53±0.03a 2.69±0.03b 3.04±0.02b 3.39±0.04b
DISCUSSION
For the market share of the fish released for consumption to be higher, the product should have a long shelf life and a marketing potential. Besides the methods implemented on the fresh fish with this purpose like smoking, freezing, canning, drying and salting, surimi is also a product which can increase the consumption of water products [19]. In this study we committed, trout which was farmed in our country and especially in our region was used for making surimi, and during the storage as vacuum packaged under the refrigerator conditions the changes in the nutritional value and in the chemical quality criteria have been analyzed.
The water amount which is 80-85% in raw surimi, decreases by 8-9% after adding cryoprotectant, and shows difference between 75-79% [8,20]. According to 1974 quality standards of Japanese Surimi Union, water amounts in surimi that is added salt, change between 75-78% depending on the fish kind and the quality of the produced surimi. Again according to 1978 quality
standards of Japanese Surimi Union, water amounts in surimi that is not added salt, change between 77-79,5%. In our studies the dry matter amounts detected in surimi show parallelism with these findings.
Generally, in surimi production the commercial yield changes between 22-32%. In surimi process, the yield changes depending on the fish kind, size and being flayed or not. In this study the final product surimi’s yield is found 35.13%.
Toyoda et al. [9] stated that the yield of the fish whose head and internal organs were taken out is 33%, and of the fish that is filleted is 26%. Hasting and Tavendale [21] detected that the yield of raw surimi they made from haddock, changes between 27-29% and 34-35% depending on the drained material.
In surimi the starting pH value was found 6.50. This value has fallen down through the storage, and on the 68th
day it is detected as 5.38. Arslan [22], prepared surimi from shiraz fish. He found that in the samples storages in refrigerator conditions as vacuum packaged, the starting pH value is 6,99 and after 11 days of storage it is 6,65. Table 2. The change in the pH, TVB-N, TBA, TMA values during storage
(a,b,...): Different letters in mean values are significantly different (p<0.05)
Time (Day) Chemical quality analysis
pH TVB-N (mg/100g) TBA (mg/kg) TMA(mg/100g) Fresh fish 6.50±0.00a 5.70±0.14a 0.34±0.04a 0.04±0.01a 0 6.30±0.00b 7.01±0.01a 0.55±0.01ab 0.18±0.03a 10 6.30±0.00b 6.31±1.00a 0.97±0.06b 0.24±0.04a 20 6.21±0.01b 11.30±0.14b 1.62±0.08c 1.10±0.06b 30 5.65±0.03c 17.78±0.38c 2.17±0.06d 1.43±0.04bc 40 5.69±0.01c 23.11±0.99d 2.54±0.02d 1.59±0.11cd 50 5.54±0.02cd 28.72±0.99e 3.29±0.06e 1.95±0.06d 60 5.38±0.11d 30.12±0.98e 3.48±0.18e 1.92±0.01d 68 5.38±0.01b 36.42±1.98f 4.51±0.25f 2.68±0.28e
(a,b,...): Different superscript letters in a row indicate significant differences (p<0.05)
Table 3. Sensory analysis results of the surimi samples
Time (Day)
Surimi
Appearance Taste Odor Tissue Average
0 4.83±0.41a 4.67±0.52a 4.67±0.52a 4.67±0.52a 4.70±0.08 10 4.83±041a 4.00±0.32ab 4.83±0.41a 4.00±0.00ab 4.41±0.10 20 3.92±0.20b 3.83±1.17ab 4.17±0.26a 4.00±1.10ab 3.98±0.30 30 3.13±0.25c 3.25±0.87ab 3.00±0.71b 3.00±0.71bc 3.09±0.11 40 2.83±0.29c 2.50±0.00ab 2.50±0.50b 2.33±0.29c 2.50±0.13 50 2.60±0.42c 1.87±0.05b 2.40±0.22b 2.50±0.50c 2.34±0.32 60 2.75±0.35c --- 2.00±0.00bc 2.25±0.35bc ---68 1.70±0.45d --- 1.00±0.00c 2.20±0.84c
---Inal [23] stated that when the TVB-N amount exceeded 30 mg at 100 g, the fish is accepted as not fresh. When classifying the fish in terms of quality according to the TVB-N value, Kietzmann et al. [24] detected that the samples that contain 25 mg/100g TVB-N can be determined as very good, and the samples that contain 30 mg/100g TVB-N can be determined as good. On the other hand if it is 35 mg/100 g and over it is classified as spoiled.
In the sample of surimi kept in the refrigerator vacuum packaged, the starting TVB-N, TBA, TMA amounts in order were determined as 7,01mg/100 g, 0,55 mg malonaldehyde /kg, 0,18mg/100 g, respectively. These values have increased through the storage, and spoiled in the 68th day by exceeding the limit value according
to the TVB-N criteria. In the day of spoilage, the TBA value was measured as 4.51 mg malonaldehyde/kg, on the other hand TMA value as 2.68 mg/100 g stayed in the allowed limit values.
Köse et al. [25] made a study of the shelf life of haddock surimi after storaging at 4ºC. The TVB-N value found as 2.11 mg/100 g on the first day was found as 78.4 mg/100 g on the last day of storage. As for the TBA values, they detected it as 0.881–3.00 mg malonaldehyde/ kg. The reason that the TBA values were detected low may be that the preservative additives prevent the oils from spoiling. TMA remained between the limit values during the study as it was found in small amounts in freshwater fishes.
As a result of the points that the panellists group of 6 people gave organoleptic, the trout surimi was spoiled by falling under the consumability edge according to the taste criteria at the end of the 50th day. But till the 68th
day on which the spoilage occurred according to one of the chemical analysis TVB-N, scoring is carried on with regard to the other criteria.
In the surimi study we made with trout as an alternative to the fresh food in our country, it is determined that although the surimi vacuum packed and storaged in refrigerator spoils on the 68th day according to TVB-N
criteria, it remained fresh for 50 days organolepticaly.
REFERENCES
[1] Varlık C, Yolcular H. 1987. Storage of frozen blue fish and anchovy. J. Food Industry, 2: 39-42. [2] Yurteri A. 1984. Ülkemizin Su Ürünlerinden
Yararlanma Durumu ve Tüketim Fazlası Ürünlerin Değerlendirme İmkanları, Su Ürünlerinin Planlı Üretimi, İşlenmesi, Soğuk Muhafazası ve Pazarlama Paneli, Yayın No:6, s.89-108, İzmir.
[3] Mert I. 1986. Su Ürünleri Potansiyelimiz ile Stoklarımıza Olumlu Yönde Etki Yapan Faktörler, Su Ürünleri Sektörünün Bugünkü Durumu ve Sorunları Sempozyumu, Yayın No:7, s. 25-44, İzmir.
[4] Wray T. 1987. Surimi; a Protein of the future. Food
Manufacture, 62(11): 48-49.
[5] Park JW, Korhonen RW, Lanier TC. 1990. Effecet of rigor motris on gel-forming properties of surimi and unwashed mince prepared from Tilapia. J. of Food Sci. 55(2): 353-355,360.
[6] Lanier TC. 1986. Functional properties of surimi, Food Tech., 40(3): 107-114,124.
[7] Anonymus 1991. Processing of Surimi and Fish Jelly Products, Infofish Tecnichal Handbook 2 series.
[8] Lee CM. 1984. Surimi process technology. Food Tech., 38(1): 69-80.
[9] Toyoda K, Kimura I, Fujita T, Noguchi SF, Satosfi FN, Lee CM. 1992. The Surimi manufactoring Process, Surimi Technology, Lanier, T.C., Lee, C.M., Marcell Dekker Inc., Newyork (79-112). [10] Anonymus2009.www.annecocuk.com/modules/
newbb/viewtopic.php?topic_id=90751&forum=1-37k.
[11] TUIK. 2008. 2007 Fisheries Statistics.
[12] Curran CA, Nicoladies L, Poulter RG, Pors J. 1980. Spoilage of Fish From Hong Kong at Different Storage Temperatures, Trop. Scien. Volume 22 pp.367-382,
[13] Antokopulos
[14] Tarladgis BG, Watts BM, Yonathan M. 1960. Distillation method for the detarmination of malonaldehyde in rancid foods, J. Amer. Oil. Chem. Soc., 37, 44-48.
[15] AOAC 1990. Official Methods of Analysis, 14th
Edition. Association of Analytical Chemistsry. Washington DC.
[16] Bligh, E. G. and Dyer, W. J. 1959. A Rapid Method of Total Lipid Extraction and Purification. Can. J.
Biochem. Physiol. 37: 911-917
[17] Ludorff, W. and Meyer, V., 1973. Fische und Fischerzeugnisse. Paul Perey Verlag, Berlin und Hamburg, 309 s.
[18] Sokal RR, Rohlf FJ. 1987. Introduction to Biostatistics. 2nd ed., New York. W.H. Freeman and Company, 349 p.
[19] Buyruk G. 2005. Tilapia (Oreochromis
Niloticus)’dan Hazırlanan Suriminin Besinsel
Kalitesi ve Duyusal Değerlendirilmesi. Yüksek Lisans Tezi, Su Ürünleri Anabilim Dalı, Adana. [20] Lee CM. 1986. Surimi manufactoring and
fabrication of surimi-based products. Food Tech.,40(3): 115-124.
[21] Hasting RJ, Tavendale MH. 1992. The effect of particul size of mince, and mesh size of dewatering cloth, on the properties of gels of washed whiting (Merlangius merlangus) mince. Int. J. of Food Sci. and Tech., 27: 643-652.
[22] Arslan H. 2006. Siraz (Capoeta capoeta
capoeta)’dan elde edilen suriminin farklı
kullanılarak raf ömrünün tespiti. Doktora Tezi, Erzurum Üniversitesi, Su Ürünleri Ana Bilim Dalı, Erzurum.
[23] Inal T. 1992. Besin Hijyeni Kitabı. Hayvansal Gıdalarda Kalite Kontrol. Final Ofset, İstanbul, 500 p.
[24] Kietzmann U, Priebe K, Rakou D, Reichstein K. 1969. Seefisch als Lebensmittel. Berlin.; p. 368. [25] Köse S, Boran M, Boran G. 2006. Storage properties
of refrigerated whiting mince after mincing by three different methods. Food Chemistry, 99(1): 129-135