Mathematics & Statistics
Volume 49 (3) (2020), 921 – 934 DOI : 10.15672/hujms.624042 Research Article
Analysis of an epidemic model for transmitted
diseases in a group of adults and an extension to
two age classes
Meltem Gölgeli∗1, Fatihcan M. Atay2 1
Department of Mathematics, TOBB University of Economics and Technology, 06510 Ankara, Turkey
2
Department of Mathematics, Bilkent University, 06800 Ankara, Turkey
Abstract
Infectious diseases are a serious problem for public health and spark the interest in in-terdisciplinary studies. In this paper, we present two mathematical models describing a possible scenario for infectious diseases. The first model considers the dynamics of the disease among adults and emphasizes the role of carriers in the SIR model and the second model assumes that the disease is transmitted to children by adults. We state the equilib-ria for each model and study the local stability of the equilibequilib-ria. Furthermore, we perform simulations using a parameter set that explains the spread of a specific infectious disease (meningococcal disease) and interpret the possible cases of transmission via simulations.
Mathematics Subject Classification (2010). 92B05, 37N25, 62P10 Keywords. SIR model, epidemic threshold, local stability, age structure
1. Introduction
Although infectious diseases have a long past in human history, we still have to fight against many of them, e.g. the common flu, SARS, measles, malaria, tuberculosis, AIDS, meningitis etc. It is possible to reduce the mortality due to infectious diseases by medical care and vaccinations. However, bacterial and viral agents evolve simultaneously and mutate against the medical treatments. Mathematical modeling of infectious diseases allows us to understand the dynamics of transmission of a disease within the population. Subsequently, the aim is to predict the possible behavior of the disease, which might enable controlling a possible epidemic through treatment, vaccination or isolation policies.
It is generally accepted that the first mathematical model in epidemiology is published in 1790 by Daniel Bernoulli, who studied the effect of cowpox inoculation on the spread of smallpox by using nonlinear ordinary differential equations. In more recent times, Kermack and McKendrick [18] produced a generalized epidemic model in 1927, which categorises a population as a candidate of an infection in three distinct compartments: susceptible, in-fected, and recovered. Their deterministic approach for a uniformly distributed population is still widely studied and has a key role in the new modeling aspects concerning factors like age, immigration-migration, vaccination, and the effect of several therapy methods or ∗Corresponding Author.
Email addresses: [email protected] (Meltem Gölgeli), [email protected] (Fatihcan M. Atay) Received: 09.07.2018; Accepted: 14.05.2019
quarantine even for a non-uniformly distributed population. The mathematical model of Kermack-McKendrick is given by dS dt = −κSI, (1.1) dI dt = κSI− λI, dR dt = λI,
where S(t), R(t), I(t), respectively, represent the number of susceptible, infective and recovered individuals at time t, and κ and λ are the transmission rate and the recovery rate, respectively. According to the hypothesis of conservation of the population, we have
S(t) + I(t) + R(t) = N , where N is the constant population size [16,24]. This types of
mathematical models are known as classical SIR (susceptible, infective, and recovered) models and yield important results for epidemics. Assuming that in the beginning of an epidemic the number of susceptibles, infectives and recovereds are given by S(0) = S0> 0,
I(0) = I0 > 0 and R(0) = 0. Then, we define the basic reproduction number R0= κS0/λ.
This is a threshold value, in the sense that epidemic spreads if R0 > 1 and dies out if
R0< 1, which is an important outcome of an epidemic model, saying when it is possible to
control the spread of the disease [16,24]. In general, analyzing the nonlinear system (1.1) is not simple since explicit solutions are usually impossible to obtain and small changes in the system may have a strong affect on the complexity of the dynamics. However, there are some approaches to find exact analytical solution in parametric form for such epidemic models [13]. Additionally, behavior related to particular equilibrium solutions can be studied by the well-known tools of stability analysis. Local and global stability of SIR models are extensively studied in the literature [12,19,23,28].
The basic model (1.1) can be enhanced in several ways to address more realistic situ-ations. For example, real populations are not homogeneous, age being one of the most important factors of heterogeneity. Individuals in different age groups may have different infection tendencies [5,25]. Indeed, childhood diseases (measles, chicken pox, rubella etc.) spread mainly through contacts between children of similar ages. Furthermore, young peo-ple have an active social life and children meet many others in their age group at school every day. A higher contact rate within the community increases the disease transmission rate.
In this paper, we discuss the stability analysis of an SIR epidemic model with and without an age structure. We assume two age classes, namely adults and kids, and ignore the spatial heterogeneity of age classes. We construct the SIR model in the form of an ordinary differential equation (ODE) system, and examine the disease-free and endemic equilibria for both with and without age structure.
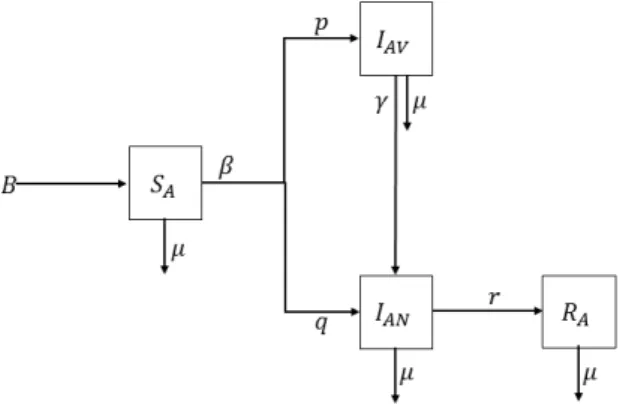
2. Mathematical model without age structure and its stability analysis The schematic diagram in Figure 1 presents the essence of our first model. We catego-rize the population into four compartments: SA(t) represents susceptible adults who are candidates for contracting the disease, IAV(t) denotes infected adults who do not show any symptoms of the disease although they continue to transmit it, IAN(t) is infected adults who do show the symptoms of the disease, and RA(t) denotes adult individuals who have recovered. In point of fact, infected people in the compartment IAV(t) are vaccinated adults who transmit the disease to the unvaccinated adults in the compartment IAN(t). We consider a fixed homogeneous population, where the age of adults has no effect on the probability of being infected. Dividing the compartment of infected individuals into the subclasses is needed for some modeling aspects. Indeed, in many infectious diseases there
Figure 1. Diagram describing the first model given by equation system (2.1)
are individuals who ’carry’ the virus or bacteria that cause the disease without showing any symptoms of the disease. For example, SIR models explaining AIDS often suggest two classes of infected individuals: the first class of infectives represents HIV carriers without a symptom of AIDS, whereas the second class consists of infectives who exhibit the symptoms of the disease [2]. Centers for Disease Control and Prevention, Atlanta, USA, reported that travelers may be at increased risk for meningococcal disease, caused by N. meningitidis, if they travel to certain places, and recommended meningococcal vac-cines for people who are traveling to these high-risk areas [8]. Although meningococcal vaccination influences carriage prevalence in vaccinated individuals, it could not prevent the transmission of disease [6]. So, even if the vaccinated travellers do not show the symp-toms of meningococcal disease, they may transmit it. As a second example, B. pertussis may prevail among vaccinated people who do not display symptoms, and an asymptomatic transmission is also possible [3]. Biologically, the vaccinated adults could be also carriers and transmit a disease to the other adults, as in meningococcal disease or whooping cough (Bordetella pertussis).
Thus, our first modelling scenario considers the case that a group of vaccinated adult travellers are infected abroad and they carry the bacteria to their home. We assume that the bacterial transmission is only possible among adults. The serogroup of bacteria trans-mitted by vaccinated adults could be totally different although the infected unvaccinated individuals show similiar symptoms [9,30]. A mathematical model for infectious diseases that include the effects of carriers on the transmission dynamics is proposed by [17]. We use a similar idea to construct the mathematical model explaining the transmission dy-namics between vaccinated and unvaccinated adults expressed as
dSA dt = B− µSA− βSA(pIAV + qIAN) (2.1) dIAV dt = βpSAIAV − µIAV − γIAV dIAN dt = βqSAIAN− µIAN− rIAN + γIAV dRA dt = rIAN− µRA,
with the initial conditions SA(0)≥ 0, IAV(t)≥ 0, IAN(t)≥ 0 and RA(0)≥ 0. Since, the total population density is assumed to be constant,
SA(t) + IAV(t) + IAN(t) + RA(t) = 1. Hence, we have SA′ (t) + IAV′ (t) + IAN′ (t) + R′A(t) = 0.
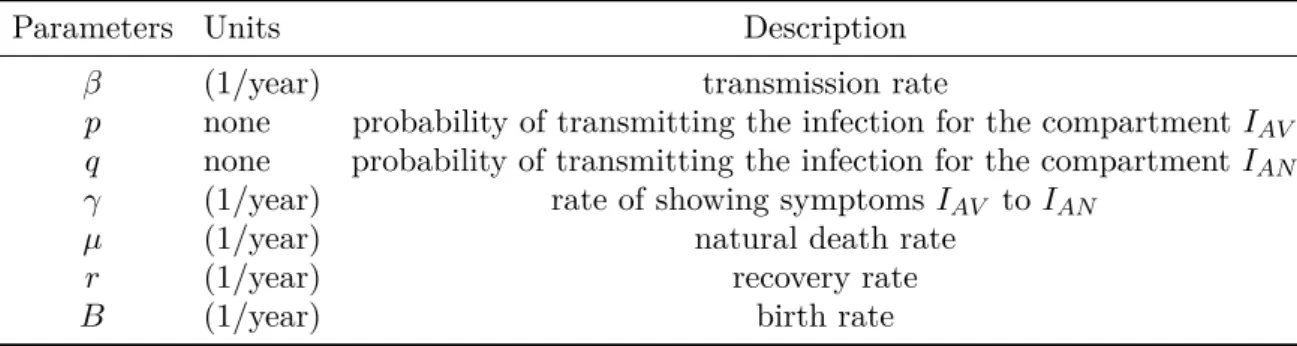
Table 1. Parameters of the model (2.1)
Parameters Units Description
β (1/year) transmission rate
p none probability of transmitting the infection for the compartment IAV
q none probability of transmitting the infection for the compartment IAN
γ (1/year) rate of showing symptoms IAV to IAN
µ (1/year) natural death rate
r (1/year) recovery rate
B (1/year) birth rate
The parameters of the model (2.1) are summarized in Table 1.
Contrary to the model in [17], all of the individuals in the compartment IAV are vac-cinated carriers and we do not need to define an extra compartment for vacvac-cinated indi-viduals. Further, the transmission by interaction between SAand IAV results in the class
IAV with the transmission rate βp and the transmission by interaction between S and
IAN results in the class IAN with the transmission rate βq. Thus, the constant β could be extent a time dependent parameter β(t) while analysing a traveller case as mentioned in [8]. Moreover, here it is important to discuss the parameters p and q controlled by vaccination policy. In this sense, the stability analysis of the equilibria is different in our case.
If there is no infection in the population, we have IAV = IAN = 0, which is known as the disease-free state. Since there are no infected individuals, we do not have any recovered individuals, i.e. RA = 0. While seeking the disease-free equilibria, it is sufficient to find the equilibrium for the non-zero class SA(0). Thus, the disease-free equilibrium has the form Edf = (SA∗, 0, 0, 0), where we obtain SA∗ = Bµ using the system
B− µSA− βSA(pIAV + qIAN) = 0 (2.2)
βpSAIAV − µIAV − γIAV = 0
βqSAIAN− µIAN− rIAN+ γIAV = 0
rIAN − µRA = 0.
Similarly, we assume to be at the endemic state if there is any infected person in the population, i.e., IAV > 0, IAN > 0, R = 0. At this state the endemic equilibrium reads
Ed= (SA∗, IAV∗ , IAN∗ , R∗A), where SA∗ = µ + γ βp , (2.3) IAV∗ = − 1 γp(q(µ + γ)− p(µ + r)) I ∗ AN, IAN∗ = γ ( Bp µ + γ − µ β ) (−qµ + p(µ + r))−1, R∗A = r µI ∗ AN,
using (2.2). On the basis of (2.3), the dynamics for R can be derived from the first three equations. In this sense, we reduce the system and analyze the stability of Ed = (SA∗, IAV∗ , IAN∗ ).
We evaluate the Jacobian matrix of the system (2.2) for analyzing the local stability of the disease-free and endemic equilibrium points:
J = −µ − β (pI ∗ AV + qIAN∗ ) −βpSA∗ −βqSA∗ βpIAV∗ (βpS∗A− µ − γ) 0 βqIAN∗ γ (βqSA∗ − µ − r) . (2.4)
We first consider the disease-free equilibrium Edf = (SA∗, 0, 0), where the Jacobian (2.4) takes the form
Jdf = −µ −βpB µ −βq B µ 0 ( βpB µ − µ − γ ) 0 0 γ ( βqB µ − µ − r ) ,
which has the eigenvalues
λ1 =−µ, λ2= ( Bβp µ − µ − γ ) , λ3= ( Bβq µ − µ − r ) .
The disease-free equilibrium is locally asymptotically stable if the real parts of all eigenval-ues are negative. It is clear that λ1< 0, since µ > 0 because of the biological assumptions.
Stipulating that λ2 and λ3 also be negative yields the conditions for the stability of the
disease-free equilibrium as
βpB
µ < µ + γ and β(1− p)
B
µ < µ + r.
We have determined the endemic equilibrium point Ed= (SA∗, IAV∗ , IAN∗ ) given by
equa-tions (2.3). For simplicity, we rewrite Ed= (SA∗, W IAN∗ , IAN∗ ) with W =−γp1 (q(µ + γ)− p(µ + r)). Substituting the endemic equilibrium state Ed= (SA∗, W IAN∗ , IAN∗ ) into the Jacobian (2.4)
gives Jd= −µ − β (pW + q) I∗ AN − (µ + γ) − q p(µ + γ) βpW IAN∗ 0 0 βqIAN∗ γ (µ + γ)q p− µ − r .
Now the characteristic polynomial has the form λ3+ a2λ2+ a1λ + a0 = 0, where
a2 = 2µ + r− (µ + γ) q p + β (pW + q) I ∗ AN a1 = (−µ − β (pW + q) IAN∗ ) ( (µ + γ)q p − µ − r ) + (µ + γ) (βpW IAN∗ ) +q p(µ + γ) βqI ∗ AN a0 = −βpW IAN∗ (µ + γ) (( q p(µ + γ)− µ − r ) +q pγ ) .
According to the Routh-Hurwitz stability criterion, the roots are in C− if and only if
a2 > 0 and a1a2 > a0 > 0, in which case the equilibrium Ed is locally asymptotically
stable.
Under the assumption 0 < SA∗ ≤ Bµ we obtain the basic reproduction number R0 =
Bβp
(µ+γ)µ using the Jacobian matrix and next generation method [11]. 3. Simulations for the model without age structure
We have carried out simulations for a population of 100 individuals assuming that the birth and death rates are equal to each other, which ensures a constant population size by assuming not to have a significant change in the population size in a few months. Turkish Statistical Institute (TUIK) has reported the life expactancy in Turkey to be around
around 78 in year 2016. Thus we assume B = µ = 0.0128. Since we aim to understand how fast the vaccinated adults transmit a disease to other adults, we mainly concentrate on the parameter β and γ. The parameter p represents the probability of vaccination that effects the number of the individuals in the classes IAV and IAN. In that sense we assume a moderate vaccination policy and take the value of p hypothetically equal to 0.4. As a suitable example to the model (2.2) we point out the meningococcal disease. World Health Organisation suggest people vaccination for meningococcal disease if they are travelling to sub-Saharan Africa. Additionally, pilgrims travelling to the Kingdom of Saudi Arabia for the Hajj or Umra are required to show a proof vaccination in order to obtain a visa. However, the meningococcal disease carriage is reported in Turkish hajj pilgrims [9]. The transmission rate β of meningitis varies depending on environmental and geographical conditions [22]. Ozsurekci claimed in her doctoral thesis that the bacterial meningitis prevalence in Turkey is 3.5 among 100000 individuals per year [27]. Thus, we assume an initial rate for transmission β = 0.035 and we vary the infection rate β to manipulate an epidemic or disease-free state of the population. We assume a fixed rate of showing symptoms γ = 0.1, as calculated for the lowest rate at which carriers become ill in African meningitis belt [15]. Although the fatality rate in patients with meningitis is between 10% and 26%, some patients may survive with neurologic sequelae [22]. We define ’recovery’ in our research basically as ’being alive’, which is strongly dependent on the age of the patient. However, the treatment duration is between 5 and 30 days, where 5 to 7 days will be sufficient for an uncomplicated case of meningococcal disease [14]. Since an individual needs approximately 5 to 7 days to recover from disease, we assume the recovery rate r = 0.6.
The stability conditions and the nature of stability can be found in Table 2 for the disease-free state, and in Table 3 for the epidemic state.
Table 2. Stability of the disease-free state
B = µ β p q γ r λ1 λ2 λ3 R0 Stability
0.0128 0.035 0.4 0.6 0.1 0.6 -0.0128 -0.1114 -0.6107 0.1241 Stable 0.0128 0.2821 0.4 0.6 0.1 0.6 -0.0128 -0.0000002 -0.4430 1 Neutrally stable 0.0128 0.3 0.4 0.6 0.1 0.6 -0.0128 0.0072 -0.4328 1.0636 Unstable
Table 3. Stability of the endemic state
B = µ β p q γ r a2 a1a2> a0> 0 R0 Stability
0.0128 0.035 0.4 0.6 0.1 0.6 −0.00005 < 0 a1a2> a0 0.1241 Unstable
0.0128 0.2821 4.2 0.6 0.1 0.6 0.4564 > 0 a1a2> a0> 0 1 Neutrally stable
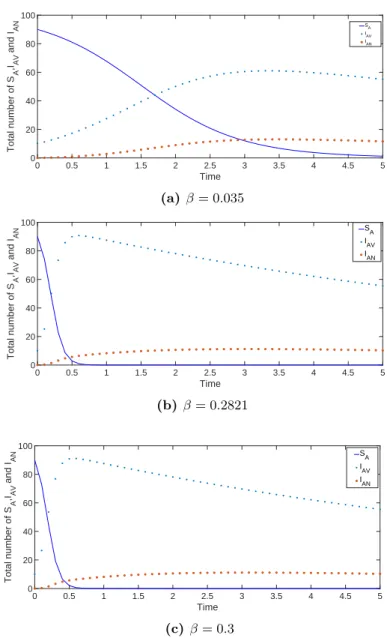
0.0128 0.3 0.4 0.6 0.1 0.6 0.4572 > 0 0.028 > 0.0004 1.0636 Stable Figure 2 shows the variation of SA, IAV, and IAN as a function of time for disease-free and endemic cases. The presented model may apply to many infectious diseases that have two sub-classes of the compartment for infectious individuals. One of these classes is generally defined as a compartment for carriers. For example, diseases like HIV infection, Hepatitis B infection or bacterial meningitis have such a modeling structure. Particularly, we concentrate on the bacterial meningitis case and use parameters related to bacterial meningitis. Since we do not have a data set for the epidemic scenario, we may roughly estimate the transmission behaviour of the disease. The simulations support the prediction that as long as R0 remains low (i.e. R0 < 1), the disease may disappear, whereas if R0 is
high (i.e. R0> 1), the disease tends to spread. This result can be applied to any model
of infectious disease that consists of individuals who are infected without showing any symptom and people who are infected and showing the symptoms.
0 0.5 1 1.5 2 2.5 3 3.5 4 4.5 5 Time 0 20 40 60 80 100 Total number of S A ,IAV and I AN SA I AV I AN (a) β = 0.035 0 0.5 1 1.5 2 2.5 3 3.5 4 4.5 5 Time 0 20 40 60 80 100 Total number of S A ,IAV and I AN S A I AV I AN (b) β = 0.2821 0 0.5 1 1.5 2 2.5 3 3.5 4 4.5 5 Time 0 20 40 60 80 100 Total number of S A ,IAV and I AN SA IAV I AN (c) β = 0.3
Figure 2. The variation of the SA, IAV and IAN classes for various values of the
infectious rate β. (a) β = 0.035, (b) β = 0.2821, (c) β = 0.3
Eventually, we construct a mathematical model which represents the transmission dy-namics between vaccinated and unvaccinated adults. The main idea is that the vaccination policy of countries do generally target the adults who are visiting risky regions. However, the vaccinated adults could carry the infection to their children, grandchildren etc. [9]. Thus, we aim to extend the model (2.1) for two age classes, assuming the vaccinated travellers transmit a disease to the children in their environment.
4. Mathematical model of two age classes and its stability analysis Generally, the risk of transmission of an infection depends on the age and immunity status of susceptible individuals. For example, [20] describes adults as virus reservoirs for children for the measles virus transmission, [10] reports that about half of all cases of bacterial meningitis in USA occur in children between 0-18 years of age, and [4] empha-sizes that adult travelers with rotavirus shed 10-100 times less rotavirus than do pediatric
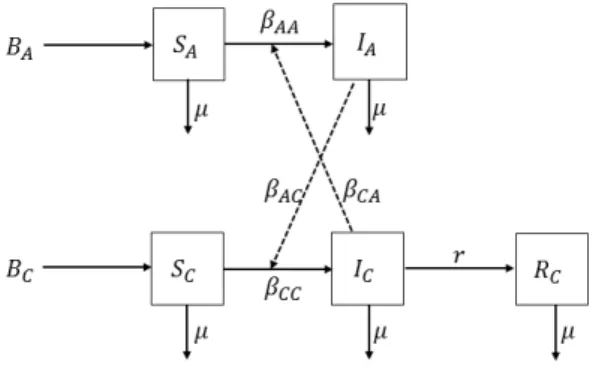
patients. The transmission processes have different results for different diseases. Never-theless, almost every age-structured deterministic modeling approach follows the realistic age-structured measles model of [29]. We depict our case diagrammatically in Figure 3.
Figure 3. Schematic description of the model (4.1).
Since we have analyzed the effect of adult carriers in our previous model, we assume to have only a single class of adult carriers which are able to transmit the disease to children. In that sense, we only assume to have vaccinated adults in the model (4.1), because we have roughly estimated that even in endemic case the vaccinated adults are the main reservoir of the infection. Namely, we ignore that the unvaccinated adults (who are not travellers) could also be infected and transmit the infection to the children. All adults have gained immunity, e.g. through vaccination, and after a trip to abroad they might carry the bacteria to the children in the family. Since they do not show any symptoms of the disease, the recovery process for adults is neglected. The population is divided into two age classes as in [7]. Although people of any age can develop bacterial meningitis, children are at increased risk for bacterial meningitis [26]. In reality, the prevalence of the disease is different in age subgroups of children. We do not define the age threshold between adult and child classes clearly, just because we do not analyse any other age subgroup of children. We use similar notation as in the previous model and let SC, IC, and RC represent the susceptible, infectious, and recovered compartments, respectively. The total population density is N = NA+ NC = 1, where the indexes A and C represent the age classes ‘adult’ and ‘children’. We explain the parameters of model (4.1) in Table 4. Contrary to the model for adults (2.1), we assume that all adults are vaccinated but they are able to carry the infection without showing any symptoms. That is why a recovery compartment for adults is omitted. All of the susceptible children are unvaccinated; so they can get the infection, transmit it and recover from the disease. As in the previous model (2.1), we assume that all surviving children are recovered, although some of them may survive with neurologic sequelae [22]. The age-structured model is then described by the system of differential equations
dSA
dt = BA− (βAAIA+ βCAIC) SA− µSA (4.1)
dSC
dt = BC− (βCCIC+ βACIA) SC − µSC
dIA
dt = (βAAIA+ βCAIC) SA− µIA
dIC
dt = (βCCIC+ βACIA) SC − µIC− rIC
dRC
Defining the total population by N = SA+ SC + IA+ IC + RC means that RC can be obtained uniquely; thus, we omit the equation for dRC/dt and reduce the system of
equations (4.1).
Table 4. Parameters of the model (4.1)
Parameters Units Description
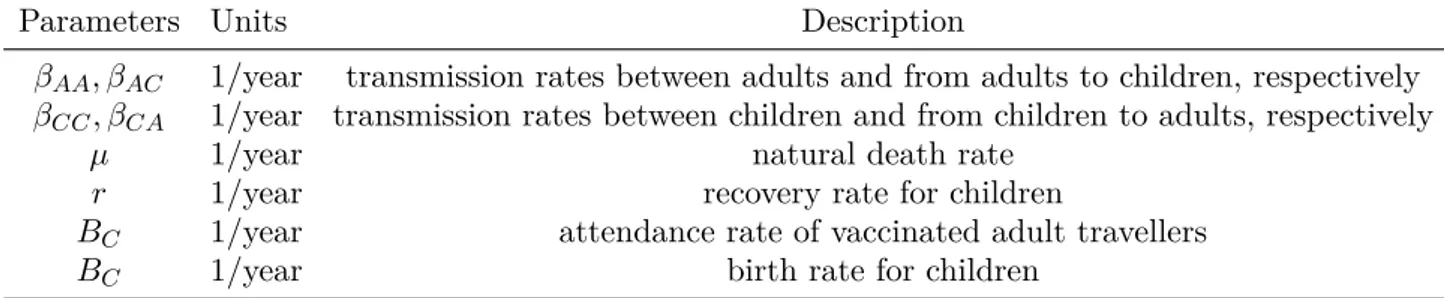
βAA, βAC 1/year transmission rates between adults and from adults to children, respectively
βCC, βCA 1/year transmission rates between children and from children to adults, respectively
µ 1/year natural death rate
r 1/year recovery rate for children
BC 1/year attendance rate of vaccinated adult travellers
BC 1/year birth rate for children
The parameters of the model (4.1) are summarized in Table 4.
The disease-free state corresponds to IA= IC = 0. Since there are no infected children at the beginning, there are also no recovered children, i.e. RC = 0. Thus the disease-free equilibrium has the form of Edf = (S∗A, SC∗, 0, 0), where we obtain SA∗ =
BA
µ and SC∗ = BC
µ using the model equations (4.1).
The Jacobian matrix of the system (4.1) at the equilibrium points is given by
J = − (βAAIA∗ + βCAIC∗)− µ 0 −βAASA∗ −βCASA∗ 0 − (βCCIC+ βACIA)− µ −βACSC∗ −βCCSC∗ βAAIA∗ + βCAIC∗ 0 βAASA∗ − µ βCASA∗ 0 βCCIC+ βACIA βACSC∗ βCCSC∗ − µ − r .
At the disease-free equilibrium Edf = (SA∗, SC∗, 0, 0), the Jacobian matrix takes the form
Jdf = −µ 0 −βAABµA −βCABµA 0 −µ −βACBµC −βCCBµC 0 0 βAABµA − µ βCABµA 0 0 βACBµC βCCBµC − µ − r .
The eigenvalues are
λ1,2=−µ, λ3,4= −b ± √ b2− 4c 2 , where b =−(βAA BA µ + βCC BC µ − 2µ − r) and c = ( βAA BA µ − µ ) ( βCC BC µ − µ − r ) − ( βCAβAC BABC µ2 ) .
The necessary and sufficient condition for the local asymptotic stability of equilibria is that the real parts of all eigenvalues be negative. Because of the biological feasibility, λ1,2=−µ
is always negative. If b2− 4c ≥ 0, we have real roots λ3 and λ4 so that λ3+ λ4=−b < 0
and λ3λ4 = b
2−(b2−4c)
4 = c > 0. If b
2 − 4c < 0, we have complex conjugate roots λ
3 and λ4 where λ3λ4 = ( −b−i√b2−4c 2 ) ( −b+i√b2−4c 2 )
= b2− 2c > 0. Thus, the local stability
condition appears as 2c < b2 < 4c.
Since the analytical treatment of the dynamical model (4.1) is difficult, we will make the simplifying assumption that βCA = 0, that is, the children are not able to transmit the disease to the adults. We state that all adults in our model are ‘carriers’ who do not show any symptoms of the disease and do not need to recover from the disease. This additional
assumption does not damage the main modeling idea but allows us to reduce the system (4.1). Recall that RC can be obtained from (4.1) separately; hence we omit it. We thus obtain dSA dt = BA− βAAIASA− µSA (4.2) dSC dt = BC − (βCCIC + βACIA) SC− µSC dIA dt = βAAIASA− µIA dIC dt = (βCCIC + βACIA) SC− µIC− rIC.
The endemic equilibrium has the form Ed = (SA∗, SC∗, IA∗, IC∗), where SA∗ =
µ βAA and IA∗ = 1 µ ( BA− µ2 βAA )
, and we find the dependent system
SC∗ = BC βCCIC∗ + βAC µ ( BA− µ2 βAA ) + µ , IC∗ = ( βCCIC∗ + βAC µ ( BA− µ2 βAA )) BC βCCIC∗ + βAC µ ( BA− µ2 βAA ) + µ 1 µ + r.
Some algebra yields
IC∗ = −b ± √ ∆ 2a , where a = BCβCC2 − (µ + r)βCC, b = ( BC ( 2βCC βAC µ ( BA− µ2 βAA ) + βCCµ )) , c = BC ( βAC µ ( BA− µ2 βAA ))2 + βAC ( BA− µ2 βAA ) , and ∆ = b2− 4ac.
Thus, we obtain the equilibria Ed1 = (SA∗, SC1∗ , IA∗, IC1∗ ) and Ed2= (SA∗, SC2∗ , IA∗, IC2∗ ). All parameters are positive as they have to be biologically meaningful. We also simplify the associated Jacobian matrix assuming βCA = 0:
Jd = −βAAIA∗ − µ 0 −βAASA∗ 0 0 − (βCCIC+ βACIA)− µ −βACSC∗ −βCCSC∗ βAAIA∗ 0 βAAS∗A− µ 0 0 βCCIC+ βACIA βACSC∗ βCCSC∗ − µ − r = ¯ A 0 B¯ 0 0 C¯ D¯ E¯ ¯ F 0 G¯ 0 0 H¯ I¯ J¯
For local stability we consider the eigenvalues of Jd, which are roots of the characteristic polynomial λ4+ b3λ3+ b2λ2+ b1λ + b0 = 0, where b3=− ( ¯ A + ¯G + ¯C + ¯J ) , b2= ( ¯ A ¯G− ¯B ¯F + ¯C ¯J − ¯E ¯H + ( ¯ C + ¯J ) ( ¯ A + ¯G )) , b1= ¯A ¯H ¯E + ¯G ¯H ¯E− ( ¯ C + ¯J) (A ¯¯G− ¯B ¯F)−(A + ¯¯ G)C ¯¯J , b0= ¯C ¯J ( ¯ A ¯G− ¯B ¯F ) + ¯B ¯F ¯H− ¯A ¯G ¯H,
via an algebraic computation. By the Routh-Hurwitz stability criterion, the roots are in C− if and only if b3b2 > b1 and b3b2b1 > b21+ b23b0.
We avoid the evaluation of the basic reproduction number R0 for the two cases of age
structured model using the next generation matrix [11] where R0 is dependent on the
parameters of the infectious disease, i.e., a real data set. We have already discussed the stability of infectious and epidemic states and the next generation matrix would deter-mine a number, which is produced by transmission rates (βAA, βAB, βCB, βCC). Those transmission rates are chosen according to the stability conditions and need not represent feasible values for a particular real disease. However, the scenario suits to the case of bacterial meningitis which could be transmitted by traveller adults to the children [9].
5. Simulations for the model with age structure
The simulations refer to a population consisting of 100 adults and 50 children. We assume that the birth and death rate are equal, BA = BA = µ = 0.0128. It seems not realistic, but we consider a small group of adults who have already visited a country on meningitis belt or have been for annual pilgrimage to Mecca. So, we aim to focus on the transmission rates in a small closed group and we do not expect an extreme change of the population density in a short period of time. Since we do not have any particular data set of bacterial meningitis, we choose βAA= 0.2821 as referred in the previous model. It is reported that the incidence of bacterial meningitis is 6.1 per 1000 among children and infants in Africa and South Asia, while the prevalence of the disease is highly dependent on the serotype of meningitis [1]. Thus, we assume to have a transmission rate among children βCC = 0.61 in case the children could not transmit the disease to adults, i.e.
βCA = 0. Recovery rate remains as in adults model r = 0.6 by taking into account that the recovery period is approximately 6 days [14]. We vary the infection rate between adults and children βAC to manipulate an epidemic or disease-free state of the population. We solve the system of differential equations numerically using the Matlab function ’ode45’ and plot each scenario [21]. The stability state can be found in Table 5 for the endemic state.
Table 5. Stability of the disease-free state
BA= BC= µ βAA βAC βCA βCC r Stability of E1 Stability of E2 0.0128 0.2821 0.2 0 0.61 0.6 stable stable 0.0128 0.2821 0.02 0 0.61 0.6 stable stable 0.0128 0.2821 0.002 0 0.61 0.6 stable unstable 0.0128 0.3 0.2 0 0.61 0.6 stable stable 0.0128 0.02 0.2 0 0.61 0.6 stable stable 0.0128 0.01 0.2 0 0.61 0.6 unstable unstable
The presented model points out the importance of the variation of infection rate among two age classes. Choosing βCA = 0 not only simplifies the mathematical work but also makes sense for the infections diseases transported mainly by adults. For example, HIV
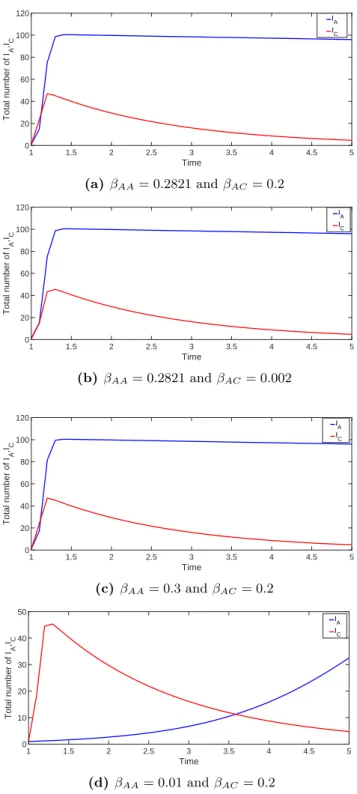
infection is mostly carried by adults and treats the children using adults as a reservoir. This model aims to explain the mechanism of such an infection which is carried by adults to children using some published information about bacterial meningitis. Figure 4 shows the simulation result for the case IA(0) = 1 and IC(0) = 1 for different transmission rates.
1 1.5 2 2.5 3 3.5 4 4.5 5 Time 0 20 40 60 80 100 120 Total number of I A ,IC IA IC (a) βAA= 0.2821 and βAC= 0.2 1 1.5 2 2.5 3 3.5 4 4.5 5 Time 0 20 40 60 80 100 120 Total number of I A ,IC IA IC (b) βAA= 0.2821 and βAC= 0.002 1 1.5 2 2.5 3 3.5 4 4.5 5 Time 0 20 40 60 80 100 120 Total number of I A ,IC IA IC (c) βAA= 0.3 and βAC = 0.2 1 1.5 2 2.5 3 3.5 4 4.5 5 Time 0 10 20 30 40 50 Total number of I A ,IC IA IC (d) βAA= 0.01 and βAC= 0.2
Figure 4. The variation of the IA and IC classes for various values of the
infec-tious rate βAAand βAC. (a) βAA= 0.2821 and βAC= 0.2, (b) βAA= 0.2821 and
6. Conclusion
We have presented two mathematical models for a infection scenario where the traveller adults transmit a disease to their environment. In the first model we analysed how the transmission rate of disease between adults effects the stability of disease-free and endemic case. In reality, there are many infectious diseases (HIV, Hepatitis B, Palio, meningitis etc.) that include aspects of both models in their transmission mechanisms. In this sense we believe that the estimation of the transmission rate β of the first model (2.1) would enlighten the estimation of the transmission parameter βAC of the second model (4.1). Although the transmission parameter βAC is very important for the spread of the disease, it is not always possible to obtain this value from a real data set. The simulations show the transmission behaviour of a disease -particularly bacterial meningitis- among adults and among adults and children, receptively. We have mainly concentrated on the mathematical interpretations of our model but the model is available to test for similar infection scenarios.
References
[1] S. Agrawal and S. Nadel, Acute bacterial meningitis in infants and children
epidemi-ology and management, Pediatr Drugs, 13 (6), 385–400, 2011.
[2] O.M. Akpa and B.A. Oyejola, Modeling the transmission dynamics of HIV/AIDS
epidemics: an introduction and a review, J. Infect. Dev. Ctries. 4 (10), 597–608,
2010.
[3] B.M. Althouse and S.V. Scarpino, Asymptomatic transmission and the resurgence of
Bordetella pertussis, BMC Medicine, 13, 146, 2015.
[4] E.J. Anderson and S.G. Weber, Rotavirus infection in adults, Lancet Infect. Dis. 4, 91–99, 2004.
[5] R.M. Anderson and R.M. May, Infectious Diseases of Humans, Dynamics and Con-trol, Oxford University Press, Oxford, 1991.
[6] P. Balmer, C. Burman, L. Serra and L. J. York, Impact of meningococcal
vaccina-tion on carriage and disease transmission: A review of the literature, Hum. Vaccin.
Immunother, 14 (5), 1118–1130, 2018.
[7] S. Bunimovich-Mendrazitsky and L. Stone, Modeling polio as a disease of
develop-ment, J. Theor. Biol. 237 (3), 302–315, 2005.
[8] Centers for Disease Control and Prevention, https://www.cdc.gov/meningitis/bacterial.html [9] M. Ceyhan, M. Celik, E.T. Demir, V. Gurbuz, A.E. Aycan and S. Unal Acquisition of
meningococcal serogroup W − 135 carriage in turkish hajj pilgrims who had received
the quadrivalent meningococcal polysaccharide vaccine, Clin. Vaccine Immunol. 20
(1), 66–68, 2012.
[10] S. Chávez-Bueno and, G.H. Jr. McCracken, Bacterial meningitis in children, Pediatr Clin. N. Am. 52, 795–810, 2005.
[11] P. van den Driessche and J. Watmough, Reproduction numbers and sub-threshold
endemic equilibria for compartmental models of disease transmission, Math. Biosci.
180, 29–48, 2002.
[12] D.J.D. Earn, P. Rohani, B.M. Bolker and B.T. Grenfell, A simple model for complex
dynamical transitions in epidemics, Science, 87, 667–670, 2000.
[13] T. Harko, S.N.F. Lobo and M.K. Mak, Exact analytical solutions of the
Susceptible-Infected-Recovered (SIR) epidemic model and of the SIR model with equal death and birth rates, Appl. Math. Comput. 236, 184–194, 2014.
[14] O. Hoffman and R.J. Weber, Pathophysiology and treatment of bacterial meningitis, Ther. Adv. Neurol. Disord. 2(6), 1–7, 2009.
[15] T.J. Irving, K.B. Bltuss, C. Colijn and C. L. Trotter, Modelling meningococcal
[16] D.S. Jones and B.D. Sleeman, Differential Equations and Mathematical Biology, Chapman and Hall/CRC, London, 2003.
[17] D. Kalajdzievska and M.Y. Li, Modeling the effects of carriers on transmission
dy-namics of infectious diseases, Math. Biosci. Eng. 8, 3, 2011.
[18] W.O. Kermack and A.G. McKendrick, Contribution to mathematical theory of
epi-demics, Soc. Lond. A Mat. 115, 700–721, 1927.
[19] Y.A. Kuznetsov and C. Piccardi, Bifurcation analysis of periodic SEIR and SIR
epi-demic models, J. Math. Biol. 32, 109–121, 1994.
[20] C. Ma, S. Yan, Q. Su, L. Hao, S. Tang, Z. An, Y. He, G. Fan, L. Rodewald and H. Wang, Measles transmission among adults with spread to children during an outbreak:
Implications for measles elimination in China, 2014, Vaccine, 34 (51), 6539–6544,
2016.
[21] MATLAB, version 9.14.0.813654 (R2018a), The MathWorks Inc., Massachusetts, 2018.
[22] A.M. Molesworth, L.E. Cuevas, S.J. Connor, A.P. Morse and M.C. Thomson,
Envi-ronmental risk and meningitis epidemics in Africa, Emerg. Infect. Dis. 9 (10), 1287–
1293, 2003.
[23] J. Müller and C. Kuttler, Methods and Models in Mathematical Biology, Springer-Verlag, Berlin, Heidelberg, 2015.
[24] J.D. Murray, Mathematical Biology, Springer-Verlag, New York, 1993.
[25] L.F. Olsen and W.M. Schaffer, Chaos versus noisy periodicity: alternative hypotheses
for childhood epidemics, Science, 249, 499–504, 1990.
[26] A.M. Oordt-Speets, R. Bolijn, R.C. van Hoorn, A. Bhavsar and M. Kyaw, Global
etiology of bacterial meningitis: A systematic review and meta-analysis, PLoS One,
13 (6), e0198772, 2018.
[27] Y. Özsürekci, Turkiye’de menenjite neden olan bakteriel ajanlar ve meningokal
sero-gruplarin seroprevelansi (Unpublished doctoral dissertation), Hacettepe University
Faculty of Medicine, 2013.
[28] K. Rock, S. Brand, J. Moir and M.J. Keeling, Dynamics of infectious diseases, Rep. Prog. Phys. 77, 026602, 2014.
[29] D. Schenzle, An age-structured model of pre- and post-vaccination measles
transmis-sion, Math. Med. Biol. 1, 169–191, 1984.
[30] R. Tekin, E.C. Dinleyici, M. Ceyhan, A. Karbuz, N. Salman, M. Sutcu, Z.Kurugol, Y. Balliel, M.Celik, M. Hacimustafaoglu, N. Kuyucu, M.Kondolot, G. Sensoy, O.Metin, S.S. Kara, M. Dinleyici, O.Kilic, C. Bayhan, V. Gurbuz, E. Aycan, A. Memedova, A. Karli and S. Celebi, The prevalence, serogroup distribution and risk factors of
meningococcal carriage in adolescents and young adults in Turkey, Hum. Vaccin.