201
ARAŞTIRMA MAKALESİ / RESEARCH ARTICLE
AURUM - Journal of Engineering Systems and Architecture (A-JESA)
KEY VALUE STREAM APPROACH FOR INCREASING THE EFFECTIVENESS OF BUSINESS PROCESSES
Semra BİRGÜN
İstanbul Gedik University, Department of Industrial Engineering, İstanbul / TURKEY E-mail: [email protected], 05323530976, ORCID No. 0000-0001-5018-6120
Kemal Güven GÜLEN
Tekirdağ Namık Kemal University, Department of Industrial Engineering, Çorlu-Tekirdağ/TURKEY E-mail: [email protected], 05322167135, ORCID No. 0000-0002-7853-2766
GELİŞ TARİHİ/RECEIVED DATE: 01.08.2020 KABUL TARİHİ/ACCEPTED DATE: 25.12.2020
Abstract
In today’s competitive environment, the firms must have a flexible structure in order to quickly respond to the changes in customer requirements and to offer quality products while keeping the costs at a minimum. To gain competitive advantage, firms need to adapt to lean production and continuous improvement processes. This paper introduces a methodology – developed using Axiomatic Design principles – as a way to achieve a systematic approach in improving the organizational performance. This methodology is also tested and validated via case study.
Keywords: axiomatic design; key value stream; organizational performance; lean production; value stream
mapping
İŞ SÜREÇLERİNİN ETKİNLİĞİNİ ARTTIRMAK İÇİN ANAHTAR DEĞER AKIŞI YAKLAŞIMI
Özet
Günümüzün rekabetçi ortamında, firmalar, müşteri gereksinimlerindeki değişikliklere hızlı bir şekilde yanıt verebilmek ve maliyetleri minimum düzeyde tutarken kaliteli ürünler sunabilmek için esnek bir yapıya sahip olmalıdır. Rekabet avantajı elde etmek için firmaların yalın üretime ve sürekli iyileştirme süreçlerine uyum sağlamaları gerekmektedir. Bu makale, Axiomatic Tasarım ilkeleri kullanılarak örgütsel performansın iyileştirilmesinde sistematik bir yaklaşım elde etmek üzere geliştirilen bir metodoloji sunmaktadır. Metodoloji ayrıca bir vaka çalışması ile test edilmiş ve doğrulanmıştır.
Anahtar Kelimeler: aksiyomlarla tasarım; anahtar değer akışı; örgütsel performans; yalın üretim; değer akışı
202
1. INTRODUCTION
In recent years, enterprises mostly apply lean principles on production areas to become competitive in their sectors. Lean philosophy has been successfully implemented in companies as it improves quality, productivity, service, capacity, standardization, transportation systems, and flexibility while reducing inventory, lot sizes, lead times, unit costs, design time, space, and energy consumption.
The starting point of the lean production is the value which can only be defined by the end the customer who is interested in such factors as the product value, effectiveness, and quality (Birgun, 2006). In this context, the “value” can be defined as the creation of a product or service with specific properties the customer is willing to pay a certain price to meet his/her requirements in specific timeframes (Rother and Shook, 1998). In other words, it is the perceived properties of the product by the customer.
Customers typically do not want to pay for anything which does not add any value from their perspective such as excess stock, unnecessary motion, correction of mistake, e.g., any waste. Therefore, waste should be first defined in order to be eliminated. Lean production is a holistic approach which bases on removing the waste from the system and consistently improving the efficiency. Improving material and information flow across the business functions, an emphasis on customer pull rather than organization push (enabled on the shop floor with kanban), and a commitment to continuous improvement enabled by people development are the key principles of lean production (Womack, Jones & Roos, 1990; Womack and Jones, 2003).
Taiichi Ohno (1988), the father of Toyota Production System, defined “waste” as any human activity which absorbs resources but creates no value. In other words, performing a wasteful activity adds no value but incurs cost. Waste is also defined by Ford as “if it does not add value, it is a waste” (Suzaki, 1988). Hay (1988) suggested an American definition of waste by modifying the Toyota definition to include “value added” and defines waste as “anything other than the absolute minimum resources of materials, machines, and manpower required to add value to product”.
Ohno (1988) categorizes seven types of waste, namely “overproduction”, “waiting time”, “transport”, “processing time”, “unnecessary inventory”, “unnecessary motion”, and “defect production”. Bicheno (2004) also identifies seven types of waste: the waste of untapped human potential, the waste of inappropriate systems, wasted energy and water, wasted materials, service and office wastes, waste of customer time, and waste of defective products. Womack and Jones (2003) identify yet another waste as “design of goods and services which do not meet user’s needs”. Keyte and Locher (2004) also add another waste category as “underutilized people”. Gulen and Birgun (2007) define another type of waste as “data redundancy”. They would like to emphasize that data redundancy not only causes waste of material and work force, but it is also a source of misinformation and/or inconsistent information flow due to denormalized data. Lean philosophy enables integrity that is called “wholism” as applying to business systems just as the production systems. Simplification of work flows and elimination of waste must also be the targets for business systems. Contrary to inventory, repetitive production processes, and production flows in the production systems, business systems have orders to be filled, order processing procedures and customer
203 order flows through the departments. In this way, it is stated that the activities which cause the waste
such as routing, mailing, filing, proofing, etc., are the target areas for business systems which need to be reduced by the lean philosophy (Birgun, et al, 2006). There are several lean strategies that can be applied to business systems such as worker or department responsibility for quality control, scheduling business work at less than full capacity, increase worker flexibility, restructure the business layout to simplify work methods and to improve the application of lean principles, and increase standardization of product processing (Durmusoglu & Taylan, 1995).
A “value stream” is all the actions, both value added and non-value added required to bring a product through two essential main flows: the production flow from raw material to customer and the design flow from concept to launch (Rother and Shook, 1998). The value stream is also the set of all specific actions required to bring a specific product (a good, a service, or both) through the three critical management tasks of any business: problem solving, information management, and transformation (Womack and Jones, 2003). Value Stream’s point of view requires to work on the big picture and to improve the whole system rather than trying to improve each process separately.
The process of mapping the material and information flows for all components and sub-assemblies in a value stream which includes manufacturing, suppliers, and distribution to the customer is known as “value stream mapping” (Seth and Gupta, 2005). Value stream mapping (VSM) is gaining acceptance as a valuable tool for identifying waste. It is more useful than many quantitative techniques such as non-value added steps, procurement times, distance travelled, inventory level, or preparing plant layouts. The purpose of this paper is to introduce a new systematic model with a solid scientific foundation for the improvement of organizational performance targeting to identify the required steps to increase the effectiveness of the business processes. The Key Value Stream Methodology (KVSM) is a road map for its users and systematically identifies the required steps in order to improve the firm performance. Its steps can be easily used by any institution trying to become lean. Furthermore, this methodology is guided by the Axiomatic Design principles with the purpose of providing to its user a scientific foundation for the logical and theoretical thinking processes and the related tools.
In the following sections, Axiomatic Design principles are briefly described; the KVS, developed based on the Independence Axiom, is explained in details; the evaluation of this methodology in the documentation system of a manufacturing enterprise is presented followed by discussions and propositions about the methodology.
2. AXIOMATIC DESIGN
Axiomatic Design (AD) provides a scientific basis by giving the designer the logical and theoretical processes and tools (Kulakli and Birgun, 2007). The purpose of the Axiomatic Design is to provide a scientific foundation and the necessary logical processes and tools so that the designer can carry out the necessary activities (Kulak and Kahraman, 2004). The main advantage of Axiomatic Design over other processes is the fact that it can simplify the design resulting to an easier solution (O’Donnel, 1992). Axiomatic Design principles are used in the proposed model because of its ease use, and its more systematic approach.
204
2.1. Functional requirements of the design
The requirements for a product or a process are captured within a Functional Requirements (FRs) which is a set of minimum independent requirements fully identifying the customers’ requirements. Accordingly, every functional requirement is independent from other functional requirements. Functional Requirements (FRs) identify what needs to be achieved and Design Parameters (DPs) identify how they can be achieved (Suh, 1990).
2.2. Constraints of the design
Design constraints can be defined as the required limitations for acceptable solutions. They can be classified as input constraints limiting the design and system constraints limiting the production system (Kulak, 2004).
2.3. Design axioms
According to the AD approach, a good design is based on two axioms. The first one being related to the relationships between functional and physical variables, and the second one dealing with the complexity of the design (Suh, 1990; Sadeghi, 2017).
1. Independence axiom (provides the independence of the functional requirements set), 2. Information axiom (minimizes the design’s informational content).
2.3.1. Independence axiom
The independence axiom can be defined as the route to follow, throughout the design process, by Zigzagging between functional requirements (FRs) within the functional domain and design parameters (DP) within the physical domain. According to the AD approach, all designs consist of four domains. These are defined as “Customer Domain” (CA), “Functional Domain” (FR), “Physical Domain” (DP) and “Process Domain” (PV) and they provide the continuous data processing within and between themselves. Customer Attributes (CAs) are identified within the customer domain and then formulated within the functional domain where independent Functional Requirements (FRs) set needed for the solution is identified. The design will then be based on the planning of the activities between Functional Domain asking the question “What do you want to do?” and Physical Domain asking the question “How can we achieve?” and consisting of Design Parameters (DPs). Design Parameters are then mapped to process variables of the process area. Here, the movements between the “what” question and the “how” question is defined as the “Mapping” (Cochran and Reynal, 1996; Delaš, J. Škec, S. and Štorga, 2018).
The mapping between Customer Domain and Functional Domain is called “Concept Design Phase”; the mapping between Functional Domain and Physical Domain is called “Product Design Phase” and the mapping between Physical Domain and Process Domain is called “Process Design Phase” (Yasar et al, 2005).
205 “Design Hierarchy” is the movement from higher levels to lower levels with more details. Based on the
purpose of the design, there is a hierarchy within every Information Domain. The design, defined as the mapping of Functional Requirements (FRs) within the functional information domain and Design Parameters (DPs) within the physical information domain can be formulated mathematically. In this formulation, Functional Requirements can be defined as an “m” component “FR” vector and Design Parameters as an “n” component “DP” vector (Kulak, 2004).
The mapping between Functional Requirements (FRs) and Design Parameters (DPs) can be defined with vectors and Design Matrix defines the relationships between FRs and DPs (Suh, 1995).
{FR}: Functional Requirements vector; defines what the designer wants from the design purpose point of view,
{DP}: Design Parameters vector; identifies how the designer is going to achieve the design purpose. [A] : Design Matrix
{FR} = [A] {DP}: Design Equation
Design Matrix (A) is defined as
Every Aij element of the matrix must relate a component of the FR vector with a component of the DP vector and can be generally expressed as:
Design Matrix elements; . Design Matrix properties being uncoupled (the non diagonal elements of the matrix are zero), decoupled (the elements above the diagonal elements of the triangular matrix are zero), or coupled (where there are non zero non diagonal elements above the triangular matrix) defines the type of the design (Delaš, J. Škec, S. and Štorga, 2018).
Uncoupled design: The type of the design is identified by the structure of the Design Matrix. If the non diagonal elements of the matrix are zero Diagonal Matrix, the [A] matrix is uncoupled. It is very difficult to obtain this form in real life. According to Suh (2001), the simplest design matrix is the one where non diagonal elements of the matrix are all zero.
In the above A Design Matrix; A12=A13=A21=A23=A31=A32=0. Accordingly, the equality {FR} = [A] {DP} can be written as:
206
FR1=A11DP1 FR2=A22DP2 FR3=A33DP3
Consequently, a design where the diagonal elements are non zero and the non diagonal elements are zero is called an “Uncoupled Design” and conforms to the Independence axiom (Kulak, 2004).
Coupled design: As opposed to uncoupled design, a coupled design has many none zero elements such as:
Having many none zero elements. When we apply this matrix to the relations between Functional Requirements (FRs) and Design Parameters (DPs), we obtain:
FR1=A11DP1+A12DP2+A13DP3 FR2=A21DP1+A22DP2+A23DP3 FR3=A32 DP2+A33DP3
The change in FR2 can not be achieved with a simple change in DP2 since DP2 affects FR1 and FR3 as well and violates the design’s first axiom. This type of design is called coupled design (Kulak, 2004).
Decoupled design: A coupled design can be transformed to a decoupled design. This is a very common application. The equation where the design matrix is triangular (A12 = A13 = A23=0) (Triangular Matrix) is given below:
If the design parameters (DPs) can be arranged in a special order, the functional independence of the functional requirements (FRs) can be achieved the design will conform to the first axiom.
2.3.2. Information axiom
Information Content is a measure of complexity. Information Content of a design must be minimized and the most potentially successful design must be chosen. Therefore, the design with the least Information Content is considered the best design and facilitates the selection when there are more than one design candidates (Yasar et al, 2005).
207 Information Content can be mathematically expressed as the logarithm of the probability of meeting the
functional requirements. Therefore, Information Content for FRi can be expressed as: where
Ii: Information Content FRi
Pi: the probability of meeting the requirement log2: Base 2 logarithm.
Accordingly, the total Information Content, for “n” requirements will be equal to the probability of meeting all requirements and the system will not work as it approaches infinity. If the total is “1”, it will imply that Information Content is zero and when one or more probabilities are equal to zero, the necessary information will be infinite.
2.4. Axiomatic design examples in the literature
Axiomatic Design has been, especially in the last decade, used in a variety of areas and continues its expansion to new areas. In the literature, there are many products, software, quality, production systems, and system designs where Axiomatic Design principles are used.
Suh (1995) studied the decoupling of large systems using Axiomatic Design. AD is also used in the design of lean systems. Cochran and Reynal (1996) use AD in the design of manufacturing systems. Reynal and Cochran (1996) also use a design methodology for lean production which connects manufacturing system design objectives to operation design parameters. It also focuses the design of operations by eliminating non value added time or waste. Bröte et al (1999) apply AD for integrating the production information system with manufacturing cell design in a lean environment. Cochran et al (2000) worked on production system decoupling design using AD and Lean Production principles. Hintersteiner (2000) used AD to improve communication between the customer and design engineers based on the Lean Enterprise Model. Oropeza et al (2001) use AD for developing a set of requirements for the design of manufacturing systems. Houshmand and Jamshidnezhad (2002) studied conceptual Lean Production systems and developed a model using the AD approach. Kulak and Durmusoglu (2004) developed a procedure for the design of cellular manufacturing systems using AD principles. Kabadurmus and Durmusoglu (2005) developed the design of a pull (kanban) production control system by implementing AD principles. Birgun (2006) proposed a road map for companies to operate more efficiently and systematically for value stream mapping the AD. By using AD, Hesselbach (2011) developed a a matrix that relates functional requirements of improving energy efficiency of machine tools to design parameters. Salonitis (2016) proposed a framework to improve the design approach for additive manufacturing, both for the development of new products and the redesigning of existing products, using AD. Goodarzi et al (2020) developed a framework for implementing manufacturing cloud service composition by AD and game theory.
208
3. ORGANIZATIONAL PERFORMANCE IMPROVEMENT
All the processes to be improved cannot be considered simultaneously in the organization. This creates many problems on the organization such as harmonization of the workers (activities of scheduling and job tracking) as well as mapping the processes companywide. On the other hand, costs cannot be accounted for the new applied processes explicitly, and this also brings new problems. As well, project teams cannot be organized and managed effectively. Therefore what is needed is a systematic approach ensuring that all the processes can be sorted out through the selected criteria by the managers of the organization. KVS methodology is a tool to achieve a systematic approach in improving the organizational performance. The first step in systems development with axioms is to identify the purpose, being the most important step in design hierarchy. Here the purpose must be clearly identified. In the second step, design parameters are identified as “DPs”. While the functional requirements identify what is going to be achieved via the design, design parameters (DPs) specify how the functional requirements are to be achieved. The functional requirements (FR) and design parameters of KVS are as follows:
FR1: Improve Organizational Performance
DP1: Process Improvement Using KVS Methodology
If the design parameter corresponding to the functional requirement identified in the first step cannot be applied, Axiomatic Design principles suggest returning to the functional area and to uncouple this functional requirement as a set of functional requirements at a lower level and identify the corresponding design parameters. The following functional requirements and the design parameters obtained by moving from the functional area to the physical area will be used for this purpose. The support for the decision making in the KVS methodology is as follows:
FR11: define all the processes DP11: using SWOT analysis FR12: select key value stream DP12: KVS selection procedure FR13: start key value stream analysis DP13: using through ranking FR14: analyze key value stream DP14: using value stream mapping FR15: design future state
209 FR16: realize changes
DP16: tying the value stream design to the company’s business objectives FR17: measure system performance
DP17: using performance metrics FR18: enable value stream management DP18: applying lean principles
FR19: repeat the procedure
DP19: starting next key value stream analysis
The design matrix identifying the relationships between these functional requirements and the corresponding design parameters is:
The resulting design matrix is a decoupled one and conforms to the independence axiom, X denoting the strong relationship between the functional requirement and the corresponding design parameter. Using the same approach, the model expands as:
FR11: define all the processes DP11: using SWOT analysis
Defining the processes can be implemented by the top managers of the firm through the strategic plans and the needs of the firm. SWOT analysis is used to define all the processes as an effective tool.
FR12: select key value stream DP12: KVS selection procedure
The executives identify the important factors for the company amongst the important competitive key factors such as total production cost, lead time, working quality, number of deliveries on time, customer
210
satisfaction, documentation quality, ordering convenience. The executives are asked to meet in a brainstorming session to identify 5 to 9 key factors important to evaluate the ranking of the value streams and/or to identify the sources of the waste. These key factors are then assigned a weight totalling to 1.
FR121: identify competitive key factors DP121: brainstorming
The candidate value streams are identified to be evaluated by the executives. In this step, first of all, it is essential to group the products into product families whenever possible. Managers can select various factors for this grouping. Some of these factors are highest product volume in $, highest product volume in units, products with highest defect rates or costs, products with the highest customer returns, products that visit the most processes, etc. Before grouping, these products are simply put into a check sheet related to process steps and they can be assessed based on used processes. Then, they can be identified as product groups and candidate value streams related to the key factors.
Each candidate value stream is given a score between 0 and 100 for each key factor identified in Step 1. Then weighted sums are separately calculated for candidate value streams.
FR122: sort the value streams
DP122: applying factor rating method
The design matrix identifying the relationships between functional requirements and the design parameters is:
The resulting design matrix is an uncoupled one and conforms to the independence axiom. FR13: start key value stream analysis
DP13: using through ranking
The weighted sums, calculated before, for each candidate value stream, are then ranked in descending order and the value stream with the highest weighted sum is selected as the “Key Value Stream” (KVS).
FR131: select key value stream to be analyze DP131: considering the first one through ranking
The scope of the KVS is identified before its analysis. During the mapping phase, scoping can be done at four levels: “Across Companies”, “Single or Multiple Sites”, “Cross Functional”, and “Process” levels. “Across Companies” level is applicable for value streams where different or all streams based on supply chain models are considered. “Single or Multiple Sites” level covers the value stream created for external customers at different facilities of the company. “Cross Functional” level is appropriate when the mapping includes different functions of the company. In general, scoping starts at “Single or Multiple Sites” level
211 and continues with “Cross Functional” level. “Process” level is restricted to a related group of operations
among many activities in the company. The starting level is not important for the mapping. FR132: scope key value stream
DP132: defining needs
The design matrix identifying the relationships between these functional requirements and the corresponding design parameters is:
The resulting design matrix is an uncoupled one and conforms to the independence axiom. FR1321: determine manageable boundaries
DP1321: deciding upon an appropriate level of details
At this stage, the mapping team is formed. It is desirable to include members from every function in the KVS. FR1322: set the key value stream project team
DP1322: selecting appropriate staff
The design matrix identifying the relationships between these functional requirements and the corresponding design parameters is:
The resulting design matrix is a decoupled one and conforms to the independence axiom. FR14: analyze key value stream
DP14: using value stream mapping
Value stream viewpoint requires working with the big picture and improving the whole, rather than dealing with and improving each process separately. VSM is a way to plan for lean application by helping how to design the whole door-to-door flow. Decomposition of FR14andDP14 is as follows:
FR141: assess the current state DP141: mapping current state
Instead of recording each and every individual processing step, the process categories are first drawn. Downstream process is the starting point of the mapping and work continues upstream. The current state is mapped by collecting and using actual data. Cycle time, changeover time, production batch sizes,
212
number of product variations, number of operators, pack size, working time (minus breaks), scrap rate, on-demand machine uptime, days of inventory on-hand, first time through capability, health and safety record, percent complete and accurate, reliability, information technology used, available time, etc. are needed to decide what the future state will be.
Information value stream is the set of activities and processes supporting an enterprise’s production requirements. Purchasing, sales, planning, etc. processes involve both value added and non-value added activities throughout the information flow. Office administration differs from manufacturing in the sense that material flow in the office is actually the flow of hard or soft data to fulfil a service. Although the information flow mechanism is the same for both office administration and manufacturing, it is rather informal and loosely structured, therefore more difficult to map in the office environment. In general, the difficulty is due to the fact that each administration unit is involved in many value streams and each value stream goes through many administration units, thus creating an M-M (Many to Many) relationship. Managers usually think that their units contribute rather independently to the organization’s success and can not see these interactions.
FR1411: document customer information and needs DP1411: obtaining necessary data
FR1412: identify methodology
DP1412: observing and studying value stream FR1413: select process metrics
DP1413: considering lean principles
The design matrix identifying the relationships between these functional requirements and the corresponding design parameters is:
The resulting design matrix is a decoupled one and conforms to the independence axiom. FR142: determine value from waste
DP142: utilizing the five-why technique
213 There are several key metrics that will set a baseline and assist in developing goals and an action plan
to reach these defined goals (Dolcemascolo, 2006; Keyte and Locher, 2004). Some of these metrics are expressed as value creating time, in plant time, transport time, total time, value % of time, value % of steps, inventory turnover, product travel distance, order-to- cash lead time, order-to-ship lead time, percent complete and accurate, reliability, etc.
FR15: design future state DP15 : mapping future state
Once the problems are identified and the solutions are decided by analyzing the current state map, future state of the flow showing how the flow should be drawn by asking a set of critical questions (Rother and Shook, 1998). The developments of current and future states are overlapping efforts. Beyond these activities, an action plan in the form of a yearly value stream plan is also created describing how to plan the transition from current state to future state (Rother and Shook, 1998; Womack and Withers, 2000; Ertay et al, 2001).
FR151: assess customer requirements DP151: utilizing database
FR152: determine management time-frame DP152: designing performance plans FR153: remove waste
DP153: using lean principles FR154: design work flow DP154: line balancing FR155: set pull system
DP155: using in-process supermarket and/or Kanban FR156: levelling production
DP156: using appropriate techniques
The design matrix identifying the relationships between these functional requirements and the corresponding design parameters is:
214
The resulting design matrix is a decoupled one and conforms to the independence axiom. FR16: realize changes
DP16: tying the value stream design to the company’s business objectives
There are many critical success factors in achieving future state which should be implemented without delay. The essential factors for this transformation are the understanding and commitment to lean concepts by the organizational leaders, proper authority and adequate time for value stream managers to coordinate and facilitate the implementation, and detailed implementation plans developed by team members which are then used to manage the implementation.
The best approach is for the mapping team to divide the work into logical groups called loops. Loops typically represent areas of flow. The focus should be on the implementation within each loop. The value stream manager is responsible for prioritization during implementation. For a successful implementation, the loops should be scheduled based on this prioritization. First priorities should be given to the activities of the loops deemed to have the most effect on the system.
FR161:break the work plan into loops DP161:defining loops
FR162: prioritize loop implementation DP162: beginning with pacemaker loop
FR163: create a work plan and cross-functional implementation teams DP163: using Kaizen
The design matrix identifying the relationships between these functional requirements and the corresponding design parameters is:
215 The resulting design matrix is a decoupled one and conforms to the independence axiom.
FR17: measure system performance DP17: using performance metrics
Once the kaizens are carried out, the corresponding improvements should be measured using the metrics defined by the team. Typical metrics for an enterprise are various lead and processing times, inventory turnover, reliability, percent complete and accurate, etc. It should be noted that score data need to be used instead of nominal or ordinal data in order to accurately measure the system performance improvements. Unsatisfactory performance increases can be further improved by re-applying KVS periodically. In essence, KVS should be considered as a continuous improvement process.
FR18: make enable value stream management DP18: applying lean principles
Project managers make use of Value Stream Management constantly through the processes to be considered. In order to succeed, lean principles are applied systematically.
FR19: repeat the procedure
DP19: starting next key value stream analysis
Then, as future state becomes reality for KVS, the mapping process repeats itself for the remaining value streams each being defined as KVS based on their ranking. Then the whole KVS model reapplied as part of continuous improvement.
4. KEY VALUE STREAM IMPLEMENTATION
The firm where the KVS is applied manufactures spare parts for the auto industry. In the firm, lean manufacturing is introduced to its manufacturing system. Therefore, business processes supporting manufacturing also needs to be improved. Given great emphasis to quality, the firm has the certification of ISO9001:2000 Quality System, TS 16949:2002 Auto Quality System and ISO 14001:2004 Environment Management System. The methodology is applied as below:
The KVS Model Application has started by the identification of the “key factors” by the executives for the company to be successful in the competitive environment. As in any other project, top management support was necessary for this project to succeed. It was observed that the resistance to change originated mainly from the mid level managers. However, thanks to the training program on lean philosophy, collaboration and support have been achieved from all levels within the company, including the midlevel
216
managers. Therefore, no resistance has been encountered during the information flow analysis. Based on the KVS Model, executives initiated a brainstorming session to identify the key factors. In this session, by discussing the strong and weak points of the company and evaluating the potential dangers and opportunities in the market, they identified the key factors for the KVS application. Table 1 show these key factors in descending order by their importance.
Thanks to a brainstorming session during the second meeting, the following six processes are identifies as the candidate value streams:
VS 1: purchasing VS 4: marketing
VS 2: cost accounting and budget control VS 5: project & design
VS 3: sales VS 6: production planning
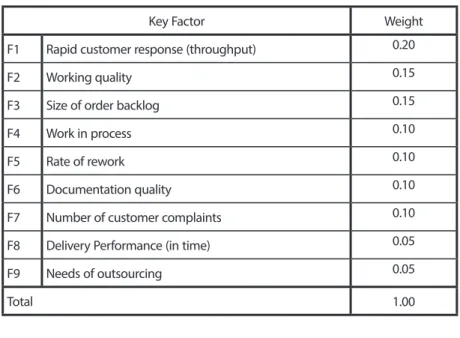
Once defined by the value stream management, streams are weighted based on nine key factors by the management. Table 2 shows these nine key factors and their relative weights and the scores for the six value streams.
217 Based on the KVS Model, first ranked candidate is named as the Key Value Stream (KVS). According to
ranking in Table-3, VS6: Production planning value stream is selected as KVS (VS6 º KVS), expecting its analysis and improvement will be the most beneficial to the company. VS6 is identified as the key value stream”.
Table 2. Ranking Value Streams through Key
Key Factor Weight
F1 Rapid customer response (throughput) 0.20
F2 Working quality 0.15
F3 Size of order backlog 0.15
F4 Work in process 0.10
F5 Rate of rework 0.10
F6 Documentation quality 0.10
F7 Number of customer complaints 0.10
F8 Delivery Performance (in time) 0.05
F9 Needs of outsourcing 0.05
Total 1.00
Table 3. Ranking Key Value Streams
Rank Key Value Stream Weighted Sums
1 VS 6 80 2 VS 1 78,5 3 VS 5 76,5 4 VS 4 76 5 VS 3 71,5 6 VS 2 64,5
Based on the KVS Model, first ranked candidate is named as the Key Value Stream (KVS). According to ranking in Table-3, VS6: Production planning value stream is selected as KVS (VS6 º KVS), expecting its analysis and improvement will be the most beneficial to the company. VS6 is identified as the key value stream”.
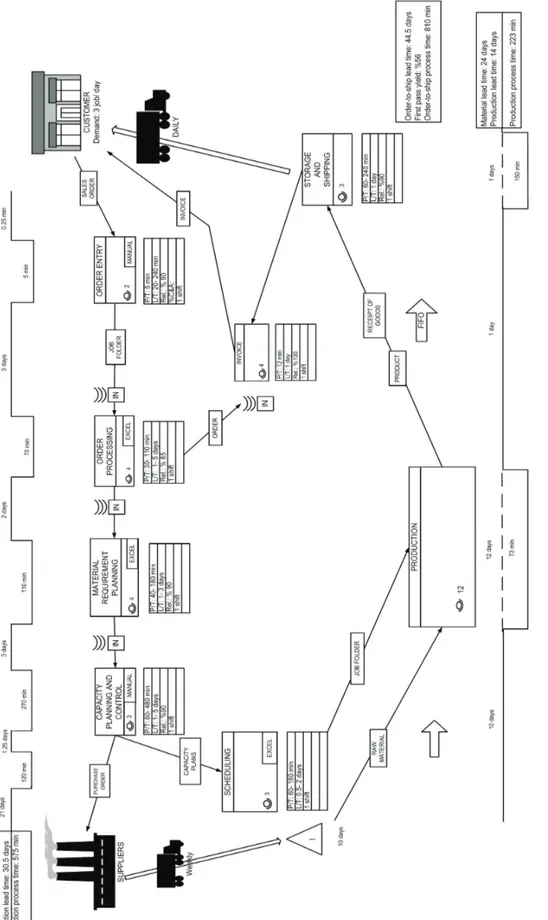
Selected KVS goes through almost every department in the organization. It starts with the order entry that received from customers; continues with the order processing activity. Then, material requirements planning (MRP) are performed. Capacity planning and control activity involves preparing purchasing orders and/or manufacturing orders for items that are out-of-stock. After production plans has been
218
realized, product and its document is sent to the storage area. Customer orders are fulfilled through delivered products and invoices. For this reason, it is decided to conduct the analysis at multiple sites with door-to-door boundaries. At this point, a team of six people consisting of a value stream manager and five value stream members is formed. Team members are selected from the Material Requirements Planning, Capacity Planning and Control, Scheduling, and, Accounting and Administration departments where the key value stream under consideration flows, a typical member being a foreman who attended the internal lean production training program.
Delivery is realized daily with trucks. As it can be seen from the analysis of the current state map (Figure1), the value added activities of pre-production process time is 575 minutes, and order-to-ship process time is 1.58 days whereas order-to-ship lead time is 44.5 days, meaning that 96.5 % of the elapsed time is wasted. Purchasing time length, collecting the documents, waiting approvals, corrections, and completing some shortages, etc. are causes of that result. More than required copy and collecting of the documents are also causes of the inefficiencies.
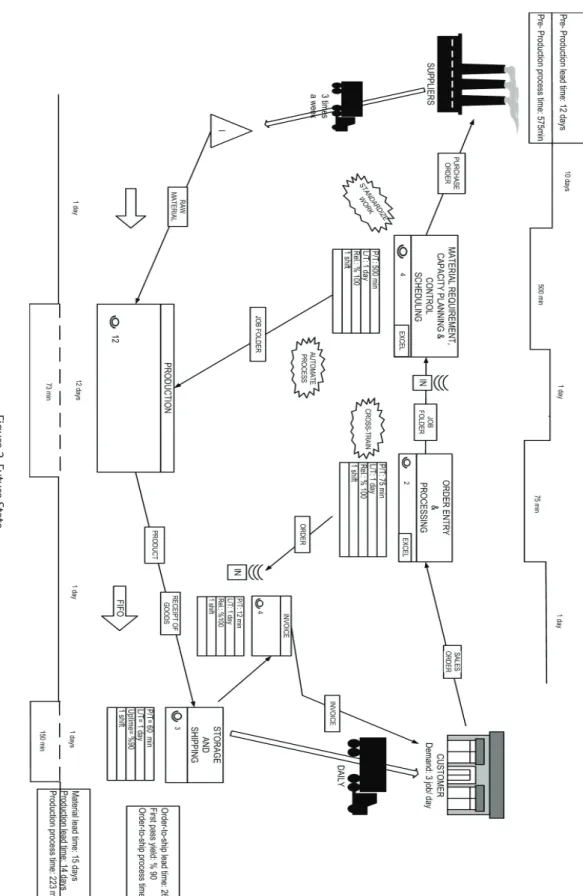
In the future state, order entry and order processing activities are planned merging them into one function in the firm. On the other hand, material requirements, capacity requirements planning, and scheduling are planned in one office. Thus, document flows among the offices are reduced to only between two offices. Considering the 170 minutes takt time, two people in “order entry & processing” office, and four people in “material requirement, capacity planning & control, scheduling” office are employed. By implementing these suggestions, better monitoring of the process, minimizing the number of documents required, realizing continuous document flow, and creating better information flow are achieved. Furthermore, cross-trained personnel, automatized processes, standardized works are the kaizens in the future state, as shown in Figure 2.
In this study, wastes that are basic source of firms’ inefficiencies are tried to be eliminated. Specifically, office application has been regarded. Various studies on office application can be improved alternatively.
219 Figur e 1. Cur ren t S ta te
220 Figur e 2. Futur e Sta te
221 At first, the current state of production planning process is analyzed and then improvements are proposed
for the system performance. As a result of KVS, pre-production lead time will be decreased from 30.5 days to 12 days and order-to-ship lead time will also be decreased from 44.5 days to 26 days if the suggestions are applied. In the future state, first past yield will be increased 62.2%.
5. CONCLUSION
In today’s competitive environment, companies operating with limited resources need to plan their activities in a systematic structure in order to use their resources effectively and efficiently. However, mapping and improving all processes related to many activities within a company can not start simultaneously and may not even be practical leading to complex financial problems due to the cost calculations of the improvements.
In this paper, we offer KVS methodology where a value stream selection process is used to identify and rank various value streams in a firm for process improvement. A value stream ranking has been proposed where the executives identify, through brainstorming meetings, the important factors for the firm amongst the important competitive key factors. We then propose the use of value stream mapping and key performance metrics to evaluate the improvements. Applying axiomatic design imposed a more disciplined process to design KVS.
We applied the methodology in a manufacturing company to demonstrate how the KVS model we developed can be successfully applied to improve administrative activities within the enterprise. It should be noted that information flow in the processes can not be seen as much as production flow. Because of this, an application team has to be focused on information flow to detect related waste. Otherwise, they can not identify and pay attention to the necessary processes since they can not distinguish the right things from the wrong. AD makes enable the managers to analyse systematically; it provides a basis to apply of more complex and different KVS implementations.
6.REFERENCES
Bicheno, J. 2004. The new lean toolbox, towards fasts, flexible flow. PICSIE Books, Buckingham.
Kulakli, A., and S. Birgun. 2007. Creating the Customer Centric Knowledge Management Strategy by Axiomatic Design Principles, Dedicated to Sitki Gözlu, Caglayan Pub., 245 – 255.
Birgun, S., K.G. Gulen, and K. Özkan. 2006. A Case Study on Eliminating Waste from the Business Processes, 15th International Business Congress, International Management Development Research Yearbook, Bosnia-Herzegovina, 41 – 46.
Bröte, S., D.S. Cochran, A. Mierzejewska, B. Carrus, S. Rupp, and J. Smith. 1999. Integrating the production information system with manufacturing cell design – a lean, linked cell production system design implementation. Global Mobility Database. Society of Automotive Engineers, Inc., USA, 13.
222
Cochran, D.S., and Reynal, V.A. 1996. Axiomatic design of manufacturing systems. The Lean Aircraft Initiative Report Series, RP96-05-14, Massachusetts Institute of Technology.
Cochran, D.S., W. Eversheim, G. Kubin, and M.L. Sesterhenn. 2000. The application of axiomatic design and lean management principles in the scope of production system segmentation. International Journal of Production Research (38) 6, 1377 – 1396.
Delaš, J., S. Škec, and M. Štorga. 2018. Application of Axiomatic Design principles in conceptual design. M. MATEC Web of Conferences (223), 1-9.
Dolcemascolo, D. 2006. Improving the Extended Value Stream: Lean for the Entire Supply Chain. Productivity Press, New York.
Durmusoglu, S., and O. Taylan. 1995. An application of JIT philosophy to administrative operations in a refractory brick plant. Ninth World Productivity Congress, Istanbul, New Visions and Strategies for the Next Century: People, Technology and Productivity-Proceedings, Vol.1, 540 – 556.
Ertay, T., S. Birgun Barla, and O. Kulak. 2001. The Studies for Lean Implementation in A Manufacturing Environment: A Case Study. Proceedings of the Int. Conf. on Industry, Engineering, and Management Systems (IEMS) and The Int. Conf. on Computers and Industrial Eng. (28th ICC&IE/IEMS), Florida, 890 – 895. Goodarzi, E.V., M. Houshmand, O.F. Valilai, V. Ghezavati, and S. Bamdad. 2020. Using Axiomatic Design for developing a framework of manufacturing cloud service composition in the equilibrium state Conference: ICAD 2020: 22th International Conference on Axiomatic Design, At Helsinki, Finland. Gulen, K.G., and S. Birgun. 2007. Creating Value in Enterprise Information System: KVS Model, in Erkollar, A. (Ed.), State of the Art & Business Management a Handbook for Educators, Consulters and Practitioners, Tectum Verlag, Marburg, 148 – 176.
Hay, E.J. 1988. The Just-in-Time Breakthrough-Implementing the New Manufacturing Basics, USA, John Wiley&Sons.
Hesselbach J., and C. Herrmann. 2011. (eds.), Glocalized Solutions for Sustainability in Manufacturing, Proceedings of the 18th CIRP International 274 Conference on Life Cycle Engineering, Technische Universität Braunschweig, Braunschweig, Germany.
Hintersteiner, J.D. 2000. Addressing changing customer needs by adapting design requirements. Proceedings of ICAD2000 First International Conference on Axiomatic Design, Cambridge, MA.
Houshmand, M., and B. Jamshidnezdah. 2002. Conceptual Design on Lean Production Systems through an Axiomatic Approach. Proceedings of ICAD2002, Second International Conference on Axiomatic Design, Cambridge, MA.
Kabadurmus, Ö., and M.B. Durmusoglu. 2005. The design of pull/ kanban production control systems by using axiomatic design. Proceedings of V. National Symposium on Production Research, Istanbul Commerce University, 313 – 317.
Keyte, B., and D. Locher. 2004. The Complete Lean Enterprise Value Stream Mapping for Administrative and Office Processes, Productivity Press, NY.
223 Kulak, O. 2004. A complete cellular manufacturing system design methodology based on axiomatic
design principles, Institute of Science and Technology, İTÜ, PhD Thesis, Istanbul.
Kulak O., and M.B. Durmusoglu. 2004. A complete cellular manufacturing system design methodology based on axiomatic design principles. Journal of İTÜ /d engineering, 3(6), 33 – 46.
Kulak, O., and C. Kahraman. 2004. Fuzzy multi-attribute selection among transportation companies using axiomatic design and analytic hierarchy process. Information Sciences (170), 191 – 210.
O’Donnell, J. 1992. When jobs are lost: outplacement guidance. Public Management(74), 2-6.
Ohno, T. 1988. Toyota Production System: Beyond Large-Scale Production. Productivity Press, Cambridge, MA. Oropeza, G., Tapia, C., D.S. Cochran. 2001. The manufacturing system design decomposition in the automotive electronics industry. Journal of Production Research.
Reynal, V.A., and D.S. Cochran. 1996. Understanding lean manufacturing according to axiomatic design principles, The Lean Aircraft Initiative Report Series.
Rother, M., and J. Shook. 1998. Learning to See, Version 1.2., The Lean Enterprise Institute Inc, Brookline, Massachusetts.
Sadeghi, L., M. Houshmand, and O.F. Valilai. 2017. Applications of Axiomatic Design Theory in Design for Human Safety in Manufacturing Systems: A Literature Review, MATEC Web of Conferences 127, 1-9. Salonitis, K. 2016. Design for additive manufacturing based on the axiomatic design method. The International Journal of Advanced Manufacturing Technology, 87, 989–996
Seth, D., and V. Gupta. 2005. Application of value stream mapping for lean operations and cycle time reduction: an Indian case study. Production Planning and Control, 16(1), 44 – 59.
Suh N.P. 1990. The Principles of Design. Oxford Press, New York.
Suh, N.P. 1995. Designing-in of quality through axiomatic design. IEEE Transactions on Reliability 44(2), 256–264.
Suh, N.P. 2001. Axiomatic Design: Advances and Applications. Oxford University Pres, New York. Suzaki, K. 1987. The New Manufacturing Challenge – Techniques for Continuous Improvement. The Free Press, New York.
Womack, P.J., T.D. Jones, and D. Roos. 1990. The Machine that Change the World. Rawson Associates, New York.
Womack, J.P., and D.T. Jones. 2003. Lean Thinking: Banish Waste and Create Wealth in Your Corporation. Simon and Schuster, New York.
Womack, J.P., and S. Withers. 2000. How Can We Create a Value Stream, available in http://www.lean.org Yasar, A.E., M.B. Durmusoglu, and M. Dincmen. 2005. Design of a knowledge management system based on axiomatic design principles. Proceedings of the 35th Int. Conf. on Computers and Industrial Engineering, 2125 – 2130.