Acoustical Design and Noise Control in
Metro Stations: Case Studies of the Ankara
Metro System
Article in Building Acoustics · September 2007 DOI: 10.1260/135101007781998910 CITATIONS9
READS187
2 authors: Some of the authors of this publication are also working on these related projects: Acoustical Characteristics of MaterialsView project Acoustics of Worship Spaces
View project Zühre Sü MEZZO STUDYO LTD 26 PUBLICATIONS 33 CITATIONS SEE PROFILE Mehmet Caliskan Middle East Technical University 162 PUBLICATIONS 84 CITATIONS SEE PROFILE
All content following this page was uploaded by Zühre Sü on 27 October 2014.
Acoustical Design and Noise Control
in Metro Stations: Case Studies of the Ankara
Metro System
Zühre Sü
1and Mehmet Çalıs¸kan
21Bilkent University, Department of Interior Architecture and Environmental Design,
06800 Bilkent, Ankara, Turkey, [email protected]
2Corresponding author, Middle East Technical University,
Department of Mechanical Engineering, 06531, Ankara, Turkey, [email protected]
(Received 21 October 2005 and accepted 6 February 2007)
ABSTRACT
The aim of this research is to demonstrate the importance of initial strategies in acoustical design of underground metro stations. The paper searches for practical design solutions by evaluating different materials for providing optimum acoustical conditions in such spaces. Acoustical designs of three metro stations on a new expansion line in Ankara including Sogutozu, Bilkent and ODTU metro stations are presented through computer simulation. Predictions of room acoustical parameters are presented for both platform and ticket office floors in terms of parameters like reverberation time (RT), speech transmission index (STI) and A-weighted sound level (SPL) distribution within spaces. Simulated reverberation times are evaluated in view of legislative requirements. The study confirms the importance of using sound absorbing materials on the ceiling and sidewalls together. The nonwoven material, used behind perforated metal suspended ceilings, has proved effective in reverberation control.
Keywords: Acoustical materials; underground metro stations; acoustical design strategies;
computer simulation. 1. INTRODUCTION
Metro systems improve the urban environment by relieving pressure on surface transportation, and reducing noise and improving air quality. Metro stations should provide both public and staff with clean and bright facilities enhanced by good design [Lawrence, 1994]. However, metro stations have acoustically problematic interior spaces. Research on noise control and acoustical design of metro stations is important especially from the standpoint of speech intelligibility. In an emergency, a public address system is essential for hazard warning or other information. Speech intelligibility should comply with a generally accepted minimum standard for such
cases. Another reason for noise control is that, low frequency noise in metro stations can cause vibroacoustic disease of station staff [Alves-Pereira et al., 2004].
However, other design decisions make it difficult to control the noise and decrease the level of intelligibility. An example is the use of hard and reflective material on internal surfaces of the stations for control of vandalism, fire, maintenance and hygiene. Interior surface materials are not selected primarily according to acoustic qualities, but rather for safety. The use of proper materials with different sound absorption and scattering properties has a significant role in the targeted performance. The total surface area of these materials located at appropriate places also affects the success of acoustical design.
Recent studies of metro stations are concerned with overall design factors. Altay [1997] studied the issues related to circulation and spatial orientation, safety, and the psychological and physiological comfort of users. The research identified noise levels as an important factor in environmental satisfaction. Durmisevic [1999] also studied the lighting, fire, air condition, wayfinding and psychological issues, but excluded the acoustical aspects. A more comprehensive study by Durmisevic and Sariyildiz [2001] examined the human and comfort factors in underground spaces. This study also included aspects of noise.
Metro stations are long enclosures with different acoustical properties to normal rooms, due to nonlinear decay characteristics. Therefore, the classical theory of acoustics is not appropriate for analysis. The sound prediction studies can be grouped in two broad classes, namely: studies on computer modeling techniques, and scale model investigations.
Computer modeling is concerned with the estimation of reverberation time and speech intelligibility. Kang [1997a] studied the basic characteristics of sound distribution and reverberation in long spaces. Lam and Li [2004] also studied reverberation time characteristics and developed a theoretical model for rectangular long enclosures. A ray tracing computer model was developed by Yang and Shield [2001] for prediction of intelligibility in stations with rectangular cross section. Speech intelligibility and speech transmission index were also studied by Shuo-xian and Yue-zhe [2004] using an image method. Harrison [2001] developed a calculation method for speech intelligibility of public address systems at metro stations. Carman [2004] developed a theoretical model for the prediction of train noise in stations and its effect on speech intelligibility. The studies on scale models are limited in number. Recently, Kang [1997b] used scale models with attention to the speech intelligibility of multiple loudspeaker public address systems. Another study by Kang [1997c] concerns the scale modeling of train noise propagation.
Volume, room shape and surface materials determine the acoustics of metro stations. Surface materials are not primarily selected on the basis of acoustic quality, but rather according to various safety-related criteria. The geometric proportions of the stations, combined with the reflectivity of tiled or concrete walls and ceilings result in long reverberation times that has an adverse effect on speech intelligibility [Wijngaarde and Verhava, 2001]. On the other hand, carefully designed combination of various architectural treatments can significantly improve the intelligibility and decrease noise pollution.
According to Kang [1997a] absorbers should be put on the surfaces of metro stations in order to improve the speech intelligibility. The efficiency of absorbers is
higher when there is less overall absorption within the space. To obtain a higher attenuation, the absorbers should be evenly arranged in a section. Crockett and Pyke [2000] demonstrated that for a given number of absorbers, when they are placed on the ceiling and sidewalls, instead of the ceiling only, the early decay time could be shorter, and the sound pressure level attenuation could be greater. The absorption can be increased by using absorptive parapet walls, by creating noise trap beneath the walkways, and by applying sound absorption on the interior facing of the skirts and on edge walls.
Shuo-xian and Yue-zhe [2004] studied the necessary treatments when the train is in the tunnel. Train noise can be reduced by a strongly absorbent section near the tunnel entrance. The absorbent treatment on an end wall is effective. Even a small area of absorption can systematically increase the sound attenuation along the length of platform.
Kang [1997a] studied membrane absorbers as typical non-fibrous sound absorbers. Carman [2004] examined spray-applied cementatious materials. The material is found to be effective when applied to the wall opposite the platforms as well as underneath the platform overhang. Irvine and Richards [1998] examined suspended ceiling treatment above the platforms. Ceiling systems of mineral fibre and glass fibre lay-in panels with required fire rating were found to be effective for metro station applications The aim of this research is to demonstrate the importance of basic design decisions in avoiding noise problems after these places are commissioned for use. The paper proposes practical acoustical design solutions. The acoustical designs of three metro stations on a new expansion line in Ankara are chosen as cases, where sample applications of the specific design solutions are demonstrated.
2. CASE STUDIES
The case studies were of Sogutozu, Bilkent and ODTU, metro stations serving a new line of the Ankara metro system. The use of different materials, in different amounts, and their effects on acoustics of the stations are analyzed. Acoustical parameters are predicted both for the platform and ticket office floors. The noise levels for single and double train passes are calculated. In addition, noise levels caused by the operation of tunnel ventilation and emergency ventilation fans are assessed.
2.1. Modelling procedure
The assessment of the acoustics of a space, at the design stage, used to be performed through scale models. This process is time consuming and expensive. It is now possible to analyze and evaluate acoustical properties prior to construction by computer simulation. Thus, the acoustical design can become an integral part of the architectural design process. Computer simulation has proven to be a viable tool in designing concert halls, opera houses, and multi-purpose auditoria. The approach not only minimizes the future acoustical problems, but also enables alternatives to be assessed in a short time [Schmidt and Kirkegaard, 2004].
In the present investigation, computer simulations of metro stations were performed using ODEON Room Acoustics Program 6.01 software package, released by the
Technical University of Denmark [Naylor, 1993]. The calculation method is based on an image-source method and ray tracing.
The process was initiated by importing a 3D model of each metro station in Data Exchange File (DXF) format. After importing the model, point sources, line sources, and receiver surfaces were defined. The receiver surfaces were divided into grids of 0.90 m by 0.90 m for grid response calculations. The grid response calculations enabled designers to assess different acoustical parameters in all frequency bands at each receiver point within the station. After the graphical model was verified for duplicate or overlapping surfaces, materials were assigned to the surfaces from a database. New materials were introduced by defining their absorption coefficients from 63 to 8000 Hz. The sound absorption characteristics of these materials are specified in detail under section 3.2.
Calculations included reverberation times, obtained by a global estimation method for platform and ticket office floors, which were modelled independently. In addition, overall distributions of the parameters on specified receiver surfaces were evaluated. For the platform floor, the distribution of the sound transmission index and the noise levels for single and double train passes were calculated. For the ticket office floors, calculation of STI distribution was considered sufficient. Finally, noise levels during the operation of emergency fans were assessed. Findings related to different parameters were compared with the acceptable values specified in the regulations contained in the Turkish Noise Control Act.
2.2. Architectural features 2.2.1. Room information
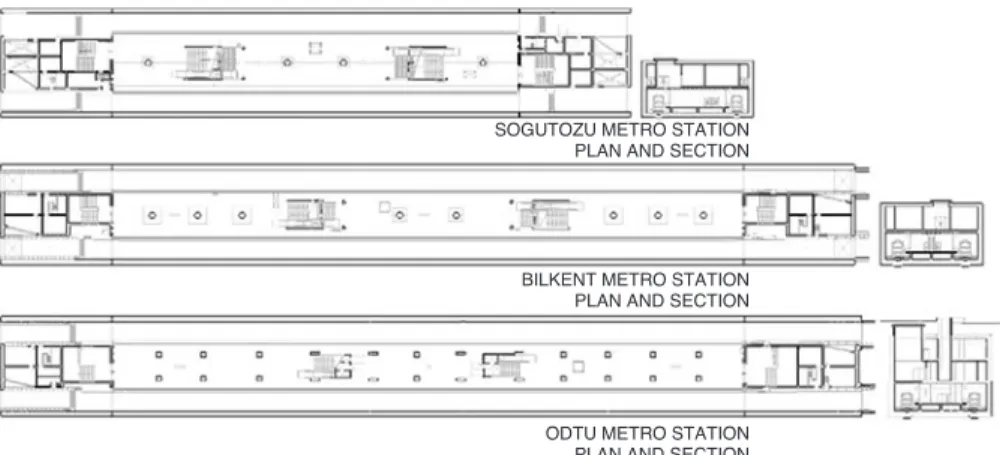
The plan and section of each station are given in Figure 1. Sogutozu light metro station is the smallest, with dimensions of 90 m ×22.75 m length ×width ratio at platform level. Bilkent and ODTU metro stations have the same dimensions with 140 m × 20.40 m length ×width ratio at platform level. However, ODTU metro station has a gallery level that forms a coupled space. Therefore, each station has different acoustical characteristics. The detailed room information for these metro stations is given in Table 1.
2.2.2. Surface materials
Materials used on the interior surfaces of the three stations were specified in the architectural projects, and complied with the requirements of fire, high circulation, maintenance and vandalism. In general, the materials had hard surface characteristics. The special type of ballast on the rail track and the suspended ceiling provide much of the sound absorption. The lay-in material used at the ceiling system (SoundTex®
Freudenberg Nonwovens Group. SoundTex®) was laid behind the 0.60 m × 0.6 m
perforated aluminium panels with an opening ratio of 15%.
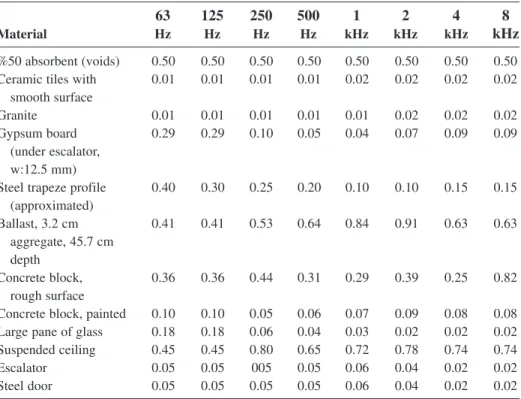
The suspended ceiling system was tested according to DIN EN 20 354. The sound absorption coefficient is 0.65 at 500 Hz. This value conforms with the lower limit of 0.60 specified in the Turkish Noise Control Act. The Noise Reduction Coefficient (NRC) rating was 0.74, which also conforms with the lower limit of 0.60 in the Act. In Table 2, in addition to the suspended ceiling system, all other materials used in the interior surfaces of platform and ticket floors are given. The table gives the sound absorption coefficients of materials from 63 Hz to 8000 Hz.
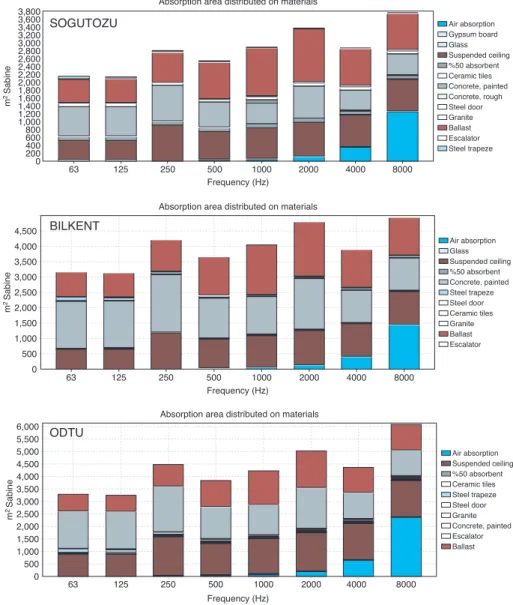
Since the dimensions and plan configurations of the three stations were different, there were differences in the amount of sound absorptive materials used for each station. The material overview results for the three metro stations were obtained from ODEON software that illustrates the sound absorption capacity of the materials over frequency for each metro station (Figure 2).
2.3. Acoustical input data
The sound power levels of the sources used in the simulations were given as input data. For the train passages from the platform levels, the sound power levels of the trains defined as line sources were calculated by the method described in VDI-Richtlinie 2716 and data presented by Harris [1979]. Alternatively, the software developed by Gungor [2003] was used in specifying the sound power levels of air terminal outlets of tunnel ventilation fans.
SOGUTOZU METRO STATION PLAN AND SECTION
BILKENT METRO STATION PLAN AND SECTION
ODTU METRO STATION PLAN AND SECTION
Figure 1. Plan and section views of Sogutozu, Bilkent and ODTU metro stations.
Table 1: Room information for Sogutozu, Bilkent and ODTU metro stations
Sogutozu Bilkent ODTU
Quantities
Number of corners in room 558 394 456
Number of surfaces in room 213 179 254
Number of vertices in room 944 770 1088
Estimated room volume (m3) 12954.40 17146.34 29002.72
Dimensions
Max. X – Min. X (m) 138.68 190.00 191.55
Max. Y – Min. Y (m) 22.75 20.40 20.40
2.4. Simulation results
Simulation results are obtained for both platform and ticket office floors in each metro station. The calculated parameters are reverberation time, speech transmission index and A-weighted sound level distribution.
2.4.1. Platform floor reverberation time (RT)
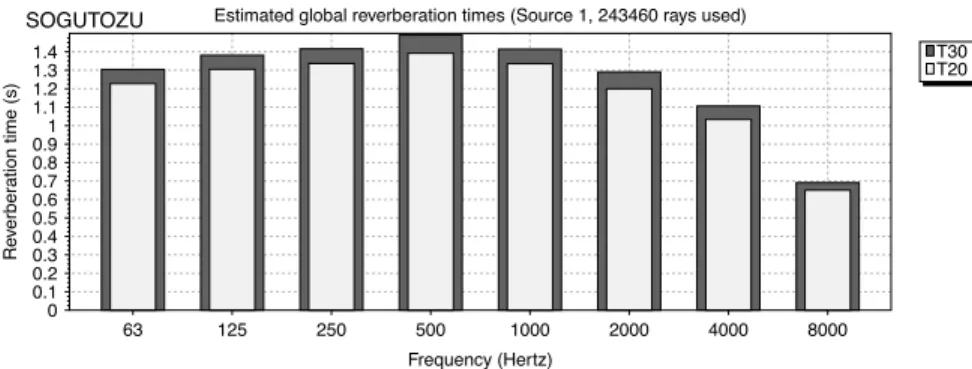
RT is the basic parameter that should be calculated in the assessment of room acoustics. It indicates the efficiency of a room in fulfilling the acoustical requirements, depending upon the activity or function that takes place. For the platform level, the RT characteristics as a function of frequency are presented for each metro station in Figure 3. T20 is the RT over the first 20 dB decay; T30 is the RT over the first 30 dB decay.
The Turkish Noise Control Act requires the optimum values of unoccupied metro stations for RT at 500 Hz as between 1.2 s to 1.4 s although there is no reference to T20 or T30 in the regulations. However, as the materials chosen for the metro stations are of hard, smooth and reflective surfaces, normally the lower limit of 1.2 s is difficult to achieve. Simulation results for Sogutozu metro station (unoccupied) show that RT500
(T20) satisfies the optimum conditions with a value of 1.37 s. RT500(T30), on the other
hand, is on the limit with a value of 1.46 s. Lower values are obtained in Bilkent metro Table 2: Material list and sound absorption coefficients (Christensen, 2002)
63 125 250 500 1 2 4 8
Material Hz Hz Hz Hz kHz kHz kHz kHz
%50 absorbent (voids) 0.50 0.50 0.50 0.50 0.50 0.50 0.50 0.50 Ceramic tiles with 0.01 0.01 0.01 0.01 0.02 0.02 0.02 0.02
smooth surface
Granite 0.01 0.01 0.01 0.01 0.01 0.02 0.02 0.02
Gypsum board 0.29 0.29 0.10 0.05 0.04 0.07 0.09 0.09 (under escalator,
w:12.5 mm)
Steel trapeze profile 0.40 0.30 0.25 0.20 0.10 0.10 0.15 0.15 (approximated) Ballast, 3.2 cm 0.41 0.41 0.53 0.64 0.84 0.91 0.63 0.63 aggregate, 45.7 cm depth Concrete block, 0.36 0.36 0.44 0.31 0.29 0.39 0.25 0.82 rough surface
Concrete block, painted 0.10 0.10 0.05 0.06 0.07 0.09 0.08 0.08 Large pane of glass 0.18 0.18 0.06 0.04 0.03 0.02 0.02 0.02 Suspended ceiling 0.45 0.45 0.80 0.65 0.72 0.78 0.74 0.74
Escalator 0.05 0.05 005 0.05 0.06 0.04 0.02 0.02
station. In that case, RT500(T20) is 1.06 s and RT500(T30) is 1.16 s. The values are
closer to the lower limit of optimum value range. RT values increase in ODTU metro station with an RT500(T20) of 1.29 s and RT500(T30) of 1.42 s due to its larger volume.
It was proposed that these marginally higher values could be reduced by the use of plate absorbers such as advertisement boards. On the other hand, there is evidence that the
ODTU
Frequency (Hz) Absorption area distributed on materials
63 0 500 1,000 1,500 2,000 2,500 m 2 Sabine 3,000 3,500 4,000 4,500 5,000 5,500 6,000 125 250 500 1000 2000 4000 8000 Air absorption Ceramic tiles Steel trapeze Steel door Granite Concrete, painted Escalator Ballast Suspended ceiling %50 absorbent SOGUTOZU Frequency (Hz) Absorption area distributed on materials
63 125 250 500 1000 2000 4000 8000 Air absorption Gypsum board Glass Suspended ceiling %50 absorbent Ceramic tiles Concrete, painted Concrete, rough Steel door Granite Ballast Escalator Steel trapeze 0 200 400 600 800 1,000 1,200 1,400 1,600 1,800 2,000 2,200 2,400 2,600 2,800 3,000 3,200 3,400 3,600 3,800 BILKENT Frequency (Hz) Absorption area distributed on materials
63 125 250 500 1000 2000 4000 8000 Air absorption Glass Suspended ceiling %50 absorbent Concrete, painted Steel trapeze Steel door Ceramic tiles Granite Ballast Escalator 0 500 1,000 1,500 2,000 2,500 3,000 3,500 4,000 4,500 m 2 Sabine m 2 Sabine
Figure 2. Distribution of sound absorption capacities of materials for Sogutozu, Bilkent and ODTU metro stations as a function of frequency.
assessment of predicted reverberation times should rely on T20 rather than T30 values since subjective assessment of reverberation is mainly due to early decaying sound. Early decay time characteristics are not used in the evaluations due to ambiguity of reference parameters specified in the regulatory documents.
1 No decsription – Point source at: (x,y,z) = (–27390.00, – 10575.97, 1.00) Source
1 No decsription – Point source at: (x,y,z) = (–6830.00, – 3844.00, 2.75) Source 0 63 63 125 250 500 1000 2000 4000 8000 125 250 500 1000 2000 4000 8000 0.1 0.2 0.3 0.4 0.5 Re v erber ation time (s) 0 0.1 0.2 0.3 0.4 0.5 0.6 0.7 0.8 0.9 1 1.1 1.2 Re v erber ation time (s)
Estimated global reverberation times (Source 1, 243460 rays used)
Estimated global reverberation times (Source 1, 188445 rays used)
Estimated global reverberation times (Source 1, 164565 rays used) Frequency (Hertz) 63 125 250 500 1000 2000 4000 8000 Frequency (Hertz) Frequency (Hertz) SOGUTOZU BILKENT ODTU 0.6 0.7 0.8 0.9 1 1.1 1.2 1.3 1.4 0 0.1 0.2 0.3 0.4 0.5 0.6 0.7 0.8 0.9 1 1.1 1.2 1.3 1.4 1.5 Re v erber ation time (s) T30 T20 T30 T20 T30 T20
Figure 3. The RT distribution on frequency for Sogutozu, Bilkent and ODTU metro stations.
2.4.2. Platform floor speech transmission index
The STI results for the unoccupied conditions of the three metro stations on platform levels are shown in Figure 4. The background noise was specified as 50 dB for each frequency band. This corresponds to a total of 57-dBA background noise level, to account for the noise produced by ventilation systems, escalators and other equipment. This value is higher than the limiting noise level of 55 dBA specified for such spaces in the Turkish Noise Control Act.
Figure 4. The STI distributions at platform levels of Sogutozu, Bilkent and ODTU metro stations.
When the Figure 4 is inspected, all the three metro stations are found to correspond to a good labelling class with values around 0.60 for a signal-to-noise ratio of 30 dB. There are few receiver points for Sogutozu metro station with STI of 0.43 that corresponds to the fair class. There are also numerous receiver points with an STI around 0.75 that carries the label of excellent class. In Bilkent metro station, none of the receiver surfaces has an STI below the good class. Moreover, there are some receiver points with STI values of excellent class. A similar observation is made for ODTU. The worst receiver point has an STI of 0.5 that corresponds to fair class. There are more receiver locations within the range of excellent class for STI (Beranek, 1988). Considering all the three metro stations it could be stated that, in platform levels the speech intelligibility is satisfactory. This also confirms the lone dependence of speech intelligibility on the reverberation times when a signal-to-noise ratio of 30 dB or more is used in such analyses.
2.4.3. Platform floor train pass-by noise simulations
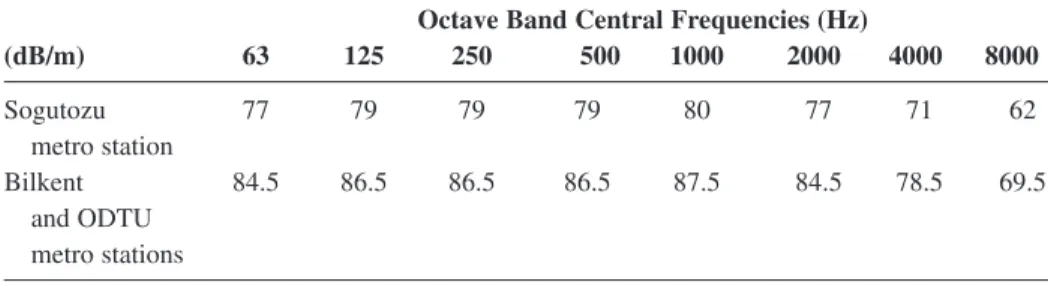
The noise levels within the platform floors, which are caused by single and double train pass-by, were calculated. The background noise was ignored in the simulations, as it is 20 dBA lower than the expected train pass-by noise levels. The total sound power level was predicted in accordance with DIN EN 20 354 [VDI-Richtlinie 2716]. The spectral composition was calculated by reference to a train speed of 40 km/h. [Harris, 1979]. The train length of 90 m in Sogutozu light metro station, and 140 m in Bilkent and ODTU metro stations resulted in predictions of two sound power levels in octave bands as given in Table 3.
For Sogutozu metro station, serving the light metro system as well at the junction of the metro line, the A-weighted total sound power level of the line source i.e., the train was found as 83 dBA per meter and 103 dBA for the total length of the source. For Bilkent and ODTU metro stations, the values are 90.5 dBA per meter and 112.7 dBA for the total length of the source. The effects of train type, speed, brake configuration as well as rail fixation system (direct or ballast) were considered within the calculations.
2.4.3.1. Single train pass-by noise
The simulation results of a single line source (train) along the length of the platform for the three metro stations are given in Figure 5. In the figure, the red lines signify the train as a line source. The receiver surfaces on the platform edge have a sound level around
Table 3: Line source sound power levels for train pass-by
Octave Band Central Frequencies (Hz)
(dB/m) 63 125 250 500 1000 2000 4000 8000 Sogutozu 77 79 79 79 80 77 71 62 metro station Bilkent 84.5 86.5 86.5 86.5 87.5 84.5 78.5 69.5 and ODTU metro stations
80-82 dBA for all of the three cases. The predicted noise levels comply with the upper limit of 85 dBA as specified in the regulations.
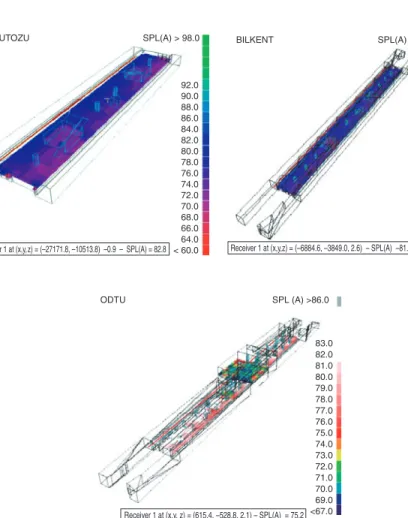
2.4.3.2. Double train pass-by noise
Simulation results of double line sources (trains) along the two sides of the platform for the three metro stations are given in Figure 6. For all three metro stations, there are receiver surfaces with sound level just below 85 dBA on the edge of the platform next to train tracks. The values decrease at the central parts of the platform. As required in the regulations, the noise level at a receiver point 1.8 m away from the side of the platform was checked. The calculation was made for ODTU metro station, as it was more critical. A noise level of 84.6 dBA was obtained in the simulation studies. This figure is below the upper limit of 85 dBA for metro stations in the case of double train pass-by.
Figure 5. Noise level distributions of platform floor single train pass-by for Sogutozu, Bilkent and ODTU metro stations.
2.4.4. Ticket office floor
STI results for unoccupied conditions of the three metro stations in office ticket floors are shown in Figure 7. The background noise was specified as 50 dB for each frequency band as in the platform level. This corresponds to a total of 57-dBA background noise level and a signal-to-noise ratio of 30 dB is also employed as before. STI results were obtained at 1.5 m above the floor level, equivalent to the human ear height.
The STI values are between 0.5 to 0.85 for the stations and correspond to fair to excellent. There are few receiver points with an STI value of 0.40 that falls into the fair class for intelligibility [Beranek, 1988]. Such lower values are not uncommon for a closed volume of highly reflective surfaces. In application, these values will be tolerated in consequence of the increase in sound absorption and correspondingly the level of intelligibility by people and interior decoration elements such as advertisement
SOGUTOZU BILKENT ODTU SPL(A) >85.0 SPL(A) >118.5 SPL(A) >87.0 82.0 113.5 110.5 107.5 104.5 101.5 113.5 95.5 92.5 113.5 86.5 83.5 80.5 77.5 74.5 71.5 84.0 83.0 82.0 81.0 80.0 79.0 78.0 77.0 76.0 75.0 74.0 73.0 72.0 71.0 70.0 <68.0 <69.0 81.0 80.0 79.0 78.0 77.0 76.0 75.0 74.0 73.0 72.0 71.0 70.0 69.0 68.0 66.0
Receiver 1 at (x,y,z) = (–27171.8, – 10513.8, –0.9) – SPL(A) = 81.4 Receiver 1 at (x,y,z) = (–6884.6, – 3849.0, 2.6) – SPL(A) = 83.5
Receiver 1 at (x,y,z) = (–615.4, 528.8, 2.1) – SPL(A) = 80.8
Figure 6. Noise level distributions of platform floor double train pass-by for Sogutozu, Bilkent and ODTU metro stations.
boards. Considering all the three metro stations it could be stated that, in ticket office floors the intelligibility of speech is fair to good due to limited amount of sound absorptive surfaces as compared to platform levels. Moreover, the presence of passengers in the station, lower background noise and even distribution of overhead loudspeakers on the ceiling will improve the STI results and correspond to better intelligibility classes for most of the receiver surfaces.
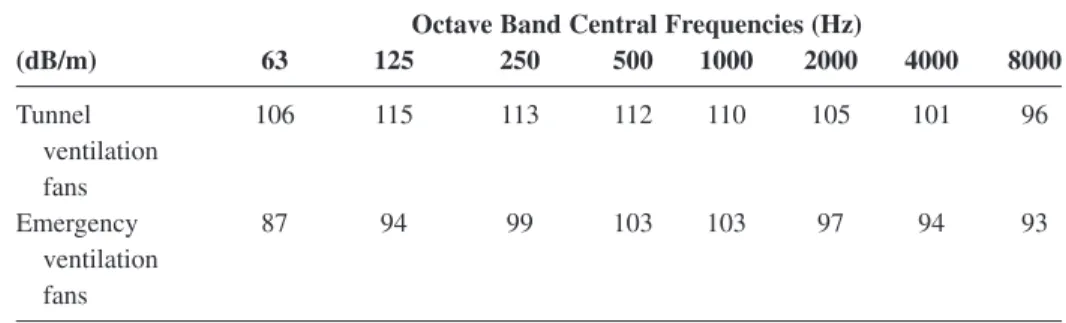
2.4.5. Fan noise simulations
The same types of fans are used for the three metro stations. Typical sound power levels of tunnel ventilation and emergency ventilation fans for each frequency band are given in Table 4.
2.4.5.1. Noise level at 22.5 m from an emergency fan
An axial fan with a flow rate of 288,000 m3/h was located at the ceiling level as a point
source. At the platform surface, the receiver point at 22.5 m from the fan was checked
BILKENT
ODTU
Receiver 1 at (x,y,z) = 187.6, 109.7, 1.5) – STI = 0.62
Receiver 1 at (x,y,z) = (40.7, 13.3, 1.5) – STI = 0.64
<0.45 0.47 0.49 0.52 0.54 0.57 <0.50 0.55 0.58 0.60 0.63 0.65 0.68 0.70 0.73 0.75 0.78 0.80 0.83 0.85 0.88 0.90 0.59 0.62 0.64 0.67 0.69 0.72 0.74 0.77 0.79 0.82 0.84 0.87 0.89 STI > 0.94 STI > 0.98 SOGUTOZU
Receiver 1 at (xy,z) = (–27500.6, –10616.6, 5.2) – STI = 0.50 STI > 1.00 0.85 0.80 0.75 0.70 0.65 0.60 0.55 0.50 0.45 0.40 0.35 0.30 0.25 0.20 0.15 <0.05
Figure 7. The STI distributions at ticket office floors of Sogutozu, Bilkent and ODTU metro stations.
for its noise level as required in regulations. The noise levels are in sequence 77.5, 79 and 78.9 dBA for Sogutozu, Bilkent and ODTU metro stations, respectively. All of these values are in accordance with the 80 dBA upper limit specified in regulations.
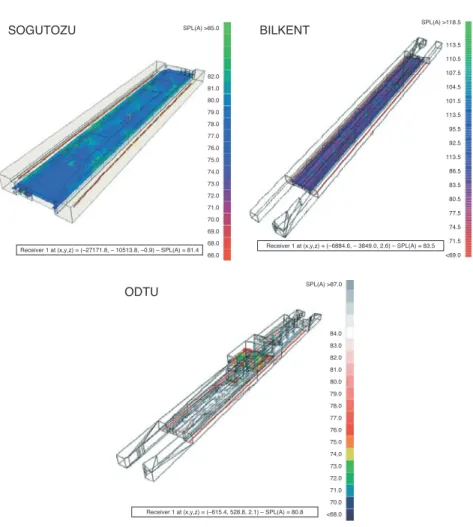
2.4.5.2. Noise distribution of tunnel ventilation fans
In the case of an emergency, tunnel ventilation fans are operated altogether. For such a case, sound levels at 1.5 m above the floor surface were simulated for empty stations. The sound distribution maps for three metro stations are presented in Figure 8.
At Sogutozu and Bilkent metro stations, most of the receiver surfaces have a SPL of 85 dBA. There are a few receiver points with an SPL of 75 dBA. There are also some noise levels as high as 88 dBA at locations near to the reflective surfaces. ODTU metro station displays SPL lower than 82 dBA at most of the receiver locations. There are even a few receiver points where noise levels drop to 71 dBA. For all the three metro stations it could be concluded that noise levels of tunnel ventilation fans satisfy the requirements in the regulations.
2.4.5.3. Noise distribution of tunnel emergency ventilation fans
Noise levels generated by tunnel emergency ventilation fans were simulated for 1.5 m above the floor surface for the Sogutozu metro station with no passengers present. The distribution map is given in Figure 9. The sound power levels of emergency ventilation fans as a function of frequency are given in Table 4. For Sogutozu metro station there are higher values exceeding 72 dBA at locations around the staircases, where air intakes are situated. From the staircase to the central parts of the platform, sound levels decrease sharply due to attenuation provided by the ductwork. At most of the receiver locations, the SPL is 60-64 dBA. There are a few receiver points with an SPL of 52 dBA. Based on the scenario that tunnel air-condition system operate simultaneously with emergency ventilation fans, SPL values are still lower than 85 dBA, complying with the requirements.
The same maximum value of 72 dBA was obtained for Bilkent and ODTU metro stations. This value is 10 dBA lower than that generated by tunnel ventilation fans. Therefore, another simulation for noise level distribution was found unnecessary for the two other metro stations.
Table 4: Sound power levels of emergency and tunnel ventilation fans
Octave Band Central Frequencies (Hz)
(dB/m) 63 125 250 500 1000 2000 4000 8000 Tunnel 106 115 113 112 110 105 101 96 ventilation fans Emergency 87 94 99 103 103 97 94 93 ventilation fans
2.4.5.4. Outside noise generated by the emergency fans
In an emergency, noise is generated by simultaneous operation of tunnel ventilation and emergency ventilation fans. For such cases, noise levels at 9 m away from the shafts on the street level needs to be checked as required in regulations. The software developed by Gungor [2003] was used in specifying the sound power levels of both types of fans at the shaft outlets considering the canal/shaft configurations (Table 5). Moreover, it was assumed that there are no silencers along the ventilation shafts.
Outlets of both two ventilation shafts were assumed as point sources located on a reflective surface. The band pressure levels (Lpi) for each frequency band were
calculated in free field. The results are illustrated in Table 6.
SPL(A) > 920 SPL(A) > 118 SPL(A) > 86 89.0 89.0 <73.0 75.0 76.0 77.0 78.0 79.0 80.0 81.0 82.0 83.0 84.0 85.0 86.0 87.0 88.0 82.0 <67.0 83.0 69.0 71.0 72.0 73.0 74.0 75.0 76.0 77.0 77.0 78.0 79.0 80.0 81.0 110.5 73.0 113.0 70.5. <68.0 75.5 78.0 80.5 83.0 85.5 88.0 90.5 95.5 98.0 100.5 103.0 105.5 108.0 BILKENT SOGUTOZU
Reciever 1 at (xyz) = –27420, –105B2.5 0.6, –SPL (A) = 80.3 Reciever 1 at (xyz) = –6884.6, –3849.0 2.6, –SPL (A) = 75.3
Reciever 1 at (xyz) = (615.4, –528.8, 2.1 –SPL (A) = 75.2
ODTU
Figure 8. The noise distributions when all the four tunnel ventilation fans are activated at platform floors of Sogutozu, Bilkent and ODTU metro stations.
A-weightings were applied to the band pressure levels given in Table 6. An overall level of 78 dBA was obtained for tunnel ventilation fans and of 76 dBA for emergency ventilation fans. The outside noise levels are found to be acceptable considering the emergency conditions with the fans operating.
SPL(A) > 78.0 72.0 <40.0 44.0 46.0 48.0 50.0 52.0 54.0 56.0 58.0 60.0 62.0 64.0 66.0 70.0
Reciever 1 at (xyz) = –27420.7, –10582.5, 0.6 –SPL (A) = 50.6
Figure 9. The noise level distributions when all the four tunnel ventilation fans are operated at platform floors of Sogutozu light metro station.
Table 5: Sound power levels of outside noise generated by emergency fans
Octave Band Central Frequencies (Hz)
(dB) 63 125 250 500 1000 2000 4000 8000 Tunnel 99 106 104 103 101 96 92 87 ventilation fans Emergency 80 90 96 100 100 94 91 90 ventilation fans
Table 6: Band pressure levels at 9 m away from emergency fan shafts
Octave Band Central Frequencies (Hz)
(dB) 63 125 250 500 1000 2000 4000 8000 Tunnel 72 79 77 76 74 69 65 60 ventilation fans Emergency 53 63 69 73 73 67 64 63 ventilation fans
3. CONCLUSION AND DISCUSSION
Acoustical simulations for empty metro stations illustrate that the reverberation requirements and noise limits specified in the Turkish Noise Control Act are satisfied in the three metro stations considered although some values are on the limits. There is no specification related to intelligibility in the regulations. STI, as one of the most popular tools to evaluate intelligibility, was used, although its applicability for the Turkish language is still contested. It is found that STI is within acceptable limits for all the three metro stations. STI is known to be well correlated with reverberation times for signal-to-noise ratios in the excess of 30 dB. EDT values have even better correlation with STI figures in case of such high signal-to-noise ratios.
In this study, different materials were tried on the tunnel walls until optimum acoustical conditions were obtained. The importance of using sound absorbing materials on the ceiling and sidewalls, instead of the ceiling only is confirmed as Crockett and Pyke [2000] claimed. Moreover, the rough concrete and ballast are found to be economical and effective acoustical materials [Carman, 2004]. The nonwoven material that was used at the ceiling system, as a lay-in material, has proved to be effective in sound attenuation. The nonwovens complying with proper fire rating, which are the products of recent technological developments in the material industry, should be regarded an integral part of the metro station applications as demonstrated in this study.
Overall, the computer simulation technique proved to be a powerful tool for the acoustical assessments of long spaces or enclosures where sound decay curves are not linear. However, different design solutions could still be tested through computer simulations at the design phase on relative scale for material combinations and given geometry. Maps that illustrate spatial distribution of acoustical parameters are invaluable for evaluation of the overall condition. Capability of producing such tools of comparison is definitely an asset in acoustical design process. Finally, results of different parameters obtained from the simulations can be compared with the limiting values specified in the regulations and technical specifications.
ACKNOWLEDGEMENTS
Authors gratefully acknowledge the financial support given by Yüksel Project International Inc. of Ankara, Turkey.
REFERENCES
[1] Altay, Y. (January 1997). Planning considerations for underground train stations. M.F.A Thesis, Bilkent University, Ankara.
[2] Alves-Pereira, M., Melo, J. J. and Branco, C. (2004). Low frequency noise in subways. The 33rd international congress and exposition on noise control
engineering, proceedings of inter-noise August 2004, Prague.
[3] Beranek, L. L. (1988). Acoustical measurements. 3rd ed. New York: ASA. [4] Carman, R. (2004). Prediction of train noise in tunnels and stations. The 33rd
international congress and exposition on noise control engineering, proceedings of inter-noise August 2004, Prague.
[5] Christensen, C. L. (2002). ODEON room acoustics program version 6.0 user manual, industrial, auditorium and combined editions. Lyngby: Oersted Plads. [6] Crockett, A. R. and Pyke, J. R. (2000). Viaduct design for minimization of direct and
structure-radiated train noise. Journal of Sound and Vibration, 231(3), 883–897. [7] Durmisevic, S. (1999). The future of the underground space. Cities, 16(4), 233–245. [8] Durmisevic, D. and Sariyildiz, S. (2001). A systematic quality assessment of
underground spaces – public transport stations. Cities, 18(1), 13–23.
[9] Gungor, F. E. (January 2003). Computer Aided Noise Prediction in Heating, Ventilating and Air Conditioning Systems. M. Sc. Thesis, Middle East Technical University, Ankara.
[10] Harris, C. M. (1979). Handbook of Noise Control. Second Ed. New York: McGraw-Hill.
[11] Harrison, M. F. (2001). Calculating speech intelligibility for the design of public address system at railway stations. Mechanical Engineers, 215, 319–329. [12] Irvine, L. K. and Richards, R. L. (1998). Acoustics and noise control handbook
for architects and builders. Florida: Krieger.
[13] Kang, J. (1997a). Acoustics of long underground spaces. Tunneling and underground space technology, 12(1), 15–21.
[14] Kang, J. (1997b). A method for predicting acoustic indices in long enclosures. Applied Acoustics, 51(2), 169–180.
[15] Kang, J. (1997c). Scale modeling of train noise propagation in an underground station. Journal of Sound and Vibration, 202(2), 298–302.
[16] Lam, P. M. and Li, K. M. (2004). The predicted reverberation time in a rectangular long enclosure. The 33rdinternational congress and exposition on noise control
engineering, proceedings of inter-noise August 2004, Prague.
[17] Lawrence, D. (1994). Underground architecture. Wiltshire: Capital transport publishing.
[18] Naylor, G. M. (1993). ODEON – Another hybrid room acoustical model. Applied Acoustic, 38, 131–143.
[19] Turkish Noise Control Act. Article 12, Passage 3, Table 5.
[20] Rindel, J. H. Rindel. (2000). The Use of Computer Modeling in Room Acoustics. Journal of Vibroengineering, 3, 219–224.
[21] Schmidt, A. M. D. and Kirkegaard, P. L. (2004). On architectural acoustics design using computer simulation. Eleventh international congress on sound and vibration July 2004, Petersburg.
[22] Shuo-xian, W. and Yue-zhe, Z. (2004). Predicting STI in a tunnel in case of emergency with the image wall method. The 33rd international congress and
exposition on noise control engineering, proceedings of inter-noise August 2004, Prague.
[23] Wijngaarden, W. S. J. and Verhava, J. A. (2001). The influence of fan and traffic noise on speech intelligibility in Dutch traffic tunnels. The 2001 international congress and exhibition on noise control engineering, proceedings of inter-noise August 2001, The Hague, Netherlands.
[24] VDI-Richtlinie 2716. Luft-und Körperschall bei Schienenbahnen des stadtischen Nahverkehrs.
[25] Yang, L. and Shield, B. M. (2001). The prediction of speech intelligibility in underground stations of rectangular cross section. JASA, 109.1, 266–273.