Selective Catalytic Ammonia Oxidation to Nitrogen by Atomic
Oxygen Species on Ag(111)
Mustafa Karatok,
†Evgeny I. Vovk,
†,§,∥Ali Vala Koc,
†and Emrah Ozensoy
*
,†,‡†Chemistry Department and‡UNAMNational Nanotechnology Center, Bilkent University, 06800 Bilkent, Ankara, Turkey §Boreskov Institute of Catalysis, 630090 Novosibirsk, Russian Federation
*
S Supporting InformationABSTRACT: Ammonia-selective catalytic oxidation was studied on the planar Ag(111) single-crystal model catalyst surface under ultra-high-vacuum (UHV) conditions. A variety of oxygen species were prepared via ozone decomposition on pristine Ag(111). Surface coverages of oxygen species were quantified by temperature-programmed desorption (TPD) and X-ray photoemission spectroscopy techniques. Exposure of ozone on Ag(111) at 140 K led to a surface atomic oxygen (Oa) overlayer. Low-energy electron diffraction experiments revealed that annealing of this atomic oxygen-covered Ag(111) surface at 473 K in UHV resulted in the formation of ordered oxide surfaces (Oox) with p(5×1) or c(4×8) surface
structures. Ammonia interactions with O/Ag(111) surfaces monitored by
temperature-programmed reaction spectroscopy indicated that disordered surface atomic oxygen selectively catalyzed N−H bond cleavage, yielding mostly N2along with minor amounts of NO and N2O. Higher coverage O/Ag(111) surfaces, whose structure was tentatively assigned to a bulklike amorphous silver oxide (Obulk), showed high selectivity toward N2O formation (rather than
N2) due to its augmented oxygen density. In contrast, ordered surface oxide overlayers on Ag(111) (where the order was achieved by annealing the oxygen adlayer to 473 K) showed only very limited reactivity toward ammonia. The nature of the adsorbed NH3species on a clean Ag(111) surface and its desorption characteristics were also investigated via infrared reflection absorption spectroscopy and TPD techniques. Currentfindings demonstrate that the Ag(111) surface can selectively oxidize NH3to N2under well-defined experimental conditions without generating significant quantities of environmentally toxic species such as NO2, NO, or N2O.
■
INTRODUCTIONAmmonia is an environmental pollutant whose exposure above 300 ppm is known to cause significant health risks such as lung diseases.1,2 European Environment Agency (EEA) reports indicate that the biggest contribution to ammonia emissions originates from agricultural activities3 while power plants and transportation are among other major sources of environ-mentally toxic ammonia in the atmosphere.4 The effects of ammonia on the ecosystem as an environmental pollutant were also reviewed comprehensively by Fangmeier et al.4 Various technologies have been developed for gas-phase ammonia abatement.5Selective catalytic oxidation (SCO) of ammonia is a technology which can be used as an environmentally friendly method of ammonia abatement where N2 and H2O are
produced as the major products. Both transition metals6−10and noble metals11−16 were utilized as catalysts in the SCO of ammonia. Various catalytic systems in SCO of ammonia, including noble metals, transition metal oxides, and modified zeolites, were reviewed by Chmielarz et al.17 Among these metals, silver is considered as a promising low-temperature catalyst due to its high activity and high N2selectivity.14,18The
catalytic effect of silver nanoparticles on SCO reactions as well as their interactions with other metal systems were also investigated in the literature.6,12,19,20 However, a detailed
fundamental understanding of the ammonia SCO reaction mechanism on silver single crystals at the atomic/molecular level is still missing. As can be seen in the principal ammonia oxidation reactions given ineqs 1−3, the product distribution in ammonia SCO reaction depends on the active oxygen quantity, and thus, understanding the nature of oxygen is critical in terms of the selectivity of the catalyst. Some of the proposed mechanisms of the ammonia SCO process can be found in the literature.17 Technical ammonia SCO catalysts including silver nanoparticles as active sites reveal silver facets dominated by the (111) orientation.21Thus, it is essential to elucidate the reactivity of the Ag(111) single crystal model catalyst surfaces in the ammonia SCO reaction.
+ → + 4NH3 3O2 2N2 6H O2 (1) + → + 2NH3 2O2 N O2 3H O2 (2) + → + 4NH3 5O2 4NO 6H O2 (3) Received: August 19, 2017 Revised: September 18, 2017 Published: September 20, 2017 pubs.acs.org/JPCC Cite This: J. Phys. Chem. C 2017, 121, 22985-22994
The O/Ag(111) system is an important catalytic system which has been thoroughly investigated within the context of different catalytic reactions in the past few decades both experimentally22−32 and theoretically.33−38 However, recent studies indicate that the O/Ag(111) structure proves to be an elusive system to understand in a comprehensive manner at the atomic scale.39−46 Oxygen-containing Ag(111) surfaces are known to undergo surface reconstruction readily. The most commonly observed reconstruction of this system is the p(4×4) structure, which was first observed by Rovida et al.22
The atomic structure of the p(4×4) reconstruction was revised in 2000,47and an even more recent model was proposed by Schnadt et al. in 2006.37In addition, other reconstructions of the O/Ag(111) system were also observed, such as (√3×√3) R30°,4 8 c(3×5√3)rect,3 7 (7×7),3 2 c(4×8),3 8 and p(4×5√3)rect structures.38 The reconstruction process of the Ag(111) surface was reviewed by Michaelides et al.49As will be described below, none of these reconstructions besides c(4×8) were observed in the current study, presumably due to the use of a particularly different atomic oxygen dosing method comprised of ozone as the active atomic oxygen delivery agent. To the best of our knowledge, the ozone decomposition method was not used on Ag(111) single-crystal surfaces under UHV conditions in any of the former studies in the literature. O2dissociation is not observed on the Ag(111) surface under
UHV conditions due to the extremely low sticking coefficient of the oxygen molecule (ca.∼10−6) on the Ag(111) surface at low pressures.26 The minimum pressure for the observation of molecular oxygen dissociation on Ag(111) was reported to be 10−3 Torr in the literature.24,44Thus, in most of the former studies, high-pressure O2exposures were used to investigate the nature of oxygen on a Ag(111) model catalyst surface.25−29,32 Other methods were also utilized for atomic oxygen delivery onto the Ag(111) surface under UHV conditions, such as NO2 decomposition31,36,38,40,47,50 and thermal gas cracking.41,42,45 Ozone decomposition is an extremely efficient method for dosing high concentrations of oxygen atoms on metal surfaces under UHV conditions (i.e., in the absence of elevated-pressure exposures). Efficient atomic oxygen delivery onto single-crystal model catalyst surfaces with ozone was successfully carried out for Al(111),51Pd(111),52Pt(111),52,53and Au(111).52,54With this method, atomic oxygen can be accumulated on single-crystal surfaces even at pressures on the order of 10−10 Torr, while significantly minimizing the introduction of unwanted contaminations onto the catalyst surface. High-pressure oxygen accumulation leads to surface reconstruction and oxide formation rather than the generation of a mobile surface atomic oxygen overlayer on Ag(111). Heine et al. reported that oxide formation was observed to be more facile on the surface regions with high step density44 whose generation can be triggered by high-pressure O2(g). Thus, atomic oxygen
accumulation under UHV conditions may limit oxide formation and allow exclusive investigation of high-coverage surface oxygen overlayers on Ag(111). Along these lines, an important advantage of ozone utilization over other atomic oxygen delivery vectors such as NO2decomposition is the fact that the
ozone decomposition method enables the use of a greater variety of surface coverages of atomic oxygen species.
In the current work, we focus on the reactivity of oxygen atoms and oxide overlayers in ammonia SCO reactions on Ag(111) and report new catalytic structure−functionality relationships at the molecular level. We believe that the current findings may also provide valuable insights regarding the nature
of oxygen on Ag(111) which can also possibly be extrapolated to other crucial heterogeneous catalytic processes such as partial oxidation reactions of ethylene and methanol.27,57,71
■
EXPERIMENTAL SECTIONExperiments were performed in a custom-made UHV chamber with a base pressure of 2× 10⁻¹⁰Torr which is equipped with X-ray photoemission spectroscopy (XPS; Riber Mg/Al dual anode with a Riber EA150 electron energy analyzer), low-energy electron diffraction (LEED; custom-made), infrared reflection absorption spectroscopy (IRAS; Bruker Tensor 37 with custom-design external IR optics and a tailor-made N2 purge box, 4 cm−1 resolution, 100 scans, 10 kHz scanner velocity, mercury cadmium telluride (MCT) detector), temper-ature-programmed desorption (TPD), and temperature-pro-grammed reaction spectroscopy (TPRS) capabilities. A quadru-pole mass spectrometer (QMS; Ametek Dycor Dymaxion DM200) and a proportional−integral−derivative (PID)-con-trolled linear sample heater (Heatwave, model 101303) were used for the TPD/TPRS experiments. All of the TPD/TPRS experiments were performed with a heating rate of 1 K/s, a 70 eV QMS beam energy, and a 30 ms dwell time for each desorption channel. The Ag(111) single-crystal sample (10 mm diameter × 1 mm thick disk, both sides polished, purity >99.999%, MaTeck GmbH) was affixed on Ta wires, through which the sample could be resistively heated to 1073 K. The cooling of the sample was achieved via a liquid nitrogen reservoir located inside the sample manipulator probe holding the Ag(111) single crystal. The temperature of the sample was measured using a K-type thermocouple spot-welded on the lateral facet of the Ag(111) disk. The Ag(111) sample surface was cleaned by cycles of Ar+ sputtering (Ar(g), Linde AG,
purity ≥99.999%) with a sputtering gun (LK Technologies, NGI3000, 1.5 kV× 15 mA) at room temperature followed by annealing at 773 K in UHV for 20 min. After Ar+sputtering, the Ag(111) sample was exposed to ozone (2.0× 10⁻⁹Torr× 5 min) at room temperature for further cleaning followed by annealing to 773 K for adsorbed oxygen removal. The cleanness of the surface prior to experiments was confirmed by XPS and LEED. An Al Kα X-ray source (1486.6 eV, 10 kV × 20 mA) was used in the XPS measurements. O 1s and Ag 3d regions were analyzed with an energy resolution of 0.1 eV for 10 scans and 5 scans, respectively. All of the XPS O 1s signals were positioned and normalized using the Ag 3d signals that were measured along with the O 1s signal.
Atomic oxygen was accumulated on the Ag(111) model catalyst surface by ozone exposure using a methodology whose details can be found in one of our former papers.55Ozone was dosed to the UHV system via Teflon tubings and a high-precision leak valve. NH3 gas (Linde AG, purity ≥99.995%) was used without further purification and introduced onto the Ag(111) surface via a separate leak valve. In the rest of the text, exposures of adsorbate species (ε) are given in langmuirs (1 langmuir = 1 × 10⁻⁶ Torr·s) and the estimated surface coverages (θ) of the corresponding adsorbates are reported in monolayer equivalents (MLE).
■
RESULTS AND DISCUSSIONOxygen on Ag(111). Before the investigation of SCO of NH3 with oxygen, the behavior of oxygen species generated
upon ozone decomposition on a clean Ag(111) single-crystal model catalyst surface was studied via TPD. For this purpose, The Journal of Physical Chemistry C
increasing exposures of ozone were introduced on Ag(111) at 140 K, and the TPD spectra of molecular oxygen (m/z = 32) desorbing from the Ag(111) single-crystal surface as a function of temperature were acquired as shown inFigure 1a. As can be
seen in Figure 1a, oxygen desorption starts at 535 K for an oxygen surface coverage ofθO= 0.13 MLE, and the desorption
temperature slowly increases with increasing oxygen surface coverage. Furthermore, various additional low-temperature (T < 525 K) desorption features (e.g., see the red spectrum in
Figure 1a) start to appear and grow in intensity with increasing θO. These features can be associated with subsurface atomic
oxygen (Osub) as previously reported in the literature.26,42
These low-temperature features do not converge to a saturation, in agreement with a former paper,42 presumably due to the diffusion of atomic oxygen into the subsurface. Campbell et al. argued that oxygen atoms could be more stable on the silver surface rather than in bulk silver oxide on the basis of the heat of adsorption of oxygen atoms on Ag(111) as compared to the heat of formation of bulk silver oxide.26 Therefore, bulk oxide formation due to oxygen diffusion to the silver subsurface seems to be rather unlikely at low oxygen coverages. However, formation of bulk silver oxide at high
oxygen coverages is feasible and will be discussed in more detail below. Along these lines, by exploiting isotopically labeled oxygen molecules, Backx et al. showed that subsurface oxygen in the Ag(110) surface desorbs at lower temperatures than the surface oxygen atoms.56TPD data for O/Ag(111) (Figure 1a) obtained via ozone decomposition are in good agreement with a former study, where NO2 decomposition was utilized for
atomic oxygen delivery on Ag(111).50Integrated TPD signals corresponding to surface (Oa) and subsurface (Osub) oxygen species in Figure 1a were also calculated individually and plotted as a function of the ozone exposure (Figure 1b). In this latter plot, monolayer coverage reaches a plateau around 0.04 langmuir, which may be attributed to the saturation of thefirst overlayer on the surface. The absolute surface saturation coverage of the first oxygen monolayer on Ag(111) was previously calculated by Campbell et al.26 for a (4×4)-O/ Ag(111) surface structure at this coverage. It is worth mentioning that, in the current work, the (4×4)-O/Ag(111) structure was not observed in any of the investigated coverages, because this structure is not stable when oxygen is accumulated under UHV conditions.44,45Nevertheless, in the current work, the saturation exposure of 0.04 langmuir was attributed to 1 MLE and was used to calibrate and quantify other desorption signals. As can be seen inFigure 1b, for the ozone exposures above 0.08 langmuir, surface oxygen coverage starts to exceed the convergence coverage of 1 MLE. This can be explained by the transformation of the surface oxygen overlayer to form a new structure with a higher oxygen density. We tentatively assign this latter structure to a bulklike silver oxide.
Analysis of the Ag(111) single-crystal surface after various ozone exposures at 140 K by LEED revealed no ordered structures, suggesting randomly located oxygen species at 140 K for all oxygen coverages. However, annealing of the O/ Ag(111) surfaces originally prepared at 140 K indicated that thermal activation led to the ordered oxide formation with a p(5×1) structure for θO< 1.10 MLE (Figure 2a,b), as well as an
additional oxide structure which can be tentatively assigned to a
Figure 1.(a) TPD profiles for oxygen desorption (m/z = 32) obtained by increasing ozone exposures on clean Ag(111) at 140 K. (b) Relative oxygen surface coverages (obtained via integrated TPD desorption signals in part a) for surface and subsurface oxygen species on Ag(111) as a function of the ozone exposure.
Figure 2. LEED images of O/Ag(111) overlayers obtained by introducing different ozone exposures at 140 K on a clean Ag(111) surface followed by pumping and annealing to 473 K in UHV. (a) LEED image of the p(5×1)-O/Ag(111) overlayer (θO= 0.83 MLE) and (b) its simulated (theoretical) LEED pattern. (c) LEED image of the c(4×8)-O/Ag(111) overlayer (θO = 1.10 MLE) and (d) its simulated (theoretical) LEED pattern.
c(4×8) structure appearing at 1.10 MLE < θO < 1.93 MLE (Figure 2c,d). Oxide formation due to the annealing of oxygen overlayers on Ag(111) was also previously observed by Bukhtiyarov et al.,29where it was demonstrated via XPS that atomic oxygen adsorbed on Ag(111) at 300 K can form silver oxide when the sample is heated to 420 K. LEED images in
Figure 2were obtained by dosing different exposures of ozone on Ag(111) at 473 K (i.e., a temperature which is slightly below the beginning of the oxygen desorption) followed by pumping and cooling the sample to 140 K for LEED analysis. It is worth mentioning that ozone accumulation using relevant exposures at 140 K and heating to 473 K yielded LEED images identical to that of direct ozone dosing at 473 K. Starting from the lowest oxygen coverage (i.e.,θO= 0.13 MLE) up toθO= 1.10 MLE, sharp spots of the p(5×1) structure were detectable after annealing at 473 K. For θO ≥ 1.10 MLE, another ordered
LEED structure started to appear after annealing at 473 K along with the emergence of the subsurface oxygen signals in TPD (red spectrum in Figure 1a). We tentatively assigned this structure to a c(4×8) overlayer consisting of three separate domains rotated by 120° with respect to each other. These domains are color-coded in the theoretical LEED pattern given in Figure 2d. c(4×8) reconstruction on O/Ag(111) was also observed by Schnadt and co-workers via scanning tunneling microscopy (STM) and was associated with a significantly oxidized silver structure.38 In the current study, the c(4×8) structure was only observed at relatively high oxygen coverages (i.e., 1.10 MLE < θO < 1.93 MLE) where the surface oxygen
species converged to a constant value (black curve inFigure 1b) while subsurface oxygen monotonically increased (red curve inFigure 1b). ForθO> 1.93 MLE, LEED images became extremely fuzzy, suggesting the lack of an ordered structure at high coverages. This fuzzy structure may be associated with an amorphous bulklike oxide structure. Current results are in good agreement with the density functional theory (DFT) calculations of Li et al., who proposed that increasing oxygen coverages on the Ag(111) surface by ozone exposure might lead to ordered atomic oxygen overlayers followed by oxide-like thick films at higher θO.
33
In a related study, Martin et al. deposited atomic oxygen on Ag(111) by thermal cracking of O2(g) at 500 K withPO2= 10
−7mbar.41
They reported bulklike silver oxide formation at high θO and argued that the c(4×8)
overlayer is the precursor state for bulklike silver oxide formation.
Oxygen accumulation on the Ag(111) surface at 140 K was also analyzed by XPS. O 1s spectra of the O/Ag(111) surface as a function of increasing oxygen coverage are given inFigure 3. Due to the detection limit of our photoelectron detector, we were able to observe a reliable O 1s signal atθO≥ 0.53 MLE.
Signals in the region between 530 and 531 eV were assigned to atomic oxygen either on the surface (Oa) or in the subsurface (Osub), whereas surface oxide (Oox) signals were found between 528.1 and 528.5 eV.26−30,38−40,44,50,57 As mentioned above, ordered surface oxide (Oox) species were not detectable at 140
K according to LEED experiments. Schlögl and co-workers previously reported that the O 1s signal of bulk silver oxide appeared at 529.0 eV.58In another study, Heine et al. assigned an O 1s signal at 528.9 eV to silver oxide species at the step edges of the Ag(111) surface44 and suggested that subsurface oxygen increases the step density of the Ag(111) surface. In
Figure 3, a noticeable increase in the O 1s signal at ca. 529 eV is visible at θO ≥ 1.10 MLE (i.e., in correlation with the
appearance of the subsurface oxygen features in TPD data given inFigure 1a). This O 1s feature at ca. 529 eV may be associated with disordered oxide and/or amorphous bulklike oxide (Obulk)
species. Indications of the formation of bulklike silver oxide species were also present in the Ag 3d XPS spectra (Figure S1,
Supporting Information), revealing a broadening in the full width at half-maximum (fwhm) of the Ag 3d peak with increasing oxygen coveragesθO> 1.90 MLE. Broadening of the Ag 3d XPS signal due to the formation of silver oxide was also previously reported by Bukhtiyarov et al.29
The inset on the right-hand side of Figure 3 shows the variation of the O 1s/Ag 3d integrated signal ratios in XPS as a function of oxygen coverage calculated from the ozone exposure values using the TPD data inFigure 1. It is apparent that the O 1s/Ag 3d integrated signal ratio reaches a convergence for θO ≥ 3.70 MLE (Figure 3) while the total m/z = 32 TPD desorption signal intensity still continues to increase within this coverage window (Figure 1b). These observations may indicate continuous transport of oxygen species toward the subsurface region (i.e., possibly below 10 nm of the surface) of the O/Ag(111) system at high oxygen coverages which cannot be readily detectable by the surface-sensitive XPS technique. It should be noted that X-ray-induced oxygen desorption during XPS analysis could also contribute to the high-coverage convergence of the O 1s/Ag 3d signal ratio. The O 1s signal of the 2.66 MLE O/Ag(111) surface obtained at 140 K was also compared to the analogous surface prepared at 473 K using an identical ozone exposure. These results are shown in the left-hand-side inset ofFigure 3 (red and black spectra, respectively). It is apparent that the O 1s spectrum corresponding to 473 K reveals attenuated features at ca. 529 and ca. 530.5 eV, which may be attributed to the partial loss of bulklike oxide (Obulk) and surface/subsurface (Oa/Osub)
Figure 3.O 1s XPS spectra of O/Ag(111) as a function of increasing oxygen coverage obtained by increasing exposures of ozone at 140 K. The inset on the right shows the integrated O 1s/Ag 3d signal ratio as a function of the oxygen coverage. The inset on the left shows the O 1s XPS spectra for O/Ag(111) withθO= 2.66 MLE dosed at 140 K (red) and dosed at 473 K (black).
atomic oxygen species, respectively. The O 1s feature at 529 eV corresponding to bulklike oxide species shows relatively less significant attenuation. These observations indicate transport of oxygen from the surface and subsurface regions of silver toward the bulk upon thermal activation provided by annealing at 473 K.
Other than the O 1s signals due to surface atomic oxygen (Oa) and bulklike oxide (Obulk) species, a less prominent
shoulder at 532 eV is also detectable in the O 1s spectra presented inFigure 3 which can be associated with hydroxide (minority) species due to background water adsorption. Note that the presence of physisorbed oxygen species can be readily excluded due to the extremely low desorption temperature of such species (i.e.,∼50 K).26
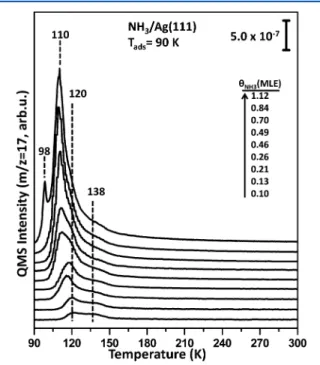
Ammonia on Ag(111). Ammonia adsorption was carried out on the clean Ag(111) surface at 90 K, and them/z = 17 signal was monitored in TPD experiments along with them/z = 28, 18, and 2 signals to check the presence of potential decomposition products and water desorption from back-ground adsorption (Figure 4). In all of the TPD experiments,
ammonia was found to desorb molecularly in a reversible manner from the clean Ag(111) single-crystal surface, where no ammonia decomposition products, namely, N2 and H2
desorption, were detectable at any ammonia coverage. Limited background water desorption was observed, and TPD spectra for the m/z = 18 channel are given in the Supporting Information(Figure S2). InFigure 4, two ammonia desorption maxima located at 138 and 120 K were observed for the lowest ammonia coverage of θNH3 = 0.10 MLE. With increasing
ammonia coverage, the desorption signal at 120 K became broader and its desorption maximum shifted to lower temperatures. Broadening and the low-temperature shift with increasing ammonia coverage in the submonolayer range are common behaviors of ammonia TPD profiles obtained from numerous metal surfaces such as Pt(111),59 Au(111),60 Rh(111),61 and Ir(100)62 which can be attributed to the
heterogeneity of the adsorbed ammonia species, as well as repulsive interactions (or decreasing attractive interactions) between the adsorbates in thefirst monolayer.63Figure 4shows that the major ammonia desorption feature at 110 K reached saturation, which was immediately followed by the appearance of an additional desorption maximum at 98 K that can be assigned to the formation of multilayer ammonia overlayers. TPD data given inFigure 4can be used to estimate the relative ammonia surface coverages. For this purpose, the multilayer signal at 98 K was deconvoluted and subtracted from the whole desorption spectrum and the integrated desorption signal between 90 and 480 K associated with the desorption maximum at 110 K was used to estimateθNH3= 1 MLE. It is
worth mentioning that TPD experiments were also performed for ammonia coverages greater than 1.12 MLE, revealing a typical zeroth-order desorption kinetics (data not shown). In the literature, analogous monolayer and multilayer ammonia desorption signals were also observed on other metal surfaces61,62 as well as on Ag(110).64 The less prominent ammonia desorption signal at 138 K in Figure 4 can be attributed to stronger ammonia adsorption on surface defects and/or adsorption of ammonia with dissimilar geometries/ orientations on different surface adsorption sites. Overall, TPD results for NH3adsorption on clean Ag(111) given inFigure 4
clearly point to the fact that, in the absence of oxygen species, Ag(111) is incapable of activating NH3. On the other hand, as
will be shown below, ammonia activation and its selective catalytic oxidation are achievable byfine-tuning the nature and surface coverage of oxygen species on Ag(111).
IRAS spectra corresponding to the adsorption of ammonia on clean Ag(111) for various coverages of ammonia at 90 K are given inFigure 5. For the lowest coverage of ammonia (θNH3=
0.21 MLE), symmetric (δs) and antisymmetric (δas) NH3
deformation signals appeared at 1072 and 1618 cm−1, respectively; while symmetric (νs) and antisymmetric (νas)
NH3 stretching modes can be seen at 3275 and 3390 cm−1, respectively.64 For submonolayer coverages, it is commonly observed that ammonia molecules are typically adsorbed on transition-metal surfaces through unpaired electrons of nitrogen
Figure 4.TPD profiles (m/z = 17) obtained after ammonia adsorption on a clean Ag(111) surface at 90 K as a function of increasing ammonia coverage.
Figure 5.IRAS spectra of ammonia adsorption on a clean Ag(111) surface at 90 K as a function of the ammonia surface coverage.
and the molecular axis stays perpendicular to the surface.65In such cases,δasandνasmodes cannot be observed as reported in the literature for ammonia adsorption on Ni(111),66 Ru(0001),67 Pt(111),68 and Cu(110).69 In contrast, IRAS data inFigure 5suggest that, on a clean Ag(111) surface, the molecular axis of ammonia is tilted with respect to the Ag(111) surface for submonolayer coverages. A similar behavior was also observed for ammonia adsorption on clean Ag(110) via electron energy loss spectroscopy (EELS).64 For the IRAS spectrum corresponding toθNH3= 0.84 MLE, theδssignal was
found to vanish and the NH3stretching modes were observed to broaden and shift to lower frequencies, namely, to 3347 and 3266 cm−1. These changes in the IRAS spectra are probably due to increasing intermolecular interactions between adsorbed ammonia molecules on Ag(111) with increasing surface coverages as well as due to the formation of hydrogen-bonding interactions. Loss of theδsfeature was also reported on NH3/ Ru(0001) by Rodriquez et al. for the second layer (i.e., multilayer) of ammonia on Ru(0001) and was attributed to the formation of intermolecular hydrogen bonding and/or a smaller IR absorption cross section of the ammonia molecules in the second layer.67
The IRAS spectrum corresponding toθNH3= 0.84 MLE also
revealed water stretching and bending signals due to back-ground water adsorption located at 3398 and 1641 cm−1, respectively.70Furthermore, the IRAS signals at 3186 and 3215 cm−1 might be related to hydronium ions and hydrogen-bonded water molecules located on the surface or on the ammonia overlayer with different orientations.70
When the ammonia coverage was increased to 1.36 MLE, the symmetric deformation mode (δs) at 1072−1077 cm−1reappeared and the antisymmetric (νas) NH3 stretching signal became broader.
Furthermore, atθNH3 = 2.17 MLE, an additional sharp signal
appeared at 3379 cm−1which can be assigned to the formation of solid multilayer ammonia.68These results are in very good agreement with the former reports in the literature for multilayer ammonia adsorption on various single crystals.67,71 Vibrational frequencies of NH3on Ag(111) for different NH3
coverages obtained by the currently presented IRAS spectra are summarized inTable 1. IRAS data given inFigure 5for NH3/ Ag(111) are in agreement with the corresponding TPD data presented in Figure 4, suggesting molecular adsorption (i.e.,
lack of dissociation) of ammonia on Ag(111) in the absence of additional oxygen species.
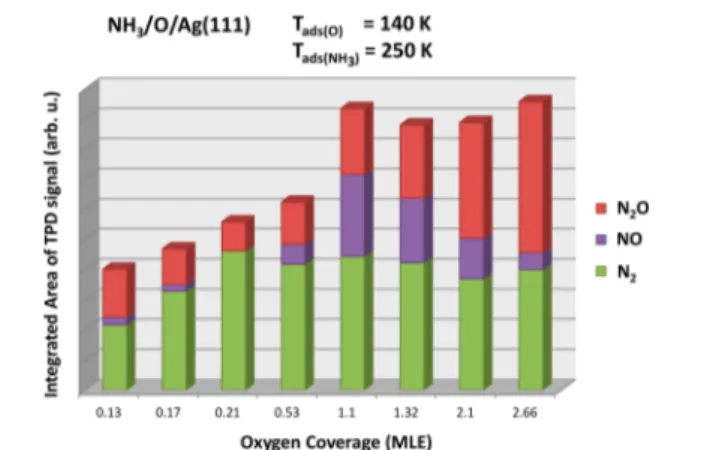
Ammonia SCO on O/Ag(111). The ammonia SCO reaction was carried out on O/Ag(111), and the resulting products were followed in TPRS experiments. To prevent poisoning of the O/Ag(1111) surface with excess ammonia, NH3 was dosed on the O/Ag(111) at 250 K (i.e., at a temperature above the desorption maximum of the first monolayer of ammonia on clean Ag(111)). During TPRS experiments,m/z = 17 (NH3), 28 (N2), 30 (NO), 44 (N2O),
46 (NO2), 32 (O2), 18 (H2O), and 2 (H2) desorption channels were simultaneously monitored.
Two different sets of TPRS spectra for the oxygen−ammonia reaction are presented inFigure 6, where the main difference
between these different sets of spectra is the temperature of oxygen delivery. While the oxygen delivery at 140 K (multicolored spectra) led to surface atomic oxygen (Oa)
species on Ag(111), oxygen delivery at 473 K (gray spectra) resulted in the formation of a p(5×1) surface oxide.
Multicolored TPRS spectra inFigure 6corresponding to the presence of surface atomic oxygen (Oa) species on Ag(111)
obtained via oxygen delivery at 140 K revealed the obvious reaction between surface oxygen species and ammonia yielding SCO products such as N2(red), NO (blue), and N2O (green) in a wide temperature range between 300 and 450 K. In addition, water desorption within the same temperature range was also in line with the N−H bond activation and hydrogen abstraction from ammonia by surface oxygen atoms on Ag(111). Neither unreacted oxygen (black spectrum inFigure 6) nor NO2formation (see Figure S3,Supporting Information) were detectable for the multicolored TPRS data. Molecular ammonia desorption was not also observed as a result of the NH3 dosage temperature (250 K), which is above the
desorption temperature of thefirst monolayer of ammonia on clean Ag(111) (seeFigure S3).
On the other hand, for the gray-colored TPRS data given in
Figure 6corresponding to the interaction of ammonia with the Table 1. Vibrational Frequency Assignments for the NH3/
Ag(111) IRAS Data Presented inFigure 5
δs(HNH) (cm−1) δ(cmas(HNH)−1) (cmνs(NH)−1) (cmνas(NH)−1) NH3on Ag(111) (θNH3= 0.21 MLE) 1072 1618 3275 3390 NH3on Ag(111) (θNH3= 0.84 MLE) 1640 3266 3347 1625 NH3on Ag(111) (θNH3= 1.36 MLE) 1077 1625 3257 3379 1651 3358 NH3on Ag(111) (θNH3= 2.17 MLE) 1077 1625 3275 3379 1651 NH3on Ag(110) (submonolayer)64 1050 1640 3320 3400 solid NH364 1060 1646 3223 3378
Figure 6.TPRS profiles for the reaction of ammonia with oxygen on Ag(111). In all of the experiments, an identical exposure of NH3(PNH3
= 2.0× 10⁻⁹Torr× 60 s) was dosed at 250 K on an oxygen-covered (θO= 0.21 MLE) Ag(111) surface, where oxygen was delivered by ozone exposure either at 140 K (multicolored spectra) or at 473 K (gray-colored spectra).
p(5×1) oxide overlayer (confirmed by LEED), a very limited extent of reaction between ammonia and oxygen was observable. The strikingly intense desorption signal of the unreacted oxygen species at 537 K was consistent with the limited ammonia oxidation by the oxide overlayer. A similar behavior was also reported by Madix and co-workers for CO oxidation on Ag(111), suggesting that the silver oxide overlayer was not the most reactive phase for the CO oxidation reaction.72 Thus, comparative analysis of the TPRS data shown in Figure 6 pointed to the fact that surface atomic oxygen (Oa) on Ag(111) could readily activate N−H bond cleavage in NH3, while ordered silver oxide (Oox) overlayers
had limited activity for ammonia oxidation.
NH3 SCO reactions on the Ag(111) single-crystal surface
containing different quantities of oxygen (delivered by ozone exposure at 140 K) were performed, and the corresponding TPRS spectra of the selected products (i.e., N2, NO, and N2O) are given inFigure 7. Alternative depictions of the same set of data are also provided in Figure S4 and S5 (Supporting
Information). Integrated desorption signals of the relevant products inFigure 7were also calculated (after compensating for the interferences between various desorption signals due to mass spectroscopic fragmentation). These results are presented as histograms in Figure 8, revealing relative ammonia SCO
selectivity for dissimilar oxygen coverages. To calculate total integrated TPRS signals of N2O inFigure 8, mass spectroscopic
fragments of N2O other thanm/z = 44 were also considered. By referring to the National Institute of Standards and Technology (NIST) mass spectroscopy database,73 relative intensities of the main fragments of N2O were obtained as
100%, 32%, and 11% form/z = 44, 30, and 28, respectively. Accordingly, the integrated m/z = 44 desorption signal was multiplied by a factor of 1.43. On the other hand, the contributions of N2O to the NO and N2integrated signals were
subtracted (removed) from the integrated m/z = 30 and 28 signals. As can be seen inFigures 7 and8, the main ammonia SCO product for low oxygen coverages (i.e., 0.13 MLE <θO< 1.10 MLE) was clearly N2and the maximum N2formation was
obtained for θO = 0.21 MLE. It is also apparent that NO selectivity increased drastically forθO= 1.10 MLE and became
comparable to that of N2.
It is worth mentioning that the N2desorption maxima shifted
to higher temperatures for θO ≥ 1.10 MLE (Figure 7a and Figure S4a, Supporting Information) and additional N2
desorption states also became visible. This observation was concomitant with the appearance of excess oxygen desorption associated with surface and subsurface/bulk oxide states (Figure S5, Supporting Information). Thus, it can be argued that formation of oxide species abundant in oxygen led to an attractive interaction between oxygen species and atomic nitrogen, resulting in the stabilization of the atomic nitrogen species generated by N−H bond activation of NH3and a shift
in the N2 desorption maxima to higher temperatures. Furthermore, generation of additional high-temperature N2
desorption states at elevated oxygen coverages can also be attributed to the increasing heterogeneity of the adsorption sites of the substrate surface due to the formation of bulklike silver oxide.
Furthermore, unreacted NH3was also monitored (Figure S6,
Supporting Information) for the set of experiments presented inFigure 7. These results revealed limited amounts of ammonia desorption (i.e., a lack of the presence of excess ammonia),
Figure 7.TPRS profiles of various ammonia SCO reaction products (i.e., N2, NO, and N2O) for the reaction between ammonia and oxygen-precovered Ag(111) surfaces as a function of the oxygen coverage. For all of the data, oxygen was delivered on Ag(111) by ozone exposure at 140 K, while NH3was delivered using an identical ammonia exposure at 250 K (PNH3= 2.0× 10
−9Torr× 60 s).
Figure 8.Integrated TPD desorption signals for the main ammonia SCO products (i.e., N2, NO, and N2O) on an O/Ag(111) surface as a function of the oxygen coverage extracted from the TPRS data given in
Figure 7. See the text for details.
suggesting a high conversion of ammonia for the particular set of experimental conditions chosen forFigure 7.
It is worth mentioning that IRAS measurements were also performed at 250 K for SCO of ammonia on the atomic oxygen (Oa) covered Ag(111) surface using experimental conditions
(coverages) similar to the ones chosen for the TPRS experiments given in Figure 7. However, no IRAS signals were detected, possibly due to the unfavorable adsorption geometry or small IR absorption cross sections of the reactants and products lying possibly close to parallel to the surface.
The overall reactivity and selectivity trends of ammonia SCO on O/Ag(111) as a function of the adsorption temperature, oxygen surface coverage, and nature of the oxygen species deduced from the currently presented experimentalfindings are summarized inScheme 1.
■
CONCLUSIONSIn the current study, SCO of ammonia on O/Ag(111) was investigated by utilizing a multitude of surface-sensitive spectroscopic and diffraction techniques where a unique oxygen delivery agent (i.e., ozone) was utilized under UHV conditions, eliminating the need for high-pressure O2 exposures. TPD/
TPRS, XPS, and LEED data suggest that a variety of oxygen species can be generated on the Ag(111) surface upon ozone adsorption, such as atomic (chemisorbed) oxygen, surface oxide, and bulklike oxide species. Indications of oxygen transport to the subsurface region of silver at elevated ozone exposures were also detected. Oxygen overlayers prepared via ozone exposure at 140 K in UHV led to disordered overlayers (in the form of either atomic oxygen or bulklike silver oxide) for all oxygen coverages, while annealing of these overlayers for intermediate oxygen coverages at 473 K resulted in the formation of ordered surface oxides with p(5×1) and c(4×8) structures. The clean Ag(111) surface was found to be incapable of activating N−H bonds of ammonia under UHV conditions in the absence of ozone exposure. Disordered
atomic oxygen overlayers prepared on Ag(111) at 140 K forθO < 1.10 MLE were found to be highly selective in SCO of ammonia, producing N2as the dominant product. On the other hand, ordered p(5×1) and c(4×8) surface oxide overlayers on Ag(111) prepared via ozone adsorption at 473 K were found to be almost entirely inactive in SCO where NH3 and O2
desorbed in an intact manner in TPRS experiments. It was observed that extreme oxygen exposures on Ag(111) (θO >
1.93 MLE) at 140 K led to bulklike silver oxide species with poor N2selectivity in ammonia SCO and increasing extent of
formation of toxic pollutants such as NO and N2O. Currently presented experimentalfindings on the Ag(111) single-crystal model catalyst surface reveal valuable insights as well as new structure−functionality relationships at the molecular level regarding the reactivity of oxygen species in ammonia SCO. These findings may also be relevant to other crucial heterogeneous catalytic oxidation/partial oxidation/oxidative coupling processes of CO, alkenes, and alcohols.
■
ASSOCIATED CONTENT*
S Supporting InformationThe Supporting Information is available free of charge on the
ACS Publications websiteat DOI:10.1021/acs.jpcc.7b08291. Ag 3d XPS spectra for clean Ag(111), Oa/Ag(111), and
Obulk/Ag(111), TPD profiles for the H2O (m/z = 18) desorption channel for the data given inFigure 4, TPRS profiles for the NO2(m/z = 46) and NH3(m/z = 17)
desorption channels for the data given in Figure 6, alternative depiction of the TPRS profiles of various ammonia SCO reaction products given inFigure 7, and TPRS profiles for the O2(m/z = 32), NH3and OH (m/z
= 17), and H2O (m/z = 18) desorption channels for the
data given inFigure 7(PDF)
■
AUTHOR INFORMATION Corresponding Author *E-mail:[email protected]. ORCID Mustafa Karatok:0000-0001-5509-5463 Evgeny I. Vovk:0000-0001-9340-0027 Present Address∥E.I.V.: ShanghaiTech University, 201210 Shanghai, China. Notes
The authors declare no competingfinancial interest.
■
ACKNOWLEDGMENTSWe acknowledge thefinancial support from the Scientific and Technological Research Council of Turkey (TUBITAK) (Project Code 112T589). We also gratefully acknowledge Prof. Mehmet Erbudak (Physics Department, ETH Zurich) for his contributions regarding the construction of the UHV experimental setup. We also acknowledge the scientific collaboration with the TARLA project founded by the Ministry of Development of Turkey under Grant No. DPT2006K-120470.
■
REFERENCES(1) Jabłońska, M.; Palkovits, R. Copper Based Catalysts for the Selective Ammonia Oxidation into Nitrogen and Water Vapour Recent Trends and Open Challenges.Appl. Catal., B 2016, 181, 332− 351.
Scheme 1. Reactivity and Selectivity Trends of Ammonia SCO on O/Ag(111) as a Function of the Oxygen Coverage and Temperature
(2) Park, S. J.; Jin, S. Y. Effect of Ozone Treatment on Ammonia Removal of Activated Carbons.J. Colloid Interface Sci. 2005, 286 (1), 417−419.
(3) Eurostat Statistics Explained. http://ec.europa.eu/eurostat/ statistics-explained/index.php/Agriculture_-_ammonia_emission_ statistics(accessed Aug 1, 2017).
(4) Fangmeier, A.; Hadwiger-Fangmeier, A.; Van der Eerden, L.; Jäger, H. J. Effects of Atmospheric Ammonia on Vegetationa Review.Environ. Pollut. 1994, 86 (1), 43−82.
(5) Busca, G.; Pistarino, C. Abatement of Ammonia and Amines from Waste Gases: a Summary.J. Loss Prev. Process Ind. 2003, 16 (2), 157− 163.
(6) Gang, L.; Anderson, B. G.; Van Grondelle, J.; Van Santen, R. A.; Van Gennip, W. J. H.; Niemantsverdriet, J. W.; Kooyman, P. J.; Knoester, A.; Brongersma, H. H. Alumina-Supported Cu−Ag Catalysts for Ammonia Oxidation to Nitrogen at Low Temperature.J. Catal. 2002,206 (1), 60−70.
(7) Davies, P. R.; Newton, N. G. The Chemisorption and Decomposition of Pyridine and Ammonia at Clean and Oxidised Al (111) Surfaces.Surf. Sci. 2003, 546 (2), 149−158.
(8) Lescop, B.; Galtayries, A.; Fanjoux, G. Thermal Chemistry of NH3on Oxygen-Pretreated Ni(111) Studied by Metastable Induced Electron Spectroscopy and Ultraviolet Photoelectron Spectroscopy.J. Phys. Chem. B 2004, 108 (36), 13711−13718.
(9) Ludvíková, J.; Jabłońska, M.; Jirátová, K.; Chmielarz, L.; Balabánová, J.; Kovanda, F.; Obalová, L. Co−Mn−Al Mixed Oxides as Catalysts for Ammonia Oxidation to N2O. Res. Chem. Intermed. 2016,42 (3), 2669−2690.
(10) Zhang, Q.; Wang, H.; Ning, P.; Song, Z.; Liu, X.; Duan, Y. In situ DRIFTS Studies on CuO-Fe2O3Catalysts for Low Temperature Selective Catalytic Oxidation of Ammonia to Nitrogen.Appl. Surf. Sci. 2017,419, 733−743.
(11) Bradley, J. M.; Hopkinson, A.; King, D. A. Control of a Biphasic Surface Reaction by Oxygen Coverage: the Catalytic Oxidation of Ammonia over Pt {100}.J. Phys. Chem. 1995, 99 (46), 17032−17042. (12) Gang, L.; Anderson, B. G.; van Grondelle, J.; van Santen, R. A. Intermediate Species and Reaction Pathways for the Oxidation of Ammonia on Powdered Catalysts.J. Catal. 2001, 199 (1), 107−114.
(13) Long, R. Q.; Yang, R. T. Noble Metal (Pt, Rh, Pd) Promoted Fe-ZSM-5 for Selective Catalytic Oxidation of Ammonia to N2at Low Temperatures.Catal. Lett. 2002, 78 (1−4), 353−357.
(14) Gang, L.; Anderson, B. G.; Van Grondelle, J.; Van Santen, R. A. Low Temperature Selective Oxidation of Ammonia to Nitrogen on Silver-Based Catalysts.Appl. Catal., B 2003, 40 (2), 101−110.
(15) Weststrate, C. J.; Bakker, J. W.; Rienks, E. D. L.; Martinez, J. R.; Vinod, C. P.; Lizzit, S.; Petaccia, L.; Baraldi, A.; Nieuwenhuys, B. E. Selective NH3 Oxidation on (110) and (111) Iridium Surfaces. J. Catal. 2005, 235 (1), 92−102.
(16) Gong, J.; Ojifinni, R. A.; Kim, T. S.; White, J. M.; Mullins, C. B. Selective Catalytic Oxidation of Ammonia to Nitrogen on Atomic Oxygen Precovered Au (111). J. Am. Chem. Soc. 2006, 128 (28), 9012−9013.
(17) Chmielarz, L.; Jabłońska, M. Advances in Selective Catalytic Oxidation of Ammonia to Dinitrogen: a Review. RSC Adv. 2015, 5 (54), 43408−43431.
(18) Lippits, M. J.; Gluhoi, A. C.; Nieuwenhuys, B. E. A Comparative Study of the Selective Oxidation of NH3to N2over Gold, Silver and Copper Catalysts and the Effect of Addition of Li2O and CeOx.Catal. Today 2008, 137 (2), 446−452.
(19) Yang, M.; Wu, C.; Zhang, C.; He, H. Selective Oxidation of Ammonia over Copper-Silver-Based Catalysts.Catal. Today 2004, 90 (3), 263−267.
(20) Zhang, L.; Zhang, C.; He, H. The Role of Silver Species on Ag/ Al2O3Catalysts for the Selective Catalytic Oxidation of Ammonia to Nitrogen.J. Catal. 2009, 261 (1), 101−109.
(21) Dean, M.; Bowker, M. Adsorption Studies on Catalysts under UHV/HV Conditions: I. Oxygen Adsorption on Alumina Supported Silver.Appl. Surf. Sci. 1988, 35 (1), 27−40.
(22) Rovida, G.; Pratesi, F.; Maglietta, M.; Ferroni, E. Effects of Oxygen on Silver Surface Structure.J. Vac. Sci. Technol. 1972, 9 (2), 796−799.
(23) Rovida, G.; Pratesi, F.; Maglietta, M.; Ferroni, E. Chemisorption of Oxygen on the Silver (111) Surface.Surf. Sci. 1974, 43 (1), 230− 256.
(24) Engelhardt, H. A.; Menzel, D. Adsorption of Oxygen on Silver Single Crystal Surfaces.Surf. Sci. 1976, 57 (2), 591−618.
(25) Grant, R. B.; Lambert, R. M. Basic Studies of the Oxygen Surface Chemistry of Silver: Chemisorbed Atomic and Molecular Species on Pure Ag (111).Surf. Sci. 1984, 146 (1), 256−268.
(26) Campbell, C. T. Atomic and Molecular Oxygen Adsorption on Ag (111).Surf. Sci. 1985, 157 (1), 43−60.
(27) Bukhtiyarov, V. I.; Boronin, A. I.; Savchenko, V. I. Two Oxygen States and the Role of Carbon in Partial Oxidation of Ethylene over Silver.Surf. Sci. 1990, 232 (1−2), L205−L209.
(28) Bao, X.; Muhler, M.; Schedel-Niedrig, T.; Schlögl, R. Interaction of Oxygen with Silver at High Temperature and Atmospheric Pressure: a Spectroscopic and Structural Analysis of a Strongly Bound Surface Species. Phys. Rev. B: Condens. Matter Mater. Phys. 1996,54 (3), 2249.
(29) Bukhtiyarov, V. I.; Kaichev, V. V.; Prosvirin, I. P. Oxygen Adsorption on Ag (111): X-ray Photoelectron Spectroscopy (XPS), Angular Dependent X-ray Photoelectron Spectroscopy (ADXPS) and Temperature-Programmed Desorption (TPD) Studies.J. Chem. Phys. 1999,111 (5), 2169−2175.
(30) Bukhtiyarov, V. I.; Hävecker, M.; Kaichev, V. V.; Knop-Gericke, A.; Mayer, R. W.; Schlögl, R. Atomic Oxygen Species on Silver: Photoelectron Spectroscopy and X-ray Absorption Studies.Phys. Rev. B: Condens. Matter Mater. Phys. 2003, 67 (23), 235422.
(31) Huang, W. X.; White, J. M. Revisiting NO2 on Ag (111): A Detailed TPD and RAIRS Study.Surf. Sci. 2003, 529 (3), 455−470.
(32) Reicho, A.; Stierle, A.; Costina, I.; Dosch, H. Stranski− Krastanov like Oxide Growth on Ag (111) at Atmospheric Oxygen Pressures.Surf. Sci. 2007, 601 (4), L19−L23.
(33) Li, W. X.; Stampfl, C.; Scheffler, M. Subsurface Oxygen and Surface Oxide Formation at Ag (111): A Density-Functional Theory Investigation.Phys. Rev. B: Condens. Matter Mater. Phys. 2003, 67 (4), 045408.
(34) Michaelides, A.; Bocquet, M. L.; Sautet, P.; Alavi, A.; King, D. A. Structures and Thermodynamic Phase Transitions for Oxygen and Silver Oxide Phases on Ag (111).Chem. Phys. Lett. 2003, 367 (3), 344−350.
(35) Xu, Y.; Greeley, J.; Mavrikakis, M. Effect of Subsurface Oxygen on the Reactivity of the Ag (111) Surface.J. Am. Chem. Soc. 2005, 127 (37), 12823−12827.
(36) Schmid, M.; Reicho, A.; Stierle, A.; Costina, I.; Klikovits, J.; Kostelnik, P.; Dubay, O.; Kreesse, G.; Gustafson, J.; Lundgren, E.; et al. Structure of Ag (111)−p (4×4)−O: No Silver Oxide. Phys. Rev. Lett. 2006, 96 (14), 146102.
(37) Schnadt, J.; Michaelides, A.; Knudsen, J.; Vang, R. T.; Reuter, K.; Lægsgaard, E.; Scheffler, M.; Besenbacher, F. Revisiting the Structure of the p (4×4) Surface Oxide on Ag (111). Phys. Rev. Lett. 2006,96 (14), 146101.
(38) Schnadt, J.; Knudsen, J.; Hu, X. L.; Michaelides, A.; Vang, R. T.; Reuter, K.; Li, Z.; Lægsgaard, E.; Scheffler, M.; Besenbacher, F. Experimental and Theoretical Study of Oxygen Adsorption Structures on Ag (111).Phys. Rev. B: Condens. Matter Mater. Phys. 2009, 80 (7), 075424.
(39) Rocha, T. C.; Oestereich, A.; Demidov, D. V.; Hävecker, M.; Zafeiratos, S.; Weinberg, G.; Bukhtiyarov, V. I.; Knop-Gericke, A.; Schlögl, R. The Silver−Oxygen System in Catalysis: New Insights by Near Ambient Pressure X-ray Photoelectron Spectroscopy. Phys. Chem. Chem. Phys. 2012, 14 (13), 4554−4564.
(40) Günther, S.; Böcklein, S.; Wintterlin, J.; Niño, M. A.; Menteş, T. O.; Locatelli, A. Locating Catalytically Active Oxygen on Ag (111)A Spectromicroscopy Study.ChemCatChem 2013, 5 (11), 3342−3350.
(41) Martin, N. M.; Klacar, S.; Gronbeck, H.; Knudsen, J.; Schnadt, J.; Blomberg, S.; Gustafson, J.; Lundgren, E. High-Coverage
Induced Surface Structures on Ag (111).J. Phys. Chem. C 2014, 118 (28), 15324−15331.
(42) Derouin, J.; Farber, R. G.; Heslop, S. L.; Killelea, D. R. Formation of Surface Oxides and Ag2O Thin Films with Atomic Oxygen on Ag (111).Surf. Sci. 2015, 641, L1−L4.
(43) Jones, T. E.; Rocha, T. C.; Knop-Gericke, A.; Stampfl, C.; Schlögl, R.; Piccinin, S. Thermodynamic and Spectroscopic Properties of Oxygen on Silver under an Oxygen Atmosphere.Phys. Chem. Chem. Phys. 2015, 17 (14), 9288−9312.
(44) Heine, C.; Eren, B.; Lechner, B. A.; Salmeron, M. A Study of the O/Ag (111) System with Scanning Tunneling Microscopy and X-ray Photoelectron Spectroscopy at Ambient Pressures.Surf. Sci. 2016, 652, 51−57.
(45) Derouin, J.; Farber, R. G.; Turano, M. E.; Iski, E. V.; Killelea, D. R. Thermally Selective Formation of Subsurface Oxygen in Ag (111) and Consequent Surface Structure. ACS Catal. 2016, 6 (7), 4640− 4646.
(46) Andryushechkin, B. V.; Shevlyuga, V. M.; Pavlova, T. Y. V. E.; Zhidomirov, G. M.; Eltsov, K. N. Structural Transformations on an Oxidized Ag (111) Surface.JETP Lett. 2017, 105 (5), 292−296.
(47) Carlisle, C. I.; King, D. A.; Bocquet, M. L.; Cerdá, J.; Sautet, P. Imaging the Surface and the Interface Atoms of an Oxide Film on Ag (111) by Scanning Tunneling Microscopy: Experiment and Theory. Phys. Rev. Lett. 2000, 84 (17), 3899.
(48) Bao, X.; Barth, J. V.; Lehmpfuhl, G.; Schuster, R.; Uchida, Y.; Schlögl, R.; Ertl, G. Oxygen-Induced Restructuring of Ag (111). Surf. Sci. 1993, 284 (1−2), 14−22.
(49) Michaelides, A.; Reuter, K.; Scheffler, M. When Seeing is not Believing: Oxygen on Ag (111), a Simple Adsorption System?J. Vac. Sci. Technol., A 2005, 23 (6), 1487−1497.
(50) Bare, S. R.; Griffiths, K.; Lennard, W. N.; Tang, H. T. Generation of Atomic Oxygen on Ag (111) and Ag (110) Using NO2: a TPD, LEED, HREELS, XPS and NRA Study.Surf. Sci. 1995, 342 (1−3), 185−198.
(51) Popova, I.; Zhukov, V.; Yates, J. T. Comparative Study of Al (111) Oxidation with O3and O2.Surf. Sci. 2002, 518 (1), 39−48.
(52) Parker, D. H.; Koel, B. E. Chemisorption of High Coverages of Atomic Oxygen on the Pt (111), Pd (111), and Au (111) Surfaces.J. Vac. Sci. Technol., A 1990, 8 (3), 2585−2590.
(53) Saliba, N. A.; Tsai, Y. L.; Panja, C.; Koel, B. E. Oxidation of Pt (111) by Ozone (O3) under UHV Conditions.Surf. Sci. 1999, 419 (2), 79−88.
(54) Saliba, N.; Parker, D. H.; Koel, B. E. Adsorption of Oxygen on Au (111) by Exposure to Ozone.Surf. Sci. 1998, 410 (2), 270−282.
(55) Karatok, M.; Vovk, E. I.; Shah, A. A.; Turksoy, A.; Ozensoy, E. Acetaldehyde Partial Oxidation on the Au (111) Model Catalyst Surface: C−C Bond Activation and Formation of Methyl Acetate as an Oxidative Coupling Product.Surf. Sci. 2015, 641, 289−293.
(56) Backx, C.; De Groot, C. P. M.; Biloen, P. Adsorption of Oxygen on Ag (110) Studied by High Resolution ELS and TPD.Surf. Sci. 1981,104 (1), 300−317.
(57) Reichelt, R.; Günther, S.; Rößler, M.; Wintterlin, J.; Kubias, B.; Jakobi, B.; Schlögl, R. High-Pressure STM of the Interaction of Oxygen with Ag (111).Phys. Chem. Chem. Phys. 2007, 9 (27), 3590− 3599.
(58) Bao, X.; Muhler, M.; Pettinger, B.; Schlögl, R.; Ertl, G. On the Nature of the Active State of Silver During Catalytic Oxidation of Methanol.Catal. Lett. 1993, 22 (3), 215−225.
(59) Fisher, G. B. The Electronic Structure of Two Forms of Molecular Ammonia Adsorbed on Pt (111).Chem. Phys. Lett. 1981, 79 (3), 452−458.
(60) Kay, B. D.; Lykke, K. R.; Creighton, J. R.; Ward, S. J. The Influence of Adsorbate−Absorbate Hydrogen Bonding in Molecular Chemisorption: NH3, HF, and H2O on Au (111).J. Chem. Phys. 1989, 91 (8), 5120−5121.
(61) Van Hardeveld, R. M.; Van Santen, R. A.; Niemantsverdriet, J. W. The Adsorption of NH3on Rh (111).Surf. Sci. 1996, 369 (1−3), 23−35.
(62) Santra, A. K.; Min, B. K.; Yi, C. W.; Luo, K.; Choudhary, T. V.; Goodman, D. W. Decomposition of NH3on Ir (100): A Temperature Programmed Desorption Study.J. Phys. Chem. B 2002, 106 (2), 340− 344.
(63) Chorkendorff, I.; Niemantsverdriet, J. W. Concepts of Modern Catalysis and Kinetics; John Wiley & Sons: Weinheim, Germany, 2003. (64) Gland, J. L.; Sexton, B. A.; Mitchell, G. E. Ammonia Adsorption on the Ag (110) Surface.Surf. Sci. 1982, 115 (3), 623−632.
(65) Sälli, E.; Martiskainen, S.; Halonen, L. Computational Study of the Vibrational Structure of the Ammonia Molecule Adsorbed on the FCC (111) Transition Metal Surfaces.J. Phys. Chem. C 2012, 116 (28), 14960−14969.
(66) Xu, Z.; Hanley, L.; Yates, J. T., Jr Layer Interactions Between Dissimilar Adsorbates. NH3Layers on Chemisorbed CO on Ni (111): A Reflection Infrared Study.J. Chem. Phys. 1992, 96 (2), 1621−1627. (67) Rodriguez, J.; Kuhn, W. K.; Truong, C. M.; Goodman, D. W. A FT-IRAS Study of Ammonia Adsorbed on Ru (0001).Surf. Sci. 1992, 271 (3), 333−339.
(68) Villegas, I.; Weaver, M. J. Infrared Spectroscopy of Model Electrochemical Interfaces in Ultrahigh Vacuum: Interfacial Cation Solvation by Ammonia on Pt (111).Surf. Sci. 1996, 367 (2), 162−176. (69) Pradier, C. M.; Adamski, A.; Méthivier, C.; Louis-Rose, I. Interaction of NH3and Oxygen with Cu (110), Investigated by FT-IRAS.J. Mol. Catal. A: Chem. 2002, 186 (1), 193−201.
(70) Fukushima, T.; Song, M. B.; Ito, M. Local Work-Function Changes of Pt (111) Studied by STM and IRAS: Coadsorption of Cl− with H3O+, NO, and CO Molecules.Surf. Sci. 2000, 464 (2), 193−199. (71) Gohndrone, J. M.; Olsen, C. W.; Backman, A. L.; Gow, T. R.; Yagasaki, E.; Masel, R. I. Ammonia Adsorption and Decomposition on Several Faces of Platinum.J. Vac. Sci. Technol., A 1989, 7 (3), 1986− 1990.
(72) Klust, A.; Madix, R. J. Mesoscopic Restructuring and Mass Transport of Metal Atoms During Reduction of the Ag (111)-p (4×4)-O Surface with CO. J. Chem. Phys. 2007, 126 (8), 084707.
(73) NIST Chemistry WebBook. http://webbook.nist.gov/cgi/ cbook.cgi?ID=C10024972&Units=SI&Mask=200#Mass-Spec (ac-cessed Aug 1, 2017).