Determination of the Metabolizable Energy (ME) and Net Energy
Lactation (NEL) Contents of Some Feeds in the Marmara Region by
In vitro Gas Technique*
‹smail ABAfi, Haydar ÖZPINAR, H. Can KUTAY, Recep KAHRAMAN
Department of Animal Nutrition and Nutritional Diseases, Faculty of Veterinary Medicine, ‹stanbul University, 34851 Avc›lar, ‹stanbul - TURKEY
Hüseyin ESECEL‹
Band›rma Vocational High School, Bal›kesir University, Bal›kesir – TURKEY
Received: 22.09.2003
Abstract: In this study, chemical composition and energy values of some forages, raw materials and commercial feeds commonly
used in the Marmara Region for ruminants were determined. Samples of sunflower meal, barley, wheat, oat, corn, wheat bran, grass hay, vetch hay, alfalfa hay and compound feeds were collected for evaluation.
The samples of feed were analyzed for their chemical composition. Gas production capacity, in vitro organic matter digestibility and energy values of feeds were studied by Hohenheim Gas Test. The feed samples were incubated with rumen liquor for 24 hours and net gas production was computed. Digestibility values of organic matter and energy content were calculated.
Variation in the chemical compositions was observed among forages at 3.23% to 20.89% for crude protein, 21.75% to 50.16% for crude fiber, 0.15% to 4.61% for ether extracts. In grains, crude protein ranged from 9.26% to 12.3%, crude fiber from 4.11% to 11.66%, and ether extract from 1.72% to 4.49%. The values of crude protein, crude fiber and ether extract in commercial dairy cows and beef cattle feed varied between 13.66% and 21.91%, 3.48% and 13.18%, and 2.09% and 6.60%, respectively. Net gas production value of forages was found between 12.38 and 52.54 ml/200 mg DM. ME and NEL contents of forages ranged from 3.07 to 10.22 MJ/kg DM and from 1.08 to 6.24 MJ/kg DM, respectively. The average gas production of oat, barley, wheat and corn was 59.20, 63.59, 68.00 and 67.94 ml/200 mg DM. Calculated ME and NEL values of corn, wheat, barley and oat by in vitro gas production were 13.08, 12.99, 12.45 and 12.10 MJ/kg DM and 8.30, 8.25, 7.84 and 7.55 MJ/kg DM, respectively. Net gas production of beef cattle feed and dairy feed was 51.48 ml/200 mg DM and 51.59 ml/200 mg DM. ME and NEL values of these feeds were 9.23-12.99 and 5.43-8.20 MJ/kg DM for beef cattle and 9.74-12.67 and 5.76-7.89 MJ/kg DM for dairy cattle feed.
In this study, the nutrient composition and energy values of feedstuffs commonly grown or produced in the Marmara Region were tabulated. The results should help us better understand the nutrition potential of such feedstuffs and provide basic information in ruminant feeding.
Key Words: Feedstuffs, chemical composition, in vitro gas technique, ME, NEL
Marmara Bölgesindeki Baz› Yemlerin ‹n Vitro Gaz Tekni¤i ile Metabolize Olabilir Enerji (ME) ve Net Enerji Laktasyon (NEL) ‹çeriklerinin Saptanmas›
Özet: Bu çal›flmada, Marmara Bölgesinde ruminant beslenmesinde yo¤un olarak kullan›lan baz› kaba yemler, yem hammaddeleri ve
karma yemlerin kimyasal kompozisyonlar› ile enerji de¤erleri tespit edilmifltir.
De¤erlendirme için ayçiçe¤i küspesi, arpa, bu¤day, yulaf, m›s›r, bu¤day kepe¤i, kuru ot, fi¤ kuru otu, yonca kuru otu ile karma yem örnekleri toplanm›flt›r. Yem örnekleri kimyasal kompozisyonlar› için analiz edilmifltir. Yemlerin gaz üretim kapasiteleri, organik madde sindirilebilirli¤i ve enerji içerikleri Hohenheim Gaz Testi ile tespit edilmifltir. Yem örnekleri rumen s›v›s›yla 24 saat inkubasyona b›rak›lm›fl ve net gaz üretimleri ölçülmüfltür. Organik madde sindirilebilirlik de¤eri ve enerji içerikleri hesaplanm›flt›r.
Kaba yemler aras›ndaki kimyasal komposizyondaki de¤ifliklik ham protein için % 3,23 ile % 20,89; ham selüloz için % 21,75 ile 50,16 ve ham ya¤ için % 0,15 ile 4.61 olarak gözlemlenmifltir. Tane yemlerden arpa, bu¤day, m›s›r ve yulaf›n ham protein de¤erleri % 9,26 ile % 12,30; ham selüloz % 4,11 ile % 11,66; ham ya¤ % 1,72 ile % 4,49 aras›nda bulunmufltur. Karma yemlerden süt yemi ile besi yeminin ham protein de¤eri % 13,66 - % 21,91; ham selüloz oran› % 3,48 - % 13,18; ham ya¤ % 2,09 - % 6,60 aral›¤›nda de¤iflmifltir. Net gaz üretim miktar› kaba yemlerde 12,38- 52,54 ml/200 mg KM olarak bulunurken ME ve NEL de¤erleri
Introduction
The major item of cost in the production of animals is feed. The level of milk yield and growth performance of ruminants is limited largely by the feed quality. Often it has been suggested that the quality of feeds depends primarily on the energy content. Especially, measuring the energy values of feed is a key aspect of animal nutrition. The available energy content of feeds must be known before formulating diets. Generally, the energy content of ruminant feeds has not been analyzed but charts prepared by the NRC or chemical analysis values are used instead (1). However, the nutrient composition and energy value of feeds varies widely according to different plant genetics, growing season, fertilizer, irrigation and harvesting stage.
The metabolizable energy (ME) and net energy (NE) levels of feedstuffs have been calculated by in vivo trials and crude nutrients content of feeds in ruminants (2,3).
The evaluation of feeds for whole tract and ruminal digestion through in vivo experiments is time-consuming, laborious and expensive and requires large quantities of feed samples (3,4). For these reasons, other techniques have been developed in situ and in vitro, to predict the rumen degradation of feed.
The digestibility of feeds or directly energy content can be estimated by in vitro methods that simulate the digestion process (5,6). The Hohenheim Gas test (6) is one of the in vitro methods used for the estimation of organic matter digestibility and the energy content of feedstuffs for ruminants. This method relies on the measurement of total amount of gas produced during fermentation of feed with buffered rumen fluid in calibrated glass syringes and then multivariate regression equations using gas production together with crude nutrient contents allow a very accurate prediction of digestibility and energy content (6,7). A high correlation
was determined between in vivo organic matter digestibility and in vitro gas production at 24 h (R = 0.98, SD = 0.25) (6).
Krishnamoorthy et al. (8) reported that the energy value and rate of organic matter fermentation calculated from in vitro fermentation seem to be in agreement with values in vivo for many feedstuffs with some exceptions. Lee et al. (9) showed a close relationship between the energy value of forage calculated on in vivo digestion trial and in vitro gas production parameters. Accordingly, it was indicated that energy value of forages could be estimated rapidly using an in vitro gas method to replace the digestion trial. Getachew et al. (3) also suggested that this technique may be suitable for evaluating energy value of feed grain. In addition, it is remarkable that the method using buffered fecal suspension as the inocula for the fermentation in vitro was almost as accurate as the method using rumen fluid in predicting the digestibility and energy content of feeds (10,11).
Aiple et al. (12) suggested that the cellulase technique and the gas test are suitable in vitro techniques in compound feeds for dairy cows. With both procedures the relationships between energy contents estimated in vitro and energy contents measured in vivo showed residual errors of less than 4%. However, for the evaluation of raw materials the gas test was superior. On the other hand, Getachew et al. (13) also reported that energy values of ruminant feeds predicted by gas production technique by laboratories in different parts of the world cannot be considered absolute.
Some researchers (14,15) also showed significant correlation between the energy levels obtained by in vitro gas test and in vivo trial. It was suggested that the in vitro gas production method could be widely used to evaluate the energy values and rumen fermentation characteristics of feeds (14-16).
de s›ras›yla 3,07 ile 10,22 MJ/kg KM, ve 1,08 ve 6,24 MJ/kg KM hesaplanm›flt›r. Yulaf, arpa, bu¤day ve m›s›r›n ortalama gaz üretim miktar›, 59,20; 63,54; 68,00; ve 67,94 ml/200 mg KM olarak tespit edilmifltir. M›s›r, bu¤day, arpa ve yulaf›n ME de¤erleri, 13,08; 12,99; 12,45; 12,10 MJ/kg KM, NEL de¤erleri ise s›ras›yla 8,30; 8,25; 7,84 ve 7,55 MJ/kg KM olarak hesaplanm›flt›r. Besi yemi ile süt yeminin net gaz üretimi 51,48 ile 51,59 ml/200 mg KM iken, besi yeminin ME ve NEL de¤erleri, 9,23 12,99 ve 5,43 -8,20 MJ/kg KM, süt yeminin ise 9,74 - 12,67; 5,76 - 7,89 MJ/kg KM hesaplanm›flt›r.
Bu çal›flmada Marmara Bölgesinde yo¤un olarak yetifltirilen ve üretilen yem maddelerinin besin maddeleri kompozisyonu ile enerji de¤erleri tespit edilerek tablo haline getirilmifltir. Bu sonuçlar bu yem maddelerinin besin de¤erlerinin daha iyi anlafl›lmas› ve ruminant beslenmesinde temel bilgilerin sa¤lanmas›nda bize yard›mc› olacakt›r.
The Marmara Region is one of the most important livestock production areas in Turkey. There is limited information on nutritive and energy values of feedstuffs commonly harvested and produced in this area. The objective of this study was to determine the chemical composition and energy values of some forages, raw materials and commercial feeds commonly used in ruminant nutrition in the Marmara Region, and to calculate energy level, gas production capacity and organic matter digestibility of feeds by using the in vitro gas production technique.
Materials and Methods Materials
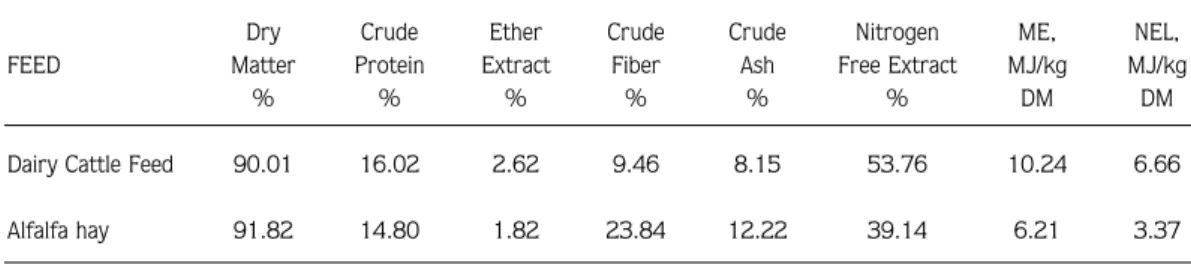
Rumen liquor was obtained from two cannulated cows (550 kg average live weight). Each animal received 60% alfalfa hay and 40 % concentrate ration (Table 1) daily in two identical meals at 08.30 – 18.00 h.
Feed samples were collected from the Marmara Region. Samples of forage (grass hay, alfalfa hay, wheat straw and vetch hay), grains (corn, wheat, barley and oats), by-products (sunflower meal and wheat bran) and commercial mixed feeds (dairy cows feed and beef cattle feed), which are being used mostly for feeding ruminants in the Marmara Region, were chosen for evaluation.
Samples of each feed were ground using a laboratory mill through a 1 mm screen for chemical analyses and incubation in vitro.
Methods
The nutrition quantities of feed samples were determined according to the Weende Analyses System (17).
The feed samples were incubated in vitro in buffered rumen fluid and gas production was measured as described by Menke and Steingass (7).
The fresh rumen fluid was taken from rumen fistula of dairy cows before the morning feeding. Approximately 200 mg of air-dried and ground feed sample was weighed and placed into a 100 ml calibrated glass syringe. Buffer and mineral solution was prepared and placed in a water bath at 39 °C under continuous flushing with CO2. The mixed and CO2 flushed rumen fluid was
added to buffered mineral solution [1/2 (v/v)] which was maintained in a water bath at 39 °C. Thirty milliliters of rumen fluid-medium mixture was transferred with an automatic pipette into each glass syringe containing feed samples and the syringes were immediately placed into an incubator with a rotating disc. Three syringes with only buffered rumen fluid (blank incubation) and two standards (hay and concentrate) with known gas production were incubated each run. The feedstuffs were incubated in triplicate on at least two different days, yielding 6 parallel measurements.
Incubation was terminated after recording the 24-h gas volume. The gas production of feed samples, the standard samples and blank incubation were recorded after 0, 8 and 24 h of incubation and net gas production was computed (18). The ME, NEL and DOM values in feeds were calculated using equations of Menke and Steingass (7).
For concentrate, grains and by-product
ME (MJ/kg DM): 0.157*GP+0.0084*CP+0.022*EE-0.0081*CA+1.06 (n=200/ r2=0.94) NEL (MJ/kg DM): 0.115*GP+0.0054*CP+0.014*EE-0.0054 CA-0.36 (n=200/ r2=0.93) DOM %: 0.9991*GP+0.0595*CP+0.0181*CA+9 (n=200 / r2=0.92) For forage ME (MJ/kg DM): 0.136*GP+0.0057*CP+ 0.000286*EE2+2.20 (n=200 / r2=0.94)
Table 1. Chemical composition (%) and energy values (MJ/kg DM) of feedstuffs offered to cannulated cows (on DM basis). Dry Crude Ether Crude Crude Nitrogen ME, NEL, FEED Matter Protein Extract Fiber Ash Free Extract MJ/kg MJ/kg
% % % % % % DM DM
Dairy Cattle Feed 90.01 16.02 2.62 9.46 8.15 53.76 10.24 6.66 Alfalfa hay 91.82 14.80 1.82 23.84 12.22 39.14 6.21 3.37
NEL (MJ/kg DM): 0.096*GP+0.0038*CP+ 0.000173* EE2+0.54 (n=200 / r2=0.93)
DOM %: 0.9042*GP+0.0492*CP+0.0387*CA+ 16.49 (n=85 / r2=0.93)
where GP is 24-h net gas production (ml/200 mg DM), and CP, EE, CA, DOM are crude protein, ether extract, crude ash (% DM) and digestibility organic matter, respectively.
Results
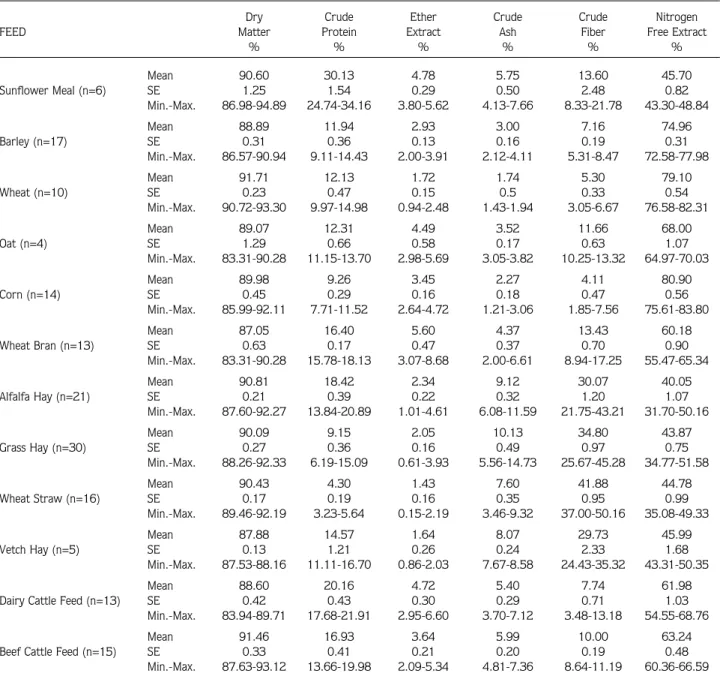
The nutrient composition of different kinds of feeds mostly grown or produced in the Marmara Region is listed on a dry matter basis in Table 2.
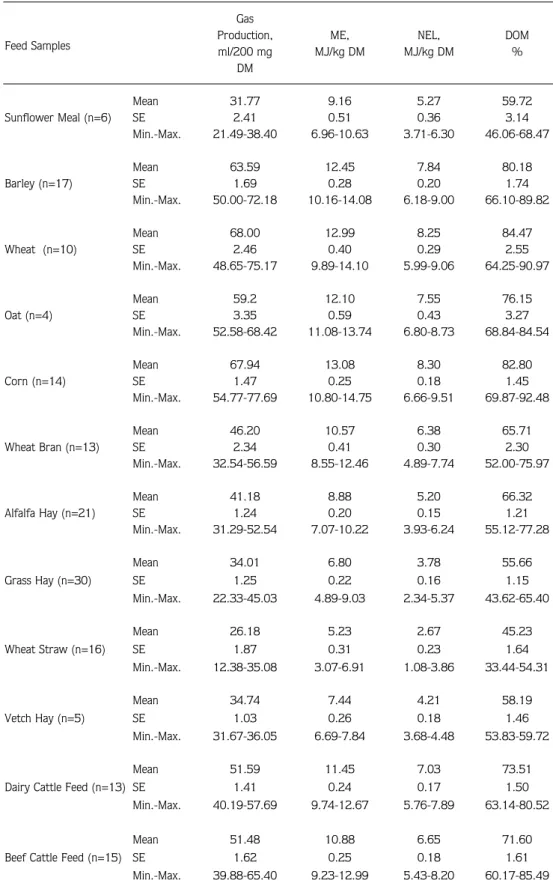
In vitro gas production was obtained after 24 h of incubation. The energy level and digestibility of organic matter of feeds were determined by multivariate regression equations using gas production together with crude nutrient contents. Calculated ME, NEL and DOM are presented in Table 3.
Table 2. Chemical composition of the feed samples, DM %
Dry Crude Ether Crude Crude Nitrogen
FEED Matter Protein Extract Ash Fiber Free Extract
% % % % % % Mean 90.60 30.13 4.78 5.75 13.60 45.70 Sunflower Meal (n=6) SE 1.25 1.54 0.29 0.50 2.48 0.82 Min.-Max. 86.98-94.89 24.74-34.16 3.80-5.62 4.13-7.66 8.33-21.78 43.30-48.84 Mean 88.89 11.94 2.93 3.00 7.16 74.96 Barley (n=17) SE 0.31 0.36 0.13 0.16 0.19 0.31 Min.-Max. 86.57-90.94 9.11-14.43 2.00-3.91 2.12-4.11 5.31-8.47 72.58-77.98 Mean 91.71 12.13 1.72 1.74 5.30 79.10 Wheat (n=10) SE 0.23 0.47 0.15 0.5 0.33 0.54 Min.-Max. 90.72-93.30 9.97-14.98 0.94-2.48 1.43-1.94 3.05-6.67 76.58-82.31 Mean 89.07 12.31 4.49 3.52 11.66 68.00 Oat (n=4) SE 1.29 0.66 0.58 0.17 0.63 1.07 Min.-Max. 83.31-90.28 11.15-13.70 2.98-5.69 3.05-3.82 10.25-13.32 64.97-70.03 Mean 89.98 9.26 3.45 2.27 4.11 80.90 Corn (n=14) SE 0.45 0.29 0.16 0.18 0.47 0.56 Min.-Max. 85.99-92.11 7.71-11.52 2.64-4.72 1.21-3.06 1.85-7.56 75.61-83.80 Mean 87.05 16.40 5.60 4.37 13.43 60.18 Wheat Bran (n=13) SE 0.63 0.17 0.47 0.37 0.70 0.90 Min.-Max. 83.31-90.28 15.78-18.13 3.07-8.68 2.00-6.61 8.94-17.25 55.47-65.34 Mean 90.81 18.42 2.34 9.12 30.07 40.05 Alfalfa Hay (n=21) SE 0.21 0.39 0.22 0.32 1.20 1.07 Min.-Max. 87.60-92.27 13.84-20.89 1.01-4.61 6.08-11.59 21.75-43.21 31.70-50.16 Mean 90.09 9.15 2.05 10.13 34.80 43.87 Grass Hay (n=30) SE 0.27 0.36 0.16 0.49 0.97 0.75 Min.-Max. 88.26-92.33 6.19-15.09 0.61-3.93 5.56-14.73 25.67-45.28 34.77-51.58 Mean 90.43 4.30 1.43 7.60 41.88 44.78 Wheat Straw (n=16) SE 0.17 0.19 0.16 0.35 0.95 0.99 Min.-Max. 89.46-92.19 3.23-5.64 0.15-2.19 3.46-9.32 37.00-50.16 35.08-49.33 Mean 87.88 14.57 1.64 8.07 29.73 45.99 Vetch Hay (n=5) SE 0.13 1.21 0.26 0.24 2.33 1.68 Min.-Max. 87.53-88.16 11.11-16.70 0.86-2.03 7.67-8.58 24.43-35.32 43.31-50.35 Mean 88.60 20.16 4.72 5.40 7.74 61.98
Dairy Cattle Feed (n=13) SE 0.42 0.43 0.30 0.29 0.71 1.03
Min.-Max. 83.94-89.71 17.68-21.91 2.95-6.60 3.70-7.12 3.48-13.18 54.55-68.76
Mean 91.46 16.93 3.64 5.99 10.00 63.24
Beef Cattle Feed (n=15) SE 0.33 0.41 0.21 0.20 0.19 0.48
Table 3. Gas production (at 24 h in vitro incubation) and calculated metabolizable energy (ME), net energy lactation (NEL) and digestible organic matter (DOM) for feed samples.
Gas
Feed Samples Production,ml/200 mg MJ/kg DMME, MJ/kg DMNEL, DOM% DM Mean 31.77 9.16 5.27 59.72 Sunflower Meal (n=6) SE 2.41 0.51 0.36 3.14 Min.-Max. 21.49-38.40 6.96-10.63 3.71-6.30 46.06-68.47 Mean 63.59 12.45 7.84 80.18 Barley (n=17) SE 1.69 0.28 0.20 1.74 Min.-Max. 50.00-72.18 10.16-14.08 6.18-9.00 66.10-89.82 Mean 68.00 12.99 8.25 84.47 Wheat (n=10) SE 2.46 0.40 0.29 2.55 Min.-Max. 48.65-75.17 9.89-14.10 5.99-9.06 64.25-90.97 Mean 59.2 12.10 7.55 76.15 Oat (n=4) SE 3.35 0.59 0.43 3.27 Min.-Max. 52.58-68.42 11.08-13.74 6.80-8.73 68.84-84.54 Mean 67.94 13.08 8.30 82.80 Corn (n=14) SE 1.47 0.25 0.18 1.45 Min.-Max. 54.77-77.69 10.80-14.75 6.66-9.51 69.87-92.48 Mean 46.20 10.57 6.38 65.71 Wheat Bran (n=13) SE 2.34 0.41 0.30 2.30 Min.-Max. 32.54-56.59 8.55-12.46 4.89-7.74 52.00-75.97 Mean 41.18 8.88 5.20 66.32 Alfalfa Hay (n=21) SE 1.24 0.20 0.15 1.21 Min.-Max. 31.29-52.54 7.07-10.22 3.93-6.24 55.12-77.28 Mean 34.01 6.80 3.78 55.66 Grass Hay (n=30) SE 1.25 0.22 0.16 1.15 Min.-Max. 22.33-45.03 4.89-9.03 2.34-5.37 43.62-65.40 Mean 26.18 5.23 2.67 45.23 Wheat Straw (n=16) SE 1.87 0.31 0.23 1.64 Min.-Max. 12.38-35.08 3.07-6.91 1.08-3.86 33.44-54.31 Mean 34.74 7.44 4.21 58.19 Vetch Hay (n=5) SE 1.03 0.26 0.18 1.46 Min.-Max. 31.67-36.05 6.69-7.84 3.68-4.48 53.83-59.72 Mean 51.59 11.45 7.03 73.51
Dairy Cattle Feed (n=13) SE 1.41 0.24 0.17 1.50
Min.-Max. 40.19-57.69 9.74-12.67 5.76-7.89 63.14-80.52
Mean 51.48 10.88 6.65 71.60
Beef Cattle Feed (n=15) SE 1.62 0.25 0.18 1.61
Discussion
The mean values, ranges and standard errors for chemical composition of forage were variable, as shown in Table 2. There were differences among the means of crude protein, ether extract, crude fiber, crude ash and nitrogen free extract. These differences especially between the values of crude protein and crude cellulose were more evident. Crude protein level ranged from 3.23% to 20.89%, and it was found that the highest was for alfalfa (18.42%) and the lowest was for wheat straw (4.30%) in forage. Alfalfa crude protein value was similar to data recorded from previous works (4,19), but was higher than some studies (9,14,15). The crude fiber values of grass hay and wheat straw were much higher than those for the other forage. The level of crude fiber in grass hay averaged 34.80%, and this mean was higher than the data in the literature for hay (9,14,15).
The nutritional values of barley, wheat, corn and oat were also investigated. In these grains, crude protein ranged from 9.26% to 12.30%, ether extract from 1.72% to 4.49%, crude fiber from 4.11% to 11.66% and nitrogen free extract from 68.00% to 80.90% in dry matter. Their nutrient contents were similar to other values reported from our country (14-16), but were lower than those reported in NRC (19).
The nutrient values of forage and grain were found to have wider ranges in this study. Some authors (8,9,11) explained that the discrepancy between the nutrients in the same feed groups was related with climate, irrigation, soil type, manuring, harvest time, and drying and storing conditions.
In the Marmara Region, sunflower meal is commonly used as a protein source in ruminant feeding. Crude protein ratio of sunflower meal ranged from 24.74% to 34.16% with a mean value of 30.13%. This ratio was found lower than similar previous works (8,14). The differences in crude protein contents of sunflower meals are often dependent on different production procedures. In this study, the high levels of crude fiber and ether extract and the low level of crude protein support this hypothesis.
Commercial dairy cows and beef cattle feed were also investigated. In this group, crude protein varied between 13.66% and 21.91%, ether extract 2.09% and 6.60% and crude fiber 3.48% and 13.18%, respectively. These results are parallel with the literature (12,15,20).
Average gas production, NEL, and ME values of forage have a wide range. Net gas production value of forages was found between 12.38 and 52.54 ml/200 mg DM. These findings are similar to the literature on forage showing gas production (4,13-15). ME and NEL values of feeds were estimated by using gas production. ME and NEL contents of forages ranged from 3.07 (wheat straw) to 10.22 (alfalfa) MJ/kg DM and from 1.08 to 6.24 MJ/kg DM, respectively. Estimated NEL and ME values for forages were similar (4,13-15) and were lower than other studies that examined the same parameters (19).
The average gas production of oat, barley, wheat and corn were determined to be 59.20, 63.59, 68.00 and 67.94 ml/200 mg DM, respectively. When compared to some studies (8,13,14,16) net gas production means of oat (50-55 ml/200 mg DM), barley (64-71 ml/200mg DM), wheat (60-73 ml/200mg DM) and corn (60-82 ml/200 mg DM) were in line with this study’s findings.
Gas is produced mainly when carbohydrates of the feedstuffs are fermented to short chain fatty acids. The rate of gas production is associated with the rapid growth phase of microorganism and in a mixed culture system the rate of fermentation will be a result of the interactions between the microorganisms present and the manner in which they digest the particular feed within the system (11). The differences in the net gas production are related to the proportion of fermentable substrate of feeds.
The energy contents of grains were also investigated. Calculated ME and NEL values of corn, wheat, barley and oat by in vitro gas production were 13.08, 12.99, 12.45 and 12.10 MJ/kg DM and 8.30, 8.25, 7.84 and 7.55 MJ/kg DM, respectively. ME and NEL contents of these feeds were similar to data recorded from in vivo works (14,15). At the same time, NEL values were lower than table values of the NRC (19). Energy values in grains are related to their grain formation. A lower predicted energy value for grains might be attributable to an early stage of harvest (8). In this trial, the sample obtained was from newly harvested grains.
In vitro data and energy values of commercial mixed feed are given in Table 3. Net gas production of beef cattle feed and dairy feed are 51.48 ml/200 mg DM and 51.59 ml/200 mg DM. ME and NEL values of these feeds were 9.23-12.99 and 5.43-8.20 MJ/kg DM for beef cattle and 9.74-12.67 and 5.76-7.89MJ/kg DM for dairy cattle feed. Net gas production, ME and NEL values were
in accordance with some studies (12,15,20). Energy content of compound feeds was estimated in a wide range. Variation of energy content in mixed feeds may be due to the ratio of digestible organic matter of raw materials commonly used in the formulation of compound feeds for ruminants.
In this study, the nutrient composition and energy values (ME and NEL) of feedstuffs commonly grown or produced in the Marmara Region were tabulated. The results should help us better understand the nutrition potential of such feedstuffs and provide basic information in ruminant feeding.
References
1. Özpınar, H.: Süt sı¤ırlarının beslenmesi ve rasyon düzenleme tekni¤i. Bayer Veteriner Dergisi, 1993.
2. Cottyn Bc., De Boever, J.L., Vanacker, J.M.: The estimation of nutritive value of dairy cattle feed. Arch. Tierernähr., 1990; 40: 969-980.
3. Getachew, G., Blümmel, M., Makkar, H.P.S., Becker, K.: In vitro gas measuring techniques for assessment of nutritional quality of feeds: a review. Anim. Feed Sci. Technol., 1998; 72: 261-281. 4. Iantcheva, N., Steingass, H., Todorov, N., Pavlov, D.: A
comparison of in vitro rumen fluid and enzymatic methods to predict digestibility and energy value of grass and alfalfa hay. Anim. Feed Sci. Technol., 1999; 81: 333-344.
5. Tilley, J.M.A., Terry, R.A.A.: A two-stage technique for the in vitro digestion of forage corps. Nutrition Abst. Rew. Ser. B., 1964; 34: 33.
6. Menke, K.H., Raab, L., Salewski, A., Steingass H., Fritz D., Schneider, W.: The estimation of the digestibility and metabolizable energy content of ruminant feedingstuffs from the gas production when they are incubated with rumen liquor in vitro. J. Agric. Sci. Camb., 1979; 93: 217-222
7. Menke, K.H., Steingass, H.: Schätzung des energetischen Futterwerts aus der in vitro mit Pansensaft bestimmten Gasbildung und der chemischen Analyse. II. Regressionsgleichungen. Übers. Tierernährg., 1987; 15: 59-94. 8. Krishnamoorthy, U., Soller, H., Steingass, H., Menke, K.H.:
Energy and protein evaluation of tropical feedstuffs for whole tract and ruminal digestion by chemical analyses and rumen inoculum studies in vitro. Anim. Feed Sci. Technol., 1995; 52: 177-188.
9. Lee, M.J., Hwang, S., Wen-Shyg Chiou, P.: Metabolizable energy of roughage in Taiwan. Small Rum. Res., 2000; 36: 251-259. 10. Aiple, K.I., Steingass, H., Menke, K.H.: Suitability of a buffered
faecal suspension as the inoculum in the Hohenheim gas test. I. Modification of method and its ability in the prediction of organic matter digestibility and metabolizable energy content of ruminant feeds compared with rumen fluid as inoculum. J. Anim. Physiol. Anim. Nutr., 1992; 67: 57-66.
11. Mauricio, R., Owen, E., Mould, F.L., Givens, I., Teodorou, M.K., France, J., Davies, D.R., Dhanoa, M.S.: Comparison of bovine rumen liquor and bovine faeces as inoculum for an in vitro gas production technique for evaluating forages. Anim. Feed Sci. Technol., 2001; 89: 33-48.
12. Aiple, K.I., Steingass, H., Drochner W.: Prediction of the net energy content of raw materials and compound feeds for ruminants by different laboratory methods. Arch. Tierernähr., 1996; 49: 213-220.
13. Getachew, G., Crovetto, G.M., Fondevila M., Krishnamoorty, U., Singh, B., Spanghero, M., Steingass, H., Robinson, P.H., Kailas, M.M.: Laboratory variation of 24 h in vitro gas production and estimated metabolizable energy values of ruminant feeds. Anim. Feed Sci. Technol., 2002; 102: 169-180.
14. Ö¤retmen, T.: Gevifl getirenlerin beslenmesinde kullanılan önemli bazı yemlerin NEL içeriklerinin in vivo ve in vitro yöntemleri ile saptanması. Doktora Tezi, Ege Üniversitesi Fen Bilimleri Enstitüsü, ‹zmir, 1991.
15. fieker, E.: The determination of the energy values of some ruminant feeds by using digestibility trial and gas test. Revue Méd. Vét., 2002; 153: 323-328.
16. Umacalılar, H.D., Coflkun, B., Gülflen, N.: In situ rumen degradation and in vitro gas production of some selected grains from Turkey. J. Anim. Physiol. Anim. Nutr., 2002; 86: 288-297. 17. AOAC.: Official methods of analysis, 14th ed., Association of
Official Agricultural Chemist., Washington D.C., 1984.
18. Steingass, H., Menke, K.H.: Schätzung des energetischen Futterwertes aus der in vitro mit Pansensaft bestimmten Gasbildung der chemischen Analyse. 1. Untersuchungen zur methode. Übers. Tierernährg., 1986; 14: 251-270.
19. National Research Council: Nutrient requirements of Dairy Cattle. 7threv. ed. National Academy Press Washington D.C., 2001. 20. Yönetmelik: Yem Yönetmeli¤inde De¤ifliklik Yapılmasına Dair
Yönetmelik: Karar Sayısı: 2001/2039, Resmi Gazete, 01.03.2001, Sayı: 24336, 2001.