Solid State Communications, Vol. 105, No. I, pp. 21-24, 1998 0 1997 Elsevier Science Ltd Printed in Great Britain. All rights reserved 003%1098/98 $19.00+.00
PII:
SOO38-1098(97)10027-8
LOW-TEMPERATURE PHOTOLUMINESCENCE SPECTRA OF LAYERED SEMICONDUCTOR TlGa!& N.M Gasamy,“,” A. Aydinli,b A. Bekb and I. Yilmaz”
‘Physics Department, Middle East Technical University, 06531 Ankara, Turkey bPhysics Department, Bilkent University, 06533 Ankara, Turkey
(Received 27 June 1997; accepted 5 September 1997 by G. Bastard)
Photoluminescence (PL) spectra of TlGa& layered single crystals were studied in the wavelength region 500-860 nm and in the temperature range 9.5-293 K. We observed a total of three PL bands centered at 568 nm (2.183 eV, A-band), 718 nm (1.727 eV, B-band) and 780 nm (1.590 eV, C-band) at various temperatures. We have also studied the variations of the A- and B-band intensities vs excitation laser density in the range from 7 X 10e2 to 9 W cm-‘. The A- and B-bands were found to be due to radiative transitions from the deep donor levels located at 0.362 and 0.738 eV below the bottom of the conduction band to the shallow acceptor levels at 0.005 and 0.085 eV located above the top of the valence band, respectively. The proposed energy-level diagram permits us to interpret the recombination processes in TlGa& layered single crystals. 0 1997 Elsevier Science Ltd
Keywords: A. semiconductors, D. optical properties, E. luminescence.
1. INTRODUCTION
For the last few years there has been considerable interest in the investigation of the physical properties of layered ternary crystals with chemical formula T1BX2, where B = Ga or In and X = S or Se [l]. The lattice of TlBX*- type crystals consists of alternating two-dimensional layers arranged parallel to the (0 0 1) plane [2]. Each successive layer is turned through a right angle relative to the preceding one. The fundamental structural unit of a layer is the BaIO polyhedron representing a combina- tion of four elementary BX4 tetrahedra linked together by bridging X atoms. The Tl atoms are in trigonal prismatic voids resulting from the combination of the B&r0 polyhedra into a layer. The Tl atoms form nearly planar chains along the [l 1 01 and [l 1 0] directions. These crystals are characterized by clearly defined anisotropy in their mechanical properties.
T1GaS2, which is a member of this class of crystals, is a semiconductor with an indirect band gap of about 2.46 eV at room temperature [3]. In view of its possible applications in optoelectronic devices in the visible
* On leave from Physics Department, Baku State University, Baku, Azerbaijan.
range, a great deal of attention has been devoted to the study of the optical and electrical properties of T1GaS2 [3-81. In this regard, detailed information on the impurity levels is very useful for the fabrication of high-quality devices. Abutalybov et al. [4] have reported the existence of a fine structure in the PL spectra of a T1GaS2 in the temperature range 1.8-77 K. It was found that the PL lines in the long-wavelength part of the spectrum (595-610 run) were separated by -0.5 eV from the direct edge exciton absorption peak and were due to recombination of bound excitons. Abdullaeva et al. [5] have observed two broad emission bands in PL spectra of TlGa& at T = 6 K due to impurity level-to- band radiative transitions at 499 and 590 nm. Song et al. [6] have investigated the impurity levels of TlGaS2 crystals in the temperature range 90-350 K by thermally stimulated current and photoinduced current transient spectroscopy techniques. The activation energies of the observed four peaks were found to be 0.18, 0.23, 0.36 and 0.66 eV. However, there has yet been no systematic study on the impurity levels of TlGaS? single crystals.
In the present paper, we report the results of investiga- tion of the PL spectra of TlGaS* single crystals in the wavelength region 500-860 nm and in the temperature 21
22 SPECTRA OF LAYERED SEMICONDUCTOR TlGa& range 9.5-293 K. We discuss the recombination
mechanisms of the radiative centers deduced from the temperature and excitation density dependence of the PL intensity.
Vol. 105, No. 1
a
B
I2. EXPERIMENTAL
TlGa!& polycrystals were synthesized from particular high-purity elements (at least 99.999%) taken in stoichiometric proportions. Single crystals of TlGaS2 were grown by the modified Bridgman method. The X-ray diffraction patterns show that these crystals have monoclinic structure with the lattice parameters a = 1.031, b = 1.043, c = 1.507 nm and 6 = 99.60’.
Crystals suitable for measurements were obtained by easy cleavage along the (0 0 1) plane perpendicular to the optical c-axis. In the PL measurements, samples of a typical size 8 X 4 X 2 mm3 were used. All the samples studied were p-type as determined by the hot probe method. The photoluminescence, excited by the 476.5 nm line of a Spectra-Physics argon ion laser, was investigated from the side of the laser-illuminated surface of the samples in a direction close to the normal of the (0 0 1) plane. A “CTI-Cryogenics M-22” closed-cycle helium cryostat was used to cool the crystals from room temperature down to 9.5 K. The temperature was controlled within an accuracy of LO.5 K. The PL spectra in the wavelength range 500-860 nm were analyzed using a U-1000 “Jobin Yvon” double grating spectrometer and a cooled GaAs photomultiplier supplied with the necessary photon counting electronics. A set of neutral-density filters changed the excitation density of the laser beam in the range from 7 X lo-* to 9 W cm-*.
3. RESULTS AND DISCUSSION
The typical PL spectra of TlGaS* single crystals are shown in Fig. 1 for various temperatures (9.5-200 K) in the wavelength region 500-860 nm at constant excitation density of 9 W cm-‘. We observed two bands centered at 568 nm (2.183 eV, A-band) and 718 nm (1.727 eV, B-band) in the PL spectrum at 9.5 K. The A- and B-bands show that their intensities and positions change with respect to temperature. In the temperature range of 9.5-90 K, the intensity of the B-band increases, while the intensity of the A-band decreases. For T > 90 K, when the A-band becomes very weak, the intensity of the B-band decreases drastically as the temperature increases. At T > 110 K, a new broad C-band appears in PL spectra of TlGaS2 crystals. This band is weaker than the other two bands and is located in the near infrared region of the spectra
60 2 I I , I 500 600 700 600
Wavelength (nm)
1 - 9OK -100 -110 -120 -130 -140 -150 500 600 700 600Wavelength (nm)
starting from 650 nm and extending beyond 860 nm, Fig. 1. Photoluminescence spectra of TlGaS2 in the which is the limit of our detection range. Due to these temperature range 9.5-60 K (a) and 90-200 K (b).
Vol. 105, No. 1
SPECTRA OF LAYERED SEMICONDUCTOR TlGaS 2
23
reasons, we did not carry out a detailed study of this
band. However, from the measured spectral shape of the
band, we infer that it is centered approximately at
780 nm (1.59 eV>. The increase of C-band intensity
with rising temperature, accompanied by decrease of
B-band intensity, continues up to 150 K. Further increase
of temperature results in gradual decrease of C-band
intensity up to 293 K.
The peak position of A-band displays the red shift
with increasing temperature, whereas that of B-band
shows the blue shift. Since the temperature coefficient
of the energy gap of TlGa& crystals is negative [3, 71,
the peak energy due to donor-acceptor transition should
decrease with band gap energy as the temperature
increases [9]. The peak energy shift of the A-band
satisfies the temperature dependence expected for the
donor-acceptor pair recombination. On the other hand,
the peak energy shift of the B-band in the temperature
range 9.5-90 K, when the redistribution of intensities
between A- and B-bands is observed, is rather high
dErn/dT = 9.3 X 10e4 eV K-l.
In contrast, in the
temperature range 100-200 K when, after the disappear-
ing of the A-band, the intensity of the B-band decreases
with increasing temperature, the shift in peak energy is
almost imperceptible. This unusual blue shift of the
B-band is not understood at this time and requires further
investigation.
The
experimental
data
for
the
temperature
dependences of A- and B-band intensities can be fitted
by the following expression
I CC
exp
(AEIkT),where
AEis the thermal activation energy and
kis the
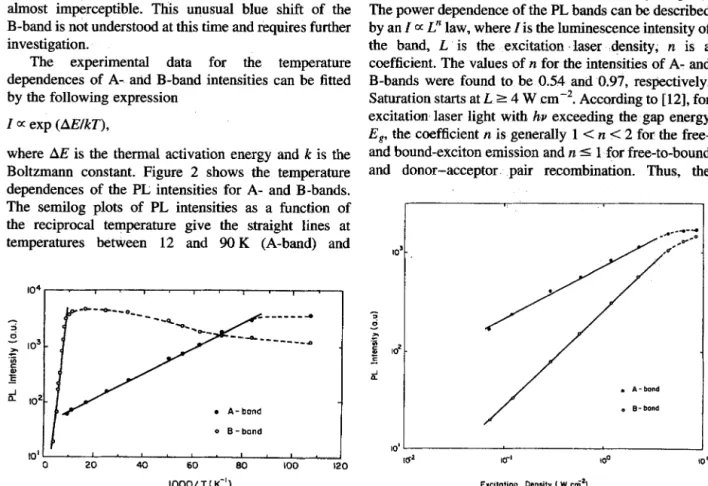
Boltzmann constant. Figure 2 shows the temperature
dependences of the PL intensities for A- and B-bands.
The semilog plots of PL intensities as a function of
the reciprocal temperature give the straight lines at
temperatures between 12 and 90 K (A-band) and
. A-bond o B-bond
10’1. ’ . ’ ’ ’ . ’ ’ 1 * I
0 20 40 60 80 IO0 120
lOOO/T(K-‘1
Fig. 2. Temperature dependences of PL peak intensities
of the A- and B-bands.
Fig. 3. Dependences of PL peak intensities of the A- and
B-bands vs excitation density at
T =14 K.
between 110 and 250 K (B-band). The activation
energies
EiA =0.005 eV and
EiB =0.085 eV for A-
and B-bands, respectively, are derived from the slopes
of straight lines. Since TlGa& crystal is a
p-typesemi-
conductor, we consider that the impurity levels are
the acceptor levels at 0.005 eV (a,) and 0.085 eV (a~)
above the top of the valence band. Shallow acceptor
levels a
1and u2 in undoped TlGaS2 crystal may be
associated with the presence of uncontrolled impurities.
Since the values of
EUand
EiB aremuch smaller than
the energy differences between the band gap of TlGaS2
(Eg =
2.55 eV at 9.5 K) and the spectral positions of the
A-emission peak
EPA (Eg -EPA =0.367 eV %
EiA =0.005 eV) and B-emission
peak E,s
(Eg - EpB =0.823 eV +
EiB =0.085 eV), we believe that the A-
and B-emission bands arise from the donor-acceptor
pair recombination. Two deep donor levels at 0.362 eV
(dr) and 0.738 eV (d2) below the bottom of the conduc-
tion band in p-T1GaS2 layered crystal may be linked to
the stacking faults which are due to the weak interlayer
interactions. Similarly, deep donor levels were also
revealed in p-GaSe layered crystal [ 10, 111.
We have also studied the variations of the A- and
B-band intensities vs excitation laser density (Fig. 3).
The power dependence of the PL bands can be described
by an I 0:
L”law, where I is the luminescence intensity of
the band,
Lis the excitation laser density; n is a
coefficient. The values of n for the intensities of A- and
B-bands were found to be 0.54 and 0.97, respectively.
Saturation starts at
L 24 W cmT2. According to [ 121, for
excitation laser light with hv exceeding the gap energy
E,,
the coefficient n is generally 1 C it < 2 for the free-
and bound-exciton emission and n I 1 for free-to-bound
and donor-acceptor
pair recombination. Thus, the
24 SPECTRA OF LAYERED SEMICONDUCTOR TlGa& Vol. 105, No. 1 2.550 2.188 1.812
F
J6
&6
CONDUCTION BAND ; : 0.362 ! 0.738 4 d2 A (2.183 eV) 8 ( 1.727eV)va2
aI VALENCE BANDFig. 4. Energy-level diagram of TlGa& at T = 9.5 K. obtained values of n confirm our assignment of the observed PL lines in TlGaS2 spectra to donor-acceptor pair recombination. In the case of GaSe and InS layered crystals, the values of n for various bands were found to change in the range from 0.5 to 1 .O [ 10, 131. The A- and B-bands shift slightly towards higher energies with increasing excitation density, which is a characteristic for donor-acceptor pair recombination [ 141.
The analysis of the spectra as a function of temperature and excitation density allows one to obtain a possible scheme for the donor-acceptor levels located in the forbidden energy gap of TIGaSz and involved in the radiative recombination observed in this work (Fig. 4). In the proposed scheme two shallow acceptor levels a, and a2 located at 0.005 and 0.085 eV above the top of the valence band, respectively, are presented. From the observation of two PL bands, two deep donor levels d, and d2 located at 0.362 and 0.738 eV below the bottom of the conduction band are introduced into the forbidden band gap of TlGaS2. Now the A- and B-bands can be explained by assuming radiative transitions from the donor level d I to the acceptor level a 1 located at 0.005 eV above the top of the valence band (A-band) and
from the donor level d2 to the acceptor a2 located at 0.085 eV above the top of the valence band (B-band).
This diagram permits us to explain the thermal quenching behavior of PL bands in TlGaS2 crystal, where the intensity of the B-band increases in the same temperature range (9.5-90 K) in which the quenching of the A-band is observed. Quenching of the A-band may be associated with the thermal release of holes from the acceptor level al to the valence band. The thermally released holes are then captured by the acceptor level ~2. Finally, this results in the increase of the intensity of the B-band in the same temperature range where quenching of the A-band occurs.
1. 2. 3. 4. 5. 6. 7. 8. 9. 10. 11. 12. 13. 14. REFERENCES
Yee, K.A. and Albright, A., J. Am. Chem. Sue., 113, 1991,6474.
Muller, D. and Hahn, H., Z Anorg. A&. Chem., 438,1978,258.
Bakhyshov, A.E., Lebedev, A.A., Khalafov, Z.D. and Yakobson, M.A., Sov. Phys. Semicond., 12, 1978,320.
Abutalybov, G.I. and Salaev, E.Yu., Sov. Phys. Solid State, 28, 1986, 1231.
Abdullaeva, S.G., Mamedov, N.T., Mustafaev, F.A. and Salaev, E.Yu., Phys. Status Solidi (a), 82,1984, K75.
Song, H.J., Yun, S.H. and Kim, W.T., Solid State Commun., 94, 1995,225.
Hanias, M.P., Anagnostopoulos, A.N., Kambas, K. and Spyridelis, J., Mat. Res. Bull., 27, 1992, 25. Kalkan, N., Kalomiros, J.A., Hanias, M. and Anagnostopoulos, A.N., Solid State Commun., 99,
1996, 375.
Shigetomi, S., Ikari, T. and Nakashima, H., Phys. Status Solidi (a), 156, 1996, K2 1.
Capozzi, V., Phys. Rev., B28, 1983, 4620. Shigetomi, S., Ikari, T. and Nishimura, H., J. Appl.
Phys., 69, 1991, 7936.
Schmidt, T., Lischka, K. and Zulehner, W., Phys.
Rev., B45, 1992, 8989.
Gasanly, N.M. and Aydinli, A., Solid State Commun., 101, 1997,797.
Pankove, J-I., Optical Processes in Semi- conductors. Prentice-Hall, New Jersey, 1975.