PHOTOCATALYTIC
NANOCOMPOSITES FOR
INCREASED OPTICAL ACTIVITY
A THESIS
SUBMITTED TO THE DEPARTMENT OF PHYSICS AND THE INSTITUTE OF ENGINEERING AND SCIENCES
OF BILKENT UNIVERSITY
IN PARTIAL FULLFILMENT OF THE REQUIREMENTS FOR THE DEGREE OF
MASTER OF SCIENCE
By
Sümeyra Tek
January 2008
I certify that I have read this thesis and that in my opinion it is fully adequate, in scope and in quality, as a thesis for the degree of Master of Science.
Assist. Prof. Dr. Hilmi Volkan Demir (Supervisor)
I certify that I have read this thesis and that in my opinion it is fully adequate, in scope and in quality, as a thesis for the degree of Master of Science.
Assist. Prof. Dr. Tuğrul Senger
I certify that I have read this thesis and that in my opinion it is fully adequate, in scope and in quality, as a thesis for the degree of Master of Science.
Assist. Prof. Dr. Dönüş Tuncel
Approved for the Institute of Engineering and Sciences:
Prof. Dr. Mehmet B. Baray
ABSTRACT
PHOTOCATALYTIC NANOCOMPOSITES
FOR INCREASED OPTICAL ACTIVITY
Sümeyra Tek M.S. in Physics
Supervisor: Assist. Prof. Dr. Hilmi Volkan Demir January 2008
To combat environmental pollution, photocatalytic decomposition provides degradation of organic and inorganic contaminants near the surface of the photocatalyst nanoparticles by converting optical energy of the absorbed light into chemical energy for the redox reactions. However, photocatalytic activities of such semiconductor metal-oxide nanoparticles are limited with their bandgap energy that allows for optical absorption typically in the ultraviolet spectral range. Yet another limitation is that the photocatalytic activity of these semiconductor nanoparticles is substantially reduced when they are immobilized in solid thin films, resulting from their effectively decreased active surface area. But such immobilized nanoparticles are much more desired in industrial applications, e.g., for mass environmental decontamination and outdoors/indoors self-cleaning on large surfaces. To address these issues, in this thesis, we investigated and demonstrated the spectral behavior and time evolution of optical activity curves of immobilized TiO2 and ZnO nanoparticles. We studied the nanoparticle size effect for the optical activity and demonstrated significant increase in the resulting photocatalysis with decreasing the size of such
maximum optical recovery levels of 93% for TiO2 nanoparticles and 55% for ZnO nanoparticles at the excitation wavelengths of 310 nm and 290 nm, respectively, after optical irradiation with an excitation density of 7.3 J/cm2, where we observed no optical recovery for their respective negative control groups (with no nanoparticles). In these comparative spectral studies, we showed strong correlation between the differential optical recovery and the photocatalytic activity. For further substantial enhancement in the near ultraviolet and visible spectral ranges, we also proposed and demonstrated the use of a unique combination of TiO2-ZnO nanoparticles integrated together into the same resin. In this novel approach, we observed higher levels of photocatalytic activity under optical irradiation at and above 380 nm compared to the cases of only TiO2 or only ZnO nanocomposite films with the same total metal-oxide nanoparticle density. At 400 nm in the visible, we accomplished an optical recovery level of ~30% with the combination of TiO2-ZnO nanoparticles together while this level was only ~14% for the TiO2 nanoparticles alone and ~3% for the ZnO nanoparticles alone under identical conditions. Even at 440 nm, we obtained ~20% optical recovery using the TiO2-ZnO photocatalytic synergy, despite the optical activity of the single type of nanoparticles alone close to the zero base-line of their control group. These proof-of-concept experimental demonstrations indicate that such TiO2-ZnO combined nanocomposite films hold great promise for efficient environmental decontamination in daylight.
Keywords: Nanoparticles, nanocomposite films, TiO2, ZnO; optical recovery, ultraviolet, visible; photocatalytic synergy; photocatalysis, environmental decontamination.
ÖZET
ARTIRILMIŞ OPTİK ETKİNLİK İÇİN
FOTOKATALİTİK NANOKOMPOZİTLER
Sümeyra Tek
Fizik Bölümü Yüksek Lisans
Tez Yöneticisi: Yrd. Doç. Dr. Hilmi Volkan Demir Ocak 2008
Çevre kirliliği ile mücadele etmek için, fotokatalitik ayrıştırma fotokatalizör nanoparçacıklarının soğurdukları ışığın optik enerjisini redoks tepkimelerinde kullanılmak üzere kimyasal enerjiye çevirerek yüzeylerinin yakınındaki organik ve inorganik birikintilerin parçalamasını sağlar. Ancak, bu yarı-iletken metal-oksit nanoparçacıkların fotokatalitik etkinlikleri, yasak enerji aralıklarının sadece mor ötesi ışık tayfında optik soğurmaya izin vermesiyle sınırlanmaktadır. Başka bir sınırlama da bu nanoparçacıkların katı ince bir film içerisine sabitlendiklerinde toplam aktif yüzey alanındaki ciddi azalmaya bağlı olarak fotokatalitik etkinliklerinin ciddi bir şekilde düşmesidir. Fakat bu türden sabitlenmiş nanoparçacıklar endüstriyel uygulamalarda (örneğin, geniş çaptaki çevresel temizlenme ve geniş yüzeylerin kendiliğinden iç/dış temizlenmelerinde) çok daha caziptir. Bu konuları hedef alarak, bu tezde, sabitlenmiş TiO2 ve ZnO nanoparçacıklarının optik etkinlik eğrilerinin spektral davranışlarını ve zamanla olan gelişimlerini inceledik ve gösterdik. Optik etkinlikte nanoparçacık boyutunun etkisini çalıştık. Sabitlenmiş nanoparçacıkların boyutunun küçültülmesiyle fotokatalizde meydana gelen ciddi artışı ilk defa gösterdik. TiO2 ve ZnO nanokompozit filmlerinin herbiri için ayrı ayrı optimal uyarma koşullarını elde ettik. 7.3 J/cm2 uyarma yoğunluğundaki
ZnO nanoparçacıkları için %55 maksimum optik geri kazanımlara ulaştık. TiO2 ve ZnO için maksimum optik geri kazanımları sırasıyla 310 nm ve 290 nm uyarılma dalgaboylarında elde ettik. Aynı optik uyarılma neticesinde ise, nanoparçacık içermeyen negatif kontrol gurubunda herhangi bir optik geri kazanım gözlenmedi. Bu spektral karşılaştırmalı çalışmalarımızda, diferansiyel optik geri kazanım ve fotokatalitik etkinlik arasında güçlü bir uyumluluk gözlendi. Yakın mor ötesi ve görünür bölge tayfında fotokatalitik etkinliğin artırılması için TiO2-ZnO nanoparçacıklarının tek bir kombinasyonunun aynı reçine içine entegrasyonunu önerdik ve deneysel olarak gösterdik. Bu alışılmamış yaklaşımla, 380 nm ve üzerindeki uyarılma dalgaboylarında, aynı toplam metal-oksit nanoparçacık konsantrasyonuna sahip sadece TiO2 ve sadece ZnO nanokompozit filmlerine nazaran daha yüksek değerlerde fotokatalitik etkinlik gözlemledik. Sadece TiO2 içeren nanokompozit film için %14 ve sadece ZnO içeren nanokompozit film için %3 optik geri kazanım değerlerinin elde edildiği görünür bölge 400 nm uyarılma dalgaboyunda TiO2-ZnO nanoparçacık kombinasyonuyla aynı şartlarda %30 civarında optik geri kazanım sağladık. TiO2-ZnO fotokatalitik sinerji etkisi sayesinde tek tip nanoparçacık filmlerinin optik etkinliğinin fotokatalizör kullanılmayan kontrol filminin sıfır tabanına yakın olduğu 440 nm uyarılma dalgaboyunda dahi %20’lere varan optik geri kazanım elde ettik. İlk deneysel ispatı olan bu sonuçlar, TiO2-ZnO birlikte olduğu nanokompozit filmlerinin güneş ışığında verimli fotokatalitik çevresel temizlenme için kullanımını gösteriyor.
Anahtar Sözcükler: Nanoparçacıklar, nanokompozit film, TiO2, ZnO; optik geri kazanım, mor ötesi, görünür bölge; fotokatalitik sinerji; fotokataliz, çevresel temizlenme.
Acknowledgements
I would like to express my deepest appreciation to my supervisor, Asst. Prof. Dr. Hilmi Volkan Demir for his motivation and technical support since my
undergraduate years. I am greatly indebted to his assistance and understanding in matters of non-academic social life related concerns in addition to his scientific guidance and encouragement at all stages of my work.
I would also like to thank my committee members, Assist. Professor Dr. Tuğrul Senger and Assist. Professor Dr. Dönüş Tuncel, for their valuable comments and suggestions.
I would like to extend my thanks to our research partners, Gülsen Çeliker and Dilek Yücel, from DYO for providing samples, useful discussions, and great hospitality during my internship at DYO in Izmir.
I would like to thank İbrahim Murat Soğancı, Evren Mutlugün, İlkem Özge Huyal and Dr. Nihan Kosku Perkgöz for their contributions to this thesis and being very good friends of mine.
I would also like to acknowledge Prof. Dr. Ekmel Özbay for the facilities that we share at Nanotechnology Research Center. I would like to thank Advanced Research Laboratory researchers and staff, especially Murat Güre and Ergün Karaman.
I would like to thank Demir Group members for their great friendship: Sedat Nizamoğlu, Tuncay Özel, Rohat Melik, Can Uran, Emre Sarı, Aslı Koç, Emre Ünal, Gülis Zengin and Özgün Akyüz.
I would like to thank my home-mate Özlem Yeşilyurt, and my friends from Physics Department: Selcen Aytekin, Sinem Binicioğlu Çetiner, Ceyda Sanlı,
My greatest gratitude goes to all my family: my parents, my sisters, especially Zeynep Betül, and my parents-in-law for all their support.
Finally, I would like to thank my love Süleyman for his understanding, encouragement, and endless love; he is always there where I need him. This thesis is dedicated to him.
Table of Contents
ACKNOWLEDGEMENTS………..VII
1 INTRODUCTION...1
2 BACKGROUND ON PHOTOCATALYSIS...4
2.1Photocatalysts..…...4
2.2 Process underlying behind photocatalysis……….4
2.3 Early studies in photocatalysis………...8
2.4 Parameters affecting photocatalysis: adsorption, intensity of light, pH, size, surface properties, and activation wavelength….………..10
2.5 Nanosized materials...11
2.6 Nanoparticle semiconductors in photocatalysis (surface area, bandgap properties, absorption)...12
2.7 TiO2 and ZnO nanoparticles...13
2.8 Immobilization in thin films...14
3 OUR EXPERIMENTAL RESULTS…………...16
3.1 Photocatalytic recovery levels... ...17
3.2 Size effect... ....19
3.3 Effect of recontamination and reactivation... ….24
3.4 Activation wavelength... ….26
3.4.1 Optical spectral response of ZnO (150 nm in size)……….27
3.5 Comparative study of TiO2 and ZnO nanocomposite films... …28
3.6 Combination of TiO2-ZnO nanoparticles chemically integrated into acrylic for enhanced photocatalytic activity in the near-UV and the visible……….31
3.6.1 Activations in the ultra violet and the visible…..……… …33
3.6.2 Photocatalytic synergy effect of TiO2-ZnO combined nanocomposite film………….56
List of Figures
Figure 2.2.1 Schematic photoexcitation of the semiconductor photocatalyst and the following redox reactions………6
Figure 2.3.1 Glass covers on tunnel lighting lamps contaminated by automobile exhaust without TiO2 and maintained clean with TiO2 coating (after
[21])………...9
Figure 3.1.1 Photograph of TiO2 nanocomposite film first contaminated with metylene blue and then exposed to UV irradiation…………...………17
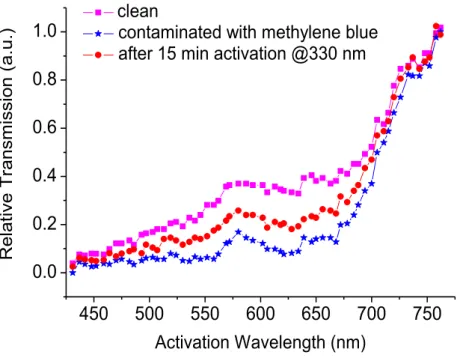
Figure 3.1.2 Optical transmission spectra of TiO2 nanocomposite film when it is clean, contaminated with metylene blue and activated with UV light…………19
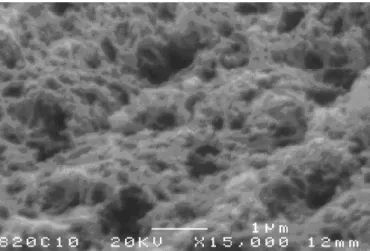
Figure 3.2.1 SEM image of our photocatalytic nanocomposites that
nanoparticles are integrated into their three-dimensional solgel matrices …….20
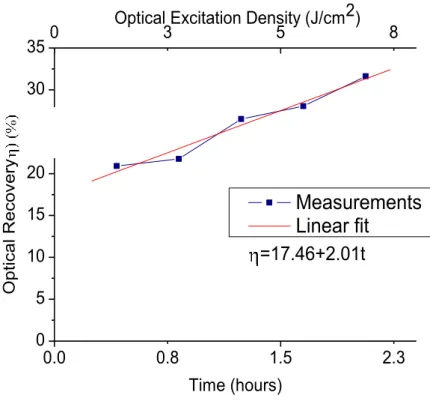
Figure 3.2.2 Optical recovery levels for titanium dioxide nanoparticles (6 nm in diameter) in the early phase of optical excitation process.………..21
Figure 3.2.3 Optical recovery levels of titanium dioxide nanocomposite films with nanoparticle sizes of 6 nm and 21 nm…………...……….…….22
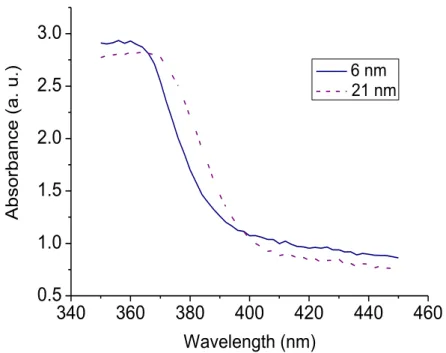
Figure 3.2.4 Absorbance spectra of the TiO2 nanocomposite films with
nanoparticle sizes of 6 nm and 21 nm in diameter…………...…………...……23
Figure 3.2.5 Optical transmission spectra of acrylic film for control experiment; contaminated with methylene blue and activated under UV light at 330 nm with excitation density ranging from 9.5 J/cm2 up to 47.5 J/cm2……….…...24
Figure 3.3.1 Optical recovery levels of TiO2 nanocomposite film with nanoparticle diameter of 6 nm after it is photocatalytically self-cleaned from methylene blue.….………...25
Figure 3.3.2 Optical recovery levels of TiO2 nanocomposite film with
methylene blue, contaminated again, and photocatalytically reactivated at the same wavelength………...………26
Figure 3.4.1.1 Optical recovery levels achieved at the end of 8 hours activation (7.3 J/cm2) at different wavelengths ranging from 270 nm to 370 nm………...27
Figure 3.5.1 TEM image of the prepared sol-gel…………...28
Figure 3.5.2 Relative spectral photocatalyic recovery levels of TiO2 and ZnO nanocomposite films at monochromatic activation wavelengths (270-370 nm) as a function of incident total optical excitation density (incident optical intensity x time)………...30
Figure 3.6.1.1 Optical transmission spectra of the films consisting of (a) TiO2 -ZnO combined nanocomposite, (b) only TiO2,and(c) only ZnO nanocomposites before and after they are contaminated with methylene blue, and after they are photocatalytically activated at 330 nm keeping the total number of incident activation photons per unit area ([activation power x time] / [spot size x photon energy] constant at 1022 m-2 along with (d) the host resin without any
nanoparticles as the control group.………...35
Figure 3.6.1.2 Optical transmission spectra of the films consisting of (a) TiO2 -ZnO combined nanocomposite, (b) only TiO2,and(c) only ZnO nanocomposites before and after they are contaminated with methylene blue, and after they are photocatalytically activated at 403 nm keeping the total number of incident activation photons per unit area ([activation power x time] / [spot size x photon energy] constant at 1022 m-2 along with (d) the host resin without any
nanoparticles as the control group.………..…………37
Figure 3.6.1.3 Optical transmission spectra of the films consisting of (a) TiO2 -ZnO combined nanocomposite, (b) only TiO2,and(c) only ZnO nanocomposites before and after they are contaminated with methylene blue, and after they are photocatalytically activated at 310 nm keeping the total number of incident activation photons per unit area ([activation power x time] / [spot size x photon energy] constant at 1022 m-2 along with (d) the host resin without any
nanoparticles as the control group.………..………39
-activation photons per unit area ([-activation power x time] / [spot size x photon energy] constant at 1022 m-2 along with (d) the host resin without any
nanoparticles as the control group.………..……...41
Figure 3.6.1.5 Optical transmission spectra of the films consisting of (a) TiO2 -ZnO combined nanocomposite, (b) only TiO2,and(c) only ZnO nanocomposites before and after they are contaminated with methylene blue, and after they are photocatalytically activated at 350 nm keeping the total number of incident activation photons per unit area ([activation power x time] / [spot size x photon energy] constant at 1022 m-2 along with (d) the host resin without any
nanoparticles as the control group.………..………43
Figure 3.6.1.6 Optical transmission spectra of the films consisting of (a) TiO2 -ZnO combined nanocomposite, (b) only TiO2,and(c) only ZnO nanocomposites before and after they are contaminated with methylene blue, and after they are photocatalytically activated at 370 nm keeping the total number of incident activation photons per unit area ([activation power x time] / [spot size x photon energy] constant at 1022 m-2 along with (d) the host resin without any
nanoparticles as the control group………...45
Figure 3.6.1.7 Optical transmission spectra of the films consisting of (a) TiO2 -ZnO combined nanocomposite, (b) only TiO2,and(c) only ZnO nanocomposites before and after they are contaminated with methylene blue, and after they are photocatalytically activated at 393 nm keeping the total number of incident activation photons per unit area ([activation power x time] / [spot size x photon energy] constant at 1022 m-2 along with (d) the host resin without any
nanoparticles as the control group………...47
Figure 3.6.1.8 Optical transmission spectra of the films consisting of (a) TiO2 -ZnO combined nanocomposite, (b) only TiO2,and(c) only ZnO nanocomposites before and after they are contaminated with methylene blue, and after they are photocatalytically activated at 416 nm keeping the total number of incident activation photons per unit area ([activation power x time] / [spot size x photon energy] constant at 1022 m-2 along with (d) the host resin without any
nanoparticles as the control group………..……….49
Figure 3.6.1.9 Optical transmission spectra of the films consisting of (a) TiO2 -ZnO combined nanocomposite, (b) only TiO2,and(c) only ZnO nanocomposites before and after they are contaminated with methylene blue, and after they are photocatalytically activated at 437 nm keeping the total number of incident activation photons per unit area ([activation power x time] / [spot size x photon energy] constant at 1022 m-2 along with (d) the host resin without any
Figure 3.6.1.10 Optical transmission spectra of the films consisting of (a) TiO2 -ZnO combined nanocomposite, (b) only TiO2,and(c) only ZnO nanocomposites before and after they are contaminated with methylene blue, and after they are photocatalytically activated at 458 nm keeping the total number of incident activation photons per unit area ([activation power x time] / [spot size x photon energy] constant at 1022 m-2 along with (d) the host resin without any
nanoparticles as the control group.………..………53
Figure 3.6.1.11 Photocatalytic spectral response of acrylic sol-gel host resin (control).…...………...……….54
Figure 3.6.1.12 Photocatalytic spectral response of only TiO2 and only ZnO nanocomposite films………55
Figure 3.6.2.1 Photocatalytic synergy effect with the use of TiO2-ZnO combined nanocomposite in the near-UV and the visible activation spectra…….……….56
Figure 3.6.2.2 Boltzman fit of optical recoveries after activation in the range from 380 nm to 469 nm……….………..57
List of Tables
Table 3.5.1 Relative differential photocatalytic activities of TiO2 and ZnO nanocomposite films (1/J/cm2)…..………31
Chapter 1
Introduction
In 1972, Fujishima and Honda discovered the photocatalytic splitting of water on TiO2 electrodes [1]. This discovery opened a new research area in heterogeneous photocatalysis. Chemists, physicists, and engineers have thus far conducted various research studies on this subject. Early studies were mainly focused on the energy renewal and storage [2-4]. The production of renewable and nonpolluting fuels by using hydrogen evolution from water splitting on the photocatalysts are still attractive [5]. In recent years, photocatalyst semiconductors have also become increasingly attractive for their peculiar optical properties in decontamination of large media.
Photocatalyst semiconductors offer solution to the reduction of environmental and biological pollution. Today the alarmingly rapid increase in the amount of COx has become one of the most important problems threatening the world. Similarly, the equally rapid increase in the amount of NOx in the atmosphere and water is yet another problem that the world faces. Photocatalysts provide remedies for the degradation of COx and NOx amounts in the medium through redox reactions with the use of light [6, 7]. Photocatalysts also present solution for the decomposition of biological species such as harmful fungi, viruses and bacteria. Such harmful species are decomposed into harmless inorganics with the use of photocatalysts [8].
The size of a photocatalyst is an important parameter affecting the efficiency of the photocatalytic degradation process. In particular, their efficiency is increased when the size is changed from bulk to their nanoparticle dimensions [9-11]. Most of the recent research thus target synthesizing nanoparticle size semiconductor photocatalysts and increasing their photocatalytic activities.
solid thin films or aqueous solutions where nanoparticles are not immobilized. In this case, the removal of the photocatalyst itself from the medium following the decontamination process is not easy [12]. One possible solution to overcome this problem is to immobilize the nanoparticles on a suitable substrate [13, 14]. To date there is comparatively much less research work is conducted on immobilized photocatalyst nanoparticles. In our research, the photocatalytic nanoparticles are immobilized through chemical integration of the nanoparticles into three dimensional host resins. This approach allows for a better homogenous distribution of the nanoparticles with low number of aggregates to compete with the decreased activity due to their immobilization. Very high photocatalytic activities achieved with increased surface to volume ratios of nanoparticles for the reactions occurring at the surface of the photocatalyst.
Utilization of solar light is important for decontamination of large outdoor areas. Highly active photocatalytic nanoparticles such as TiO2 and ZnO are wide bandgap semiconductors that limit the degradation of pollutants under sunlight. These nanoparticles can absorb ultraviolet light at wavelengths shorter than ~388 nm. However UV content of the solar light is only a small percent (~7%) of the whole solar spectrum. Our motivation in this thesis is to make the photocatalytic activity possible with the visible content of sunlight, by extending the photocatalytic activity of our nanocomposite films into the visible. For this purpose, we embedded TiO2 and ZnO nanoparticles into the same resin through chemical integration. We investigated the optical spectral behavior of those nanocomposite films by activating them at selected wavelengths and analyzing their photocatalytic activities at those wavelengths. In this thesis, we focus on increasing the photocatalytic activity of immobilized nanoparticles (TiO2 and ZnO nanocomposite films) in UV, we present their optical characterization and proposed solution of TiO2-ZnO combined nanocomposite films for enhanced photocatalytic activity in the near UV and the visible.
The common use of photocatalytic materials and the parameters affecting photocatalysis are discussed. In the third chapter, we focus on nanostructured photocatalysts, particularly TiO2 and ZnO nanoparticles, and their immobilization in thin films. In the fourth chapter, the experimental procedure and characterization are provided. Experimental results are demonstrated and discussed in the fifth chapter.
The research work of this thesis is carried out as a part of close collobration between the Demir Lab (Devices and Sensors Research Group) of Bilkent University and the R&D Lab (G. Celiker and D. Yucel) of DYO, Yasar Holding.
In the beginning, the size effect on photocatalytic activity of TiO2 nanocomposite film is shown, which was not reported before for the immobilized forms through chemical integration. Also effect of recontamination and reactivation is reported. The results of this section are submitted for publication [15]. Then, optical spectral response and comparative photocatalytic activity studies are provided. The results of this section are published in Journal of Nanophotonics [16]. At the end of this chapter, we show the promising optical recovery levels achieved with the use of combined nanocomposite film for enhanced photocatalytic activity under sunlight. The results of this section are used in patent application and our submission for publication. In the last chapter, we conclude our photocatalytic research work with a summary of the highlights of the previous chapters.
Chapter 2
Background On Photocatalysis
2.1 Photocatalysts
Semiconductor solids that promote chemical reactions in the presence of light without being consumed are known as photocatalysts. To be a good photocatalyst the semiconductor material should be photoactive, non-toxic, and photostable and should offer the ability to be photocatalytically activated under sunlight. TiO2, ZnO, WO3, CdS, ZnS, SrTiO3, SnO2, WSe2, Fe2O3, etc. are among semiconductor solids used as photocatalysts [17]. The range of the optical spectrum where these semiconductor metaloxides are activated is important to determine whether or not the optical activation is possible under sunlight. Semiconductors with superior photocatalytic properties are those with wide bandgaps such as TiO2 and ZnO. Their photocatalytic performance is determined through the process of optical absorption of the incident photons in the UV, and subsequent photogeneration of electron-hole pairs that exhibit dissimilar parity in the respective conduction and valence bands, leading to low recombination rates [8]. On the other hand, a high photocatalytic activity in daylight can be achieved with photocatalysts that have bandgap energies smaller than 3 eV to cover a significant part of the solar spectrum but small bandgap semiconductors have low photoactivities [18].
2.2 Process underlying behind photocatalysis
Degradation of many pollutants, especially organic ones, on the surface of a photocatalyst is promoted in the presence of oxygen and water, with incident light having photon energies larger than the bandgap energy of semiconductor photocatalyst.
The photons absorbed in the photocatalyst excite the electrons from the valence band to the conduction band of the semiconductor photocatalyst, producing electron-hole pairs. Following optical absorption of light, two reactants are adsorbed on the surface of the photocatalyst. They are reduced and oxidized. These reactions are allowed by the band energy position of semiconductor and the redox potentials of the adsorbates. In the reduction mechanism, the redox potential of the adsorbate (acceptor) is below the conduction band of the semiconductor. Excited electron is transferred from the conduction band to the adsorbed particle. In the oxidation mechanism, the redox potential of the adsorbate (donor) is above the valence band of the semiconductor to donate an electron to the vacant hole in the valence band. Oxygen and water are the adsorbates in the photocatalytic reactions [8].
hע
+
+
Volume
recombination
Surface
recombination
+
-+
-A
-A (-Acceptor)
D (Donor)
+
D
++
-Diffusion
to
surface
Figure 2.2.1 Schematic photoexcitation of the semiconductor photocatalyst and the following redox reactions.
The mechanism of photocatalysis is illustrated in Fig. 2.2.1. There are four processes that may occur after the absorption of light. Electron-hole pair either recombines or migrates to the surface leading to oxidation and reduction of the adsorbates. Recombinations can occur at the surface or within the bulk of the photocatalyst. Thus, upon optical irradiation, there is a sufficient lifetime for the electron-hole pair for the charge transfer to the adsorbed species on the surface of the semiconductor. This lifetime is in the regime of nanoseconds [19]. In the absence of such acceptor and donors, electron-hole pair recombines within a few nanoseconds [8, 17].
In presence of water and oxygen, a chain of reactions occur. Water is oxidized by positive holes and oxygen is reduced by the photoelectron of the conduction band. Reactive oxygen species such as H2O2, ·O2-, and hydroxyl radical ·OH are produced. The reactions that are promoted with the absorption of photon (hυ) are given below [8].
Semiconductor (SC) + hυ SC (e- + h+) (1)
The reactions that are initiated with conduction band electron (e-) are given as follows SC(e-) +O2 SC+·O2- (2) SC(e-) + ·O2- + 2H+ SC + H2O2 (3) SC(e-) + H2O2 SC+ ·OH + OH- (4) ·O 2- + H2O2 ·OH + OH- +O2 (5) ·O 2- + H+ ·HO2 (6) SC (e-) + ·HO2 SC+ HO2- (7) HO2- + H+ H2O2 (8) 2 ·HO2 O2 + H2O2 (9)
The reactions that are initiated with valence band hole (h+) are given as follows SC (h+) + H2O(ads) SC+ ·OH(ads) + H+ (10)
SC(h+) + 2H2O(ads) SC+ 2H+ + H2O2 (11)
SC(h+) + OH-(ads) SC+ ·OH (ads) (12)
The resulting highly reactive oxygen species (such as H2O2 and ·O2-) and hydroxyl radical (·OH) attack the organic contaminants on the surface leading to degradation. Thus optically illuminated photocatalyst semiconductor can degrade and mineralize organic compounds through a series of oxidation reactions [8].
2.3 Early studies in photocatalysis
TiO2 has been used in industry as white pigments since ancient times. Its photoactivity was observed first as the flaking of paints and degradation of fabrics including TiO2. In 1938, photobleaching of dyes under UV irradiation was reported. The term „photocatalyst‟ was not used for TiO2 in those times; instead used the term „photosensitizer‟ [20]. In 1960s, photochemical power of TiO2 was studied. Photocatalytic splitting of water on TiO2 electrodes was discovered in 1972, by Fujishima and Honda [1]. In 1980s many studies were conducted on hydrogen production through TiO2 photocatalysis. Various semiconductors were explored for better utilization of solar light for hydrogen production. But they were not as more efficient and stable as TiO2. Subsequently, the direction of research turned into the decontamination of organic pollutants [20]. In recent years many scientists including chemists, physicists, and engineers have worked for enhancing photocatalytic efficiencies of semiconductors for decontamination of large indoor and outdoor areas.
In 1990s, one of the first commercialized self-cleaning surfaces was TiO2 coated cover glass for tunnel light. In most tunnels in Japan, contamination of cover glass of tunnel lamps with exhaust particles was a serious problem. It caused a significant decrease in the illumination power of lamp emitting through the cover glass. High pressure sodium lamps that have UV content of about 3 mW per cm2 at a position of its cover glass were used. UV light is used to clean cover glass coated with photocatalyst [21]. Its photograph is given in Fig. 2.3.1.
Figure 2.3.1 Glass covers on tunnel lighting lamps contaminated by automobile exhaust without TiO2 and maintained clean with TiO2 coating (after [21]).
Banerjee showed the anti-bactericidal activity of TiO2. Gram negative
pseudomonas was used as the testing bacterial colony, which is known as the
major colonizer of freshwater biofilms. Atomic force microscope image belonging to existing bacterial colony was observed to be smooth after exposed to near-UV light [8]. One of the applications of photocatalytic decomposition of microorganisms was conducted by Sunada. Escherichia coli cells on the surface of metal-oxide can be completely decomposed in a week under the activation of UV of 1 mW/cm2 [22].
Such photocatalytic metal-oxides find a wide range of applications including prevention of air pollution by reducing NOx and COx amounts in air [6, 7]. Especially immobilized form of the most commonly used photocatalysts, TiO2 and ZnO, are promising with their high photocatalytic activities. Nanosized metal-oxides show extremely high photocatalytic efficiencies with their high surface to volume ratios and superior properties with smart applications of thin films [15, 16].
Studies that have been conducted so far showed that photocatalytic degradation can be applied to all kinds of organic and inorganic pollutants including heavy metals [17].
2.4 Parameters
affecting
photocatalysis:
adsorption, intensity of light, pH, size, surface
properties, and activation wavelength
Degradation mechanism takes place on the surface of the photocatalyst. The concentration of the adsorbate directly affects the photocatalytic degradation rate of the pollutants to be degraded [23, 24]. Photocatalytic degradation rate is linearly dependent with light intensity at low intensities. It depends on the square root of light intensity for medium intensities. At high intensities photocatalytic degradation rate is independent of the intensity of light [25, 26].
The effect of pH on photocatalytic degradation varies due to the kind of semiconductor used and the kind of adsorbed pollutant [27]. Increasing or decreasing pH affects the adsorption of the pollutant and thus, the degradation rate. pH affects the surface charge of the photocatalyst and the ionizability of the pollutant. Adsorption is enhanced at lower pH values. Strongly adsorbed pollutants degrade faster. At higher pH values above pH 9, degradation rate is also enhanced due to the increased OH- anions on the photocatalyst surface. Therefore all these rates depend on the type of catalyst and the adsorbed pollutant [23, 28, and 29].
The particle size of photocatalysts is an important parameter that affects photocatalytic activity. Decreasing the size of the catalyst, surface to volume ratio is increased, thus photocatalytic activity is increased. Nanosized semiconductors are widely used for their superior photocatalytic properties [15, 16].
The surface properties of semiconductor photocatalysts also affect the photocatalytic activity. It was shown that surface morphology and crystal structure have a direct effect on the photocatalytic activity of TiO2 sol-gel films. Heat treatment can modify crystal structure leading to an increased photocatalytic activity [30].
The degradation mechanism is promoted with the absorption of light by the semiconductor photocatalyst. In optical activation, electrons are excited from the valence band to the conduction band leading to e-h pair formation. The photon energy of the incident light should be above the band gap energy of the semiconductor. So activation wavelength is an important parameter for the photocatalytic reactions. Most commonly used photocatalysts are wide band gap semiconductors that can be activated in UV light. However electromagnetic radiation of sun has only 7% UV content that strikes the atmosphere, which decreases more during penetrating the atmosphere [31]. According to Sasaki [32], the UV part of solar radiation detected on the Earth in 1990-1992 was not more than 0.145% at 290-320 nm and 4.1% at 320-400 nm.
2.5 Nanosized materials
Many properties of photochemical processes change as the semiconductors change scale from bulk to nanorange. Nanosized semiconductors exhibit special thermodynamic, magnetic, photochemical, photo-physical, and electro-physical properties. When semiconductors are in the nanoscale regime, their size has significant effects on their properties. Changing the size of such semiconductor nanoparticles opens up the opportunity to control their characteristics [33].
semiconductor-consequences of electron-hole recombination, and the photo-chemical reactions in the presence of reagents adsorbed on the semiconductor surface [34].
The size effects in semiconductor nanoparticles can be divided into two. The first one is the result of increased surface to volume ratio and change in surface roughness is observed in semiconductor nanoparticles of 10-100 nm in size. The other is the change in the electronic state of the semiconductor due to the quantum size effects dominating especially below a critical size (~10 nm) at room temperature. The critical size, which is the threshold for the quantum size effects, differs for different semiconductors, depending on the chemical structure of the nanoparticle. It is comparable to the De Broglie wavelength of the free electron [35].
2.6 Nanoparticle semiconductors in photocatalysis
(surface area, band gap properties, and
absorption)
A series of significant changes in the characteristics of semiconductor when reduced to a small size comparable to the delocalized exciton depend on the radius of nanoparticle R and the bohr exciton radius aB. In R ≥ aB regime, the
electronic structure of semiconductor is the same as of the bulk. In strongly confined regime where R < aB, semiconductor has discrete energy levels with an
increase in the forbidden gap of the semiconductor i.e., widening of its bandgap. The change in the electronic properties of semiconductor results in a shift in the optical absorption edge to shorter wavelengths due to the widening of the bandgap. On the other hand, small size enhances the probability of the charge carriers to escape to the surface of the semiconductor. The recombination of electron-hole pair and the photochemical charge transfer reactions to the adsorbates on the surface of semiconductor are competing processes for the case of photocatalysis [33].
Semiconductor nanoparticles are characterized with their extremely short time for the diffusion of the excited charges from the volume of the nanoparticle to its surface where adsorbate is close enough to permit the electron tunneling. For the case of TiO2 of10 nm in size, the time for an electron to escape to the surface is smaller than 10 ps. Direct electron-hole recombination time for TiO2 is in the range of 100 ns [33]. Thus nanostructured semiconductor photocatalysts have enhanced photocatalytic activities in the presence of light corresponding to energies larger than the forbidden energy gap.
The potentials of valence and conduction bands play an important role during photocatalytic reactions. The potential level of the conduction band in the semiconductor should be above the reduction potential of the acceptor and the potential level of the valence band should be below the oxidation potential of the donor (for Normal Hydrogen Electrode scale) [36]. Quantum confinement results in a displacement of conduction band to the more negative region of the electrochemical scale of potential, and valence band to the more positive region. The increase in the absolute values of potentials of the photogenerated charges increases the photocatalytic activity of the semiconductor nanoparticles.
2.7 TiO
2and ZnO nanoparticles
Among various semiconductors, TiO2 and ZnO are the most commonly used photocatalysts especially employed for the degradation of several environmental contaminants with their high photosensitivity, stability, and large band gaps [37]. TiO2 is also chemically inert and non-toxic that can be used in a wide range of applications [38]. To describe their photocatalytic activities, one should look into the electronic energy band structure of TiO2.
with Ti 3d states, respectively. Under UV light irradiation, electrons in the TiO2 valence band are excited to the conduction band. The dissimilar parity of the conduction and valence bands causes a reduction in the electron-hole recombination rate to allow the e--h+ pair to diffuse to the surface. It is followed by a chain of reactions to produce highly reactive oxygen species and hydroxyl radicals (˙OH) that are powerful indiscriminate oxidizing agents. Similarly, ZnO is a member of the 3d metal-oxide series. As in TiO2, the photoexcited e--h+ pair of ZnO has also dissimilar parity, making ZnO a good candidate for photocatalyst. ZnO and TiO2 are differed from the other 3d transition metal-oxide semiconductors with their stability upon photoexcitation [8].
2.8 Immobilization in thin films
To date, most of the applications of photocatalytic decomposition are reported to be conducted in aqueous media. This, however, gives rise to technical difficulties associated with the removal of photocatalyst from the medium and their use in wide-scale industrial applications. To circumvent these issues, one remedy is to immobilize the photocatalyst in thin films on a suitable substrate. But the immobilization then leads to the reduction in the active catalyst surface area (and thus in the photocatalytic activity). To compensate for this reduction in the photocatalytic activity, though, nanoparticle can be utilized to effectively increase the active surface area provided that these nanoparticles are integrated into the thin film properly and well dispersed [16].
Immobilization can be achieved through the integration of photocatalytic nanoparticles inside three dimensional host resin via solgel route. Nanoparticles are then well dispersed in the three-dimensional solgel matrix through full chemical integration for highly efficient environmental decontamination.
Highly active photocatalysts such as TiO2 also cause decomposition of their organic host in the presence of UV light, which is called chalking for the case of
paints. To overcome this drawback, TiO2 is coated by an inert coating such as SiO2 or Al2O3 [39].
In our case, silikon-alkoxidesare used for the organic-inorganic material formation, which prevents chalking of the host resin. The sol-gel synthesis of silica is based on the hydrolysis and condensation of silicon-alkoxides, M(OR)z, where R is an alkyl group (R=Me, Et, Pr,… ). Hydrolysis gives reactive silanol groups where as condensation leads to the formation of bridging oxygen. Most common silicon alkoxides are Si(OCH3)4 (tetramethyl ortho silicate) and Si(OC2H5)4 (tetraethyl ortho silicate) [39].
Si-OR + H2O SiOH + ROH hydrolysis Si-OH + RO-Si Si-O-Si + ROH
Chapter 3
Our Experimental Results
Our photocatalytic experiments include transmission measurements of the nanocomposite films at initial state, after contamination, and after activation at selected wavelengths. Important parameters of the experiment are activation wavelength, intensity of light, degree of contamination, and activation time. We have conducted our experiments at different activation wavelengths to obtain the optical spectral response of those photocatalytic films formed with different types of metal-oxide nanocomposites. In all studies we employed monochromatic light for the activation of our films at selected wavelengths in the UV part of the spectrum through a series of experiments. In our recent studies, experiments include activation also in the visible spectrum. These studies, showing the optical spectral response of photocatalyst semiconductors immobilized in films are our recent contributions to the literature where activations are carried out mostly at a single fixed activation wavelength [40] or a UV source including a large spectrum [41, 42] or under direct sunlight [43].
Light intensity is one of the most important parameters for photocatalysis. Light intensity has a direct effect on the reaction rate. Because both the recombination rate of the photo-generated electron-hole pair and the charge transfer at the surface of the photocatalyst depend on light intensity. The electron-hole pair recombination is a second order process when the charge transfer is a first order one. The higher light intensity leads to a relative increase of the recombination rate when compared to the rate of charge transfer [44]. Increased electron-hole recombination with high light intensity also results increasing the temperature of the catalyst, which leads to a decrease in adsorptive capacity [26].
intensity under moderate light intensities when it is independent of light intensity under high intensities [25, 26, 45-47]. In our experiments, the light intensities we have chosen are in low intensity range so that photocatalytic degradation is proportional to the light intensity. The product of light intensity and activation time is kept constant through the same set of experiments.
The degree of contamination determines the availability of pollutants to be degraded. For achieving more precise results, we applied the same contamination procedure for an equal amount of time to all samples in the same experiment set. Drop casting or spraying methods are used at different experiment sets.
3.1 Photocatalytic Recovery Levels
Photocatalytic recovery levels are obtained from the resulting transmission data of the conducted experiments. One of the activated sample photograph is given in Fig. 3.1.1 for better visualization.
Figure 3.1.1 Photograph of TiO2 nanocomposite film first contaminated with methylene
blue and then exposed to UV irradiation.
Methylene blue is used as the contaminant in all our experiments. It is the standard industrial contaminant that becomes colorless when it is chemically
contaminated with methylene blue, a drop in the transmission spectrum in the visible is observed. Upon irradiation with light in the ultraviolet, the transmission curve returns back to its original characteristic level as the methylene blue is degraded during the continuing activation process. The control group experiments (the host resin without any photocatalyst) are carried out for all the experiments conducted at different activation wavelengths. Methylene blue is not degraded in the absence of semiconductor metal-oxide photocatalyst.
Methylene blue has absorbance peaks in the visible between ~450 nm and ~750 nm. Some photocatalytic activity analyses are performed by using the change in the absorbance of methylene blue due to the decomposition under UV [49, 50]. Methylene blue bleaching may result from the reduction of methylene blue to its leuco form, or if it is oxygenated or decomposed. Remote bleaching cannot be a simple reduction to its leuco form. It is either oxygenated or decomposed, which are irreversible processes [50]. In all our experiments, we do not observe oxidation of the molecular oxygen, so the degradation of methylene blue is due to the photocatalytic decomposition [15].
During our experiments, we used a monochromator (CM 110 Spectral Products) and a Xenon light source for both to activate our samples in UV to visible and to take transmission measurements in the visible with Newport power-meter. Optical analysis of photocatalytic recovery is carried out through contaminating our sample and then activating with a monochromatic light at a known wavelength. After each activation period, transmission measurement of activated sample is taken for optical recovery analyses.
450 500 550 600 650 700 750 0.0 0.2 0.4 0.6 0.8 1.0 R el at ive Tr ansm issi on (a. u. ) Activation Wavelength (nm) clean
contaminated with methylene blue after 15 min activation @330 nm
Figure 3.1.2 Optical transmission spectra of TiO2 nanocomposite film when it is clean,
contaminated with methylene blue, and activated with UV light.
Optical recovery level is the ratio of spectral area between activated transmission curve and the contaminated transmission curve of the sample to the area between transmissions of clean and contaminated curves. The optical activation is carried out with a larger slit when transmission is measured through smaller slit of the monochromator. All of the measurements are taken from the same spot within the activated area.
3.2 Size Effect
Till date many studies on photocatalytic activity have been conducted. However most of these experiments were conducted in aqueous solutions. For example, the effect of metal-oxide nanoparticle size was explored for photocatalytic
solution which are affected through the photocatalytic decomposition process [15]. However, the size effect studies for immobilized photocatalytic nanoparticles have not previously been studied, which are much more applicable for decontamination of large indoor and outdoor areas. With the use of our optical spectroscopic method for measuring the photocatalytic activity of nanocomposite films, we define a figure of merit for photocatalytic recovery levels for immobilized nanoparticles.
For the experiment sets on the effect of nanoparticle size, TiO2 (6 nm in diameter) and TiO2 (21 nm in diameter) are used. Nanoparticles are embedded inside three dimensional acrylic sol-gel matrix. The chemical integration leads to a well dispersed semiconductor metal-oxide nanocomposite with a very low number of aggregates. 6 nm TiO2 nanocomposite film, 21 nm TiO2 nanocomposite film, and acrylic sol-gel film (without any photocatalyst nanoparticle) for control experiments are formed.
Figure 3.2.1 SEM image of our photocatalytic nanocomposites that nanoparticles are integrated into their three-dimensional sol-gel matrices.
In the experiment, the optical activation wavelength is 330 nm. During experiments, transmission spectra in the visible are measured after every activation periods with constant excitation power density.
0.0 0.8 1.5 2.3 0 3 5 8 0 5 10 15 20 25 30 35
Optical Excitation Density (J/cm2)
Opt ic al R ec ov ery ( Time (hours)
Measurements
Linear fit
=17.46+2.01tFigure 3.2.2 Optical recovery levels for titanium dioxide nanoparticles (6 nm in diameter) in the early phase of optical excitation process.
Fig. 3.2.2 shows the early phase of photocatalytic activation of 6 nm TiO2 nanocomposite film under irradiation with 330 nm monochromatic light. The optical recovery is very fast in the early phase of the photocatalytic activation up to the optical activation with 6.88 J/cm2 [15].
In Fig. 3.2.3, there are five continuing activation durations with optical activation ranging from 10.8 J/cm2 to 54 J/cm2. The calculated optical recovery levels after each activation period at 330 nm excitation is obtained for both 6 nm TiO2 nanocomposite film and 21 nm TiO2 nanocomposite film. The existing data for early and late phase of activation for 6 nm TiO2 nanocomposite films show that the degradation of methylene blue is faster in the early phase of activation. The differential optical recovery value (the rate of increase in the photocatalytic
3 6 9 12 15 18 5 1010 15 2020 25 3030 35 4040 45 5050 55 6060 30 35 40 45 50 55 60 65 70
Optical Excitation Density (J/cm2)
O pti cal Rec ov ery ( ) Time (hours) 21 nm 6 nm (21nm)=28.4+0.59t (6nm)=39.8+0.54t
Figure 3.2.3 Optical recovery levels of titanium dioxide nanocomposite films with nanoparticle sizes of 6 nm and 21 nm.
Nanocomposite films, in which nanoparticles with two different sizes, are embedded, and are formed for exploring size effect for immobilized photocatalytic nanoparticles. The photocatalytic activity comparison of these nanocomposite films under activation with 330 nm monochromatic light under the same condition is studied in Fig. 3.2.3. Smaller sized TiO2 nanocomposite film has higher photocatalytic activity than the larger sized one. One reason for the increased photocatalytic activity with smaller size is the increased active surface area due to the increased surface to volume ratio. Another reason is the quantum confinement effect resulting from the smaller size.
340 360 380 400 420 440 460 0.5 1.0 1.5 2.0 2.5 3.0 Ab sor bance (a. u. ) Wavelength (nm) 6 nm 21 nm
Figure 3.2.4 Absorbance spectra of the TiO2 nanocomposite films with nanoparticle sizes of
6 nm and 21 nm in diameter.
Optical absorption spectra of 6 nm and 21 nm TiO2 nanocomposite films are shown in Fig. 3.2.4. Shrinking the size from 21 nm to 6 nm results in an increase in the forbidden band due to the quantum confinement [15]. It is demonstrated in Fig. 3.2.4. Widening of the band gap leads to an increase in the energy of conduction band electrons and valence band holes. Better matching with the redox potentials of the adsorbates due to the shift in the conduction band minimum and the valence band maximum results in an increased activity in the reduction of the acceptor and in the oxidation of the donor [8, 33].
For the control group experiment in Fig. 3.2.5, we used acrylic sol-gel film without any photocatalyst inside. It is the host matrix we used in which nanoparticles are embedded for photocatalytic applications. Acrylic sol-gel film is irradiated with 330 nm monochromatic light with activation energies from 9.5 J/cm2 to 47.5 J/cm2. A slight bleaching is observed for methylene blue, which is
is very small when compared with the photocatalytic recovery of the catalyst nanocomposite film. So the main contribution of degradation of the contaminants in the presence of TiO2 nanoparticles comes from the photocatalytic activity [15]. 400 450 500 550 600 650 700 44 48 52 56 60 64 68 72 76 80 Transmission (%) Wavelength (nm) before contamination after contamination with methylene act. with 9.5 J / cm2 act. with 19 J / cm2 act. with 28.5 J / cm2 act. with 38 J / cm2 act. with 47.5 J / cm2
Figure 3.2.5 Optical transmission spectra of acrylic film for control experiment; contaminated with methylene blue and activated under UV light at 330 nm with excitation density ranging from 9.5 J/cm2 up to 47.5 J/cm2.
3.3 Effect of recontamination and reactivation
TiO2 (6 nm) nanocomposite film that is activated at 330 nm at optical activation ranging from 10.8 J/cm2 up to 54 J/cm2 is used for recontamination and reactivation purposes. After the first activation with optical excitation density of 54 J/cm2, the optical recovery level was about 68% (Fig. 3.3.1). The same sample is recontaminated and exposed to UV irradiation of 330 nm for a shorter time than the previous activation (activated with nearly half of the previous activation energy/unit area) [15].3 6 9 12 15 18 5 1010 15 2020 25 3030 35 4040 45 5050 55 6060 30 35 40 45 50 55 60 65 70
Optical Excitation Density (J/cm2)
O pti cal Rec ov ery ( ) Time (hours) 6 nm (6nm)=39.8+0.54t
Figure 3.3.1 Optical recovery levels of TiO2 nanocomposite film with nanoparticle
diameter of 6 nm after it is photocatalytically self-cleaned from methylene blue.
The reactivation following the recontamination is performed with optical excitation density of 32 J/cm2. The optical recovery level obtained at the end of UV irradiation at 330 nm is about 85% with a higher increase than the first activation process [15]. The optical recovery achieved for the first experiment after the same amount of activation (32 J/cm2) was ~ 58% in Fig. 3.3.1. The reason for a better activity for the reactivation after recontamination is due to the surface structural change of TiO2 crystal lattice reacting with water molecules [39, 52, 53].
0.0 1.5 3.0 4.5 6.0 7.5 9.0 10.5 0 3 5 8 10 13 15 18 20 23 25 28 30 33 35 30 40 50 60 70 80 90
Optical Excitation Density (J/cm2)
Opt ic al R ec ov ery ( ) (%) Time (hours) Measurements Linear fit =32.4+1.68t
Figure 3.3.2 Optical recovery levels of TiO2 nanocomposite film with nanoparticles
diameter of 6 nm after it is photocatalytically self-cleaned from methylene blue, contaminated again, and photocatalytically reactivated at the same wavelength.
3.4 Activation Wavelength
The optical activation wavelength has an important effect on the photocatalytic recovery levels. The band gap energy of semiconductor metal-oxide limits the photocatalytic activity at higher wavelengths with photon energies smaller than the forbidden gap. The spectral photocatalytic response of TiO2 and ZnO nanocomposite films are investigated in sections 3.4.1 and 3.5, for defining the optimal activation wavelength ranges. In the literature, though the effect of activation wavelength on photocatalytic activity is mentioned [54]. However there is no complete study of photocatalytic activity for different excitation wavelengths ranging from UV to visible.
3.4.1 Optical spectral response of ZnO
The nanocomposite film is formed through chemical integration of ZnO nanoparticles into three dimensional poly(vinylacetate)/ poly(methylmethacrylate) host resin. ZnO nanoparticles are 100 nm in diameter. We contaminate our samples with the standard methylene blue by spray coating and optically activate them under UV illumination with known activation wavelength and intensity for the certain periods of time. After analyzing the experimental data, the resulting photocatalytic recovery levels are plotted as a function of the excitation wavelength. Here every data point corresponds to an experiment of ZnO nanocomposite films conducted under exactly the same conditions. 0 10 20 30 40 50 60 70 80 270 290 310 330 350 370 Activation Wavelength (nm) Optica l Rec ov ery (%)
Figure 3.4.1.1 Optical recovery levels achieved at the end of 8 hours activation (7.3 J/cm2) at different wavelengths ranging from 270 nm to 370 nm.
The optical recovery is the largest at an excitation of 290 nm. The increased photocatalytic recovery at activation wavelengths below 370 nm is expected. The photocatalytic activity decreases at excitation wavelengths below 290 nm.
resulting from the increased temperature due to higher energy photon recombination [26].
3.5 Comparative study of TiO
2and ZnO
nanocomposite films
TiO2 nanoparticles and ZnO nanoparticles, which are 6 nm and 150 nm in diameters, respectively, are immobilized through full chemical integration into sol-gel matrix. Nanocomposite sol-gel is applied on acetate film through spray coating method. The mass ratio of nanoparticles embedded into the host sol-gel is 6.0% for TiO2 and 9.5% for ZnO. The resulting films are 10 µm in thickness.
Figure 3.5.1 TEM image of the prepared sol-gel.
During the sol-gel synthesis, two types of silicon alkoxides were used to obtain the hybrid organic-inorganic material that leads to the formation of a three
dimensional silica network. The solvent plays an important role to control the formation and properties of silica gels. Thus, to achieve an appropriate host resin, we used ethyl alcohol and iso-propyl alcohol. Hydrolysis and condensation rates of silicon alkoxides were further enhanced by HCl (0.1 N) catalysis. Reaction initiation temperature was 50ºC. Nanoparticle dispersion integrated into the resulting solgel was applied on acetate film through spray coating method. As a result of the chemical integration, we obtained nanocomposite materials with their nanoparticles dispersed more uniformly than mere blending. Here we used TiO2 nanoparticles of 6 nm in size and ZnO nanoparticles of 150 nm in size, with the mass ratio of the incorporated nanoparticles to the host solgel of 6.0% for TiO2 and of 9.5% for ZnO in thin films of about 10 μm in thickness [16].
Optical recovery levels are obtained for each sample activated at a monochromatic wavelength as a function of the incident total optical excitation density increased from 1.8 J/cm2 to 7.3 J/cm2. In Fig. 3.5.2, smaller TiO2 nanoparticles have a general behavior of higher photocatalytic activity than larger size ZnO nanoparticles although it has lower concentration than ZnO. Also ZnO is reported to have higher quantum efficiency in the literature [55]. Thus we demonstrate that nanoparticle quantum size effect and the increased surface to volume ratio with larger active surface area of the photocatalyst have an important effect on the activity of the photocatalytic film in addition to the type of the photocatalyst.
1 2 3 4 5 6 7 8 0 10 20 30 40 50 60 70 80 90 100 Photocatalytic Recovery (%) Excitation Density (J/cm2) TiO2@ 270nm TiO2@ 290nm TiO2@ 310nm TiO2@ 330nm TiO2@ 350nm TiO2@ 370nm ZnO @ 270nm ZnO @ 290nm ZnO @ 310nm ZnO @ 330nm ZnO @ 350nm ZnO @ 370nm
Figure 3.5.2 Relative spectral photocatalyic recovery levels of TiO2 and ZnO
nanocomposite films at monochromatic activation wavelengths (270-370 nm) as a function of incident total optical excitation density (incident optical intensity x time).
In this implementation, TiO2 has its highest photocatalytic activity when excited at wavelength of 310 nm. ZnO has its optimum photocatalytic activity when excited at 290 nm, which is the same result we obtained using a different host resin, poly(vinylacetate)/ poly(methylmethacrylate in another experiment set. The highest optical recovery level of TiO2 is 93% when activated with 310 nm and of ZnO is 55% when activated with 290 nm. This result indicates that combinations of TiO2 and ZnO nanoparticles integrated in the same resin can be used to tune the optimal activation wavelength [16, 48].
Activation
Wavelength 270 nm 290 nm 310 nm 330 nm 350 nm 370 nm
TiO2 6.00 5.47 7.15 7.10 4.70 4.02
ZnO 1.28 2.52 1.94 1.10 1.36 -0.73
Table 3.5.1 Relative differential photocatalytic activities of TiO2 and ZnO nanocomposite
films (1/J/cm2).
The slopes of the linear fits to the photocatalytic recovery curves are given in Table 3.5.1. The differential photocatalytic activities at different activation wavelengths for both TiO2 and ZnO nanocomposite films are obtained as a figure of merit to represent the incremental photocatalytic activity per unit optical excitation density. TiO2 has higher differential activity than ZnO, in addition to its higher photocatalytic activities at all activation wavelengths. Also a good correlation is observed between the differential photocatalytic activity and the photocatalytic activity, both of which have the highest values at the optimum excitation wavelength for both TiO2 (7.15 x 10⁻⁴at 310 nm) and for ZnO (2.52 x 10⁻⁴ at 290 nm). The photocatalytic recovery curves require larger slopes to reach high levels of recovery within a finite period of optical activation at a constant optical intensity [16].
3.6 Combination of TiO
2-ZnO nanoparticles
chemically integrated into acrylic for enhanced
photocatalytic activity in the near-UV and the
visible
higher energies than the forbidden band of those catalysts. The part of spectrum that these nanoparticles can be photocatalytically activated is very important especially when these immobilized forms are used for the decontamination of large outdoor areas under sunlight.
TiO2 nanoparticles (6 nm in diameter) and ZnO nanoparticles (150 nm in diameter) are chemically integrated into the same resin to enhance the photocatalytic activity in the near-UV and the visible spectral ranges that make higher content of the sunlight. A hybrid nanocomposite material is formed through immobilization of the same amount of TiO2 (8.5% mass ratio) and ZnO (8.5% mass ratio) nanoparticles in the same acrylic sol-gel resin with a better dispersion than simple blending. Only TiO2 and only ZnO nanocomposite films are formed with the same total metal-oxide concentration of 17% for comparison purposes.
In the literature, there is a significant amount of research work on the photocatalytic activities of immobilized TiO2 and ZnO nanoparticles seperately in thin film [8, 12, 56, and 57]. The combination of TiO2 and ZnO nanoparticles integrated into a single film, however, remains to be unexplored.
The host acrylic sol-gel resin provides a homogenous distribution of the metal-oxide nanoparticles inside the three dimensional matrix with a very low number of aggregates. Despite the decreased active surface area due to the immobilization, semiconductors have very high photocatalytic activities. Hybrid organic-inorganic material formation via sol-gel route prevents the photocatalytic degradation of the host resin with these highly active nanoparticles. The optical recovery levels measured during the activation of nanocomposite films only come from the degradation of the contaminant methylene blue.
In the literature, some research work is available for the enhancement of the photocatalytic activity by incorporating various semiconductors [18, 40, 41-43,
58]. These semiconductors are incorporated in the interlayer of the layered compounds for nanocomposite film fabrication. Higher photocatalytic activities compared to the unsupported photocatalysts are reported [18]. Besides the difference of their method and the limited applicability when compared to ours, no optical spectral study is conducted to find out the wavelength range where the enhancement occurs. The nanocomposite films formed with various techniques in the literature are mostly activated with direct sunlight [18], with a UV lamp consisting of only UV content [41, 42] or at a single fixed activation wavelength [40]. Enhancement in deeper UV wavelengths has no significance if we consider photocatalytic decontamination under sunlight. With the use of chemically integrated TiO2-ZnO combined nanocomposite film, our study contributes to the literature with the discovery and demonstration of enhancement in the photocatalytic recovery achieved under irradiation with the near-UV and the visible light.
3.6.1 Activations in the ultraviolet and the visible
Three sets of nanocomposite films are formed by spray coating method, each with a 10 µm thickness:
1) Combination of TiO2-ZnO nanoparticles (8.5% of TiO2 and 8.5% of ZnO mass ratios [17% of total metal-oxide] in the dispersion) in acrylic sol-gel film, 2) Only TiO2 nanoparticles (17% mass ratio in dispersion) in acrylic sol-gel film,
3) Only ZnO nanoparticles (17% mass ratio in dispersion) in acrylic sol-gel film. Also, acrylic sol-gel film on acetate without any metal-oxides is formed for control group experiments.
Methylene blue is used as the standard contaminant. Contamination is carried out through drop casting and waiting for 30 minutes for every sample to achieve
specific wavelengths from 310 nm to 469 nm. The total number of incident activation photons per unit area is kept constant at
[activation power x time] / [spot size x photon energy] = 1022m-2
We choose the exposure times in minutes (a few to tens of minutes) and activation powers were tens to hundreds of microwatts to obtain the photocatalytic recovery levels for all three kinds of nanocomposite films on the same recovery scale from zero to hundred percent for better comparison. We use the same contamination level of around 20% for all samples. These chosen parameters are important for photocatalytic activity comparison of those three nanocomposite films activated at different activation wavelengths. If a smaller amount of contamination is chosen, all the methylene blue can be degraded by TiO2 film at 310 nm and TiO2 cannot find contaminant to further degrade for the continuing activation period. This will make the comparative study impossible. Also if we choose longer activation time, the same problem can occur.
An experiment set is shown in Fig. 3.6.1.1. Nanocomposite films and the control group film are activated at 330 nm after they are contaminated with methylene blue. The decrease in the optical transmission of film is observed after it is contaminated. Optical transmission curve recovers its optical level during the optical activation at 330 nm due to the degradation of methylene blue.

![Figure 2.3.1 Glass covers on tunnel lighting lamps contaminated by automobile exhaust without TiO 2 and maintained clean with TiO 2 coating (after [21])](https://thumb-eu.123doks.com/thumbv2/9libnet/5947699.123979/23.892.293.665.185.497/figure-glass-lighting-contaminated-automobile-exhaust-maintained-coating.webp)