ÖZET
Bu çalışma OECD üyesi ülkelerdeki kurumlar vergisi oranının doğrudan yabancı sermaye yatırımları (DYS) üzerindeki etkisini incelemektedir. Çalışmada kurumlar vergisi oranının düşürülmesinin doğrudan yabancı yatırımlar üzerindeki etkisini ortaya koymayı amaçladık. Doğrudan yabancı sermaye yatırımlarının vergi oranlarının düşürülmesinden sonra anlamlı bir biçimde artış gösterdiğini bulduk. Vergi oranları ile DYS arasındaki ilişkiyi incelemek için sabit etki panel regresyonu ve GMM tahmin modelini kullandık. Vergi oranları ile DYS arasında negatif bir ilişki bulduk. Sonuçlarımız vergi oranlarını düşüren ülkelerin, bu düşüşü izleyen süreçte daha yüksek seviyede DYS çektiğini göstermektedir.
Anahtar kelimeler: Doğrudan yabancı yatırım, OECD, kurumlar vergisi oranı
The Effect of Corporate Tax Rate on Foreign Direct
Investment: A Panel Study for OECD Countries
Kurumlar Vergisi Oranının Yabancı Sermaye Yatırımları Üzerindeki Etkisi:
OECD Ülkelerine Yönelik Bir Panel Çalışması
Nida ABDiOĞLU
1, Mine BiNiŞ
2, Mehmet ARSLAN
31Yrd. Doç., Dr. Nida Abdioğlu, Bandırma 17 Eylül Üniversitesi İİİBF İşletme Bölümü
ABSTRACT
This paper examines the impact of corporate income tax rate on foreign direct investment level (FDI) in the OECD countries. We attempt to find the impact of reduced corporate tax rate on foreign direct investment. We find that FDI level increases significantly following tax rate reductions at univariate level. We use fixed effect panel estimation and GMM method of estimation to test the relation between tax rate and FDI level. We report a negative relation between tax rate and FDI level. Our findings show that the countries which reduce their tax rates, attract higher level of FDI following this reduction.
Keywords: Foreign direct investment, OECD, corporate tax rate
1. INTRODUCTION
Governments have been using several policy instruments in order to attract foreign investors to their own countries. Its active role on economic growth and productivity makes foreign direct investment (FDI) important for countries. FDI is defined as a special shape of a cross-border financial flow (Deverux and Griffith, 2002; p. 85). Not only developed countries make regulations but also developing countries constitute policies in order to foster foreign direct investment. To achieve this goal, they put into effect fiscal incentives especially tax instruments, such as tax holidays, tax exemptions and reduction of tax rates. At the same time tax integration schemes have played a substantial role for attracting FDI. All investors, including foreign investors, wish to increase their profit and they accept tax rate as one of the cost elements. Their aim is to increase their earnings after tax. As a result, investors transfer
their investments to the countries which offer more advantages to investors (Sanjo, 2012).
According to Dunning (1988), there are three key determinants motivating the firms in acting as multinational enterprises. These indicators are: ownership-specific advantages, the desire to internalize these advantages and the amount of profits that could be made by combining these assets with location-specific resources. His theory which is named as Ownership, Location and Internalization (OLI) paradigm helps us to build our hypothesis. A particular firm prefers to serve as a multinational enterprise when there is a combination of ownership, location and internalization advantages while operating in a particular country (Dunning, 1988). It can be argued that there are some fixed costs associated with FDI (Helpman et al., 2004). If the tax regulations including tax rates in a country accepted as one of these costs, it can be assumed that the
tax rate also affects the level of FDI inflows in that particular country (Devereux and Maffini, 2006). Put it differently, tax policies are effective on location of FDI since higher tax rates reduce the after tax returns (Gordon and Hines, 2002). Since tax rates changes the rates of return on assets, it affects the investment decisions’ of foreigners when they invest abroad (Scholes and Wolfson, 1992). Increased tax rate reduces the rate of return and this results with lower level of FDI inflow. Tax competition among the countries has increased day by day with the purpose of attracting investment and raising their FDI inflows. In order to attract FDI inflows, countries apply some regulations including reduction in corporate tax rate. As it can be seen from Table 1, most of the OECD countries show a remarkable decline in their corporate tax rates. The aim of this study to investigate how the reduction in corporate tax rates in OECD countries is effective on the level of FDI inflows to these countries. We determine the countries that show a reduction in tax rates between 2003 and 2013 and we analyze the FDI levels in these countries. We argue that the decreased tax rates in these OECD countries should be resulted with increased level of FDI inflows. Profit will be higher for foreign investors where they can operate their business at a low cost (Mottaleb and Kalirajan, 2010). Decreased cost of FDI will be resulted with higher level of FDI inflows.
We focus on OECD countries which reduce their corporate income tax rate in the period 2003-2013. Since FDI has become progressively prominent in the OECD countries, we prefer to examine these countries. For instance, foreign direct investment inflows in the OECD countries have increased from $ 1.310.437 million in 2000 to $ 640.656.206 million in 2013 (OECD, 2014). We also take into account only the countries which show a remarkable decrease in their corporate tax rate in the period between 2003 and 2013. We aim to show that the reduction of corporate tax rate will provide higher level of FDI levels. Although prior studies have examined the impact of tax rate on FDI levels, they have not examined only the countries which show remarkable decrease in their corporate tax rates. We distinguish our study from the existing literature by taking into account these remarkable declines. We also use the recent data that is available.
Section 2 discusses the several empirical studies based on the relation between corporate tax rate and FDI. Section 3 presents our model, describes the
data, variables and methodology. Section 4 reports the empirical results. In Section 5, we report the dynamic panel data results. The last section provides our conclusion.
2. LITERATURE REVIEW
The literature about the impact of taxation on FDI flows focuses on two main areas: the impact of tax policies and the impact of tax reforms on investors’ location decisions. Agostini (2007) examines the effects of corporate income taxes on the location of FDI in the US and finds that corporate tax rate has a positive effect on FDI. Cummins and Hubbard (1995) find that tax policies affect FDI outflow through the subsidiaries of US multinational firms. Egger and Raff (2011) analyze the impact of reduced corporate tax rate on FDI inflows. They take into account FDI inflows to 43 developed (OECD members) and emerging countries over the period 1982-2005. They aim to show the effects of regional trade integration on international tax competition. Their results confirm that the integration inclines a significant reduction in corporate tax rates. Sudsawasd (2008) builds a model to expose the impact of corporate income taxes and tax treaties on FDI inflows to East Asia countries, particularly the ASEAN 5 countries (Indonesia, Malaysia, Philippines, Singapore and Thailand). He reports that an increase in corporate tax rate causes a decrease in FDI level, as expected. Sato (2012) targets to find out which elements will be effective on attracting the FDI through the 19 OECD members between the period 1985-2005. His results state that corporate tax rate impresses the FDI. He remarks that “a one percentage point reduction in the corporate tax rate of the host country causes an increase of about 2.4 % in FDI” (Sato, 2012; p. 16). One of the inferred results is that the size of FDI is influenced by the previous year’s investment level. Young (1988) takes into consideration the impact of domestic tax rates on FDI in the US over the period 1953-1984. He finds that FDI on behalf of retained earnings, are more elastic to changes in taxes and it has a greater effect on transferring new funds (Young, 1988; p. 119). A report prepared by OECD (2007) demonstrates that a one percentage point reduction in corporate tax rate causes a 0-5% increase in FDI.
The relation of FDI with tax reforms and tax schemes is another area of the literature. Devereux and Freeman (1995) review the impact of taxation on foreign direct investment on behalf of tax integration
schemes, which is based on the investigation of seven countries during the period1984 - 1989. Their key findings are based on two results: 1) Taxation affects the location of outward FDI, as it was expected. 2) There is no significant effect of taxation between the choices of domestic investment and total outward FDI. Swenson (1994) focuses on the tax reforms stimulation on FDI. He explains the impact of 1986 tax reform in the US from the point of average and effective tax rates. With this reform tax rates increased. Although average tax rate increased only two points, its impact on industries was realized more over then.They also emphasize FDI sensitivity on tax rates and find that average tax rate is more elastic than effective tax rate. Gropp and Kostial (2000) deal with EU tax harmonization effects on corporate tax revenues, in the sense of FDI flows. Their main argument is that tax regime has an important role on FDI and on corporate tax revenues. When a country reduces its corporate tax rate, FDI flow to this country will increase and hence tax revenue will increase. They especially refer to three countries Germany, Italy and Ireland. While Germany and Italy’s tax revenues show increases after the EU harmonization, Ireland’s tax revenue decreases. Using data set from the period 1980-1989 including US and ten other countries, Jun (1994) shows the impact of specific taxes on FDI flows in both home and host countries. As he predicts, evidence confirms that while home country tax systems have an influence on FDI, host country tax systems do not have same influence on FDI.
Some studies focus on the possible variables that affect FDI inflow. For instance Shazdad and Zahid (2011) take into account variables which will have an impact on the FDI inflow including the period 1991-2010. Although they examine whether gross domestic product, interest rate, domestic investment, inflation rate and tax rate are effective on FDI, they find that only gross domestic investment has significant impact on FDI. Morisset and Pirnia (1999) also focus on the impact of tax policies on FDI and they examine the relation over sets of time-series analysis. They aim to determine tax instruments’ power of fostering FDI. Taxes have a significant impact on FDI especially other factors are more or less equal under the ceteris paribus assumption. Their results indicate that the impact of tax policies on FDI will vary from one country to another. The empirical results indicate that high tax rates have a negative influence on FDI. For instance Diamond et al. (2013) examine the effect of lower
corporate tax rate in US economy and the OECD 19 countries over the period 30 years. They demonstrate that high corporate tax rate has a negative effect on investment. One of the important findings of their report demonstrates that the sensitivity of capital outflow to higher tax rates with US GDP falling by at least 1.3 % in the long run. Mooij and Ederveen (2005) find that while variables of home country’s tax rate and exchange rate are irrelevant, openness and agglomeration variables have inclines to reduce the magnitude of the elasticity.
3. DATA AND METHODOLOGY
We use world development indicators database to collect our dependent and independent variables over the period from 2003 to 20131. To collect total tax revenue data and corporate tax rate, we use OECD StatExtracts database. We include some OECD countries that show a remarkable decrease in the corporate tax level during the data period. The countries in our dataset are as follows: Austria, Canada, Czech Republic, Denmark, Estonia, Finland, France, Germany, Greece, Israel, Italy, Korea, Netherlands, New Zealand, Poland, Slovenia, Spain, Turkey and United Kingdom2. The common feature of these countries is the period they applied the tax reduction. They apply the tax reductions between the period 2003 and 2008 as it is shown in Table 2. We create a panel dataset to examine the foreign direct investment inflows to these 19 countries.
3.1 The variables
This section provides the definitions of dependent and independent variables used in this paper. We follow the literature to create variables that affect foreign direct investment3. The relevant variables are as follows:
Foreign Direct Investment (FDI): This variable is the net inflows in the related economy from foreign investors divided by GDP. The inflows capture the sum of equity capital, reinvestment of earnings, other long term capital and short term capital.
GDP Growth (GDP): It is the annual growth rate of GDP at market prices based on local currency of the related country. Foreign investors take into consideration the growth prospects of the host country when they relocate in that country (Morrissey and Rai, 1995). According to Lim (1983), there are better growing opportunities in the rapidly growing economies than the ones growing slowly
or not growing at all (Charkrabarti, 2001). Although some studies find a positive relation between GDP growth and FDI (i.e. Schneider and Frey, 1985; Culem, 1988; and Billington, 1999), there is another part of the literature which finds a negative relation. For instance, Nigh (1985) finds a weak negative relation between growth and FDI.
Inflation (annual %) (INF): This variable indicates the annual growth rates of Consumer Prices Index. Inflation is accepted to capture the lack of monetary discipline within a country. (Wisniewski and Pathan, 2014). Most of the literature generally finds a negative relation between inflation and FDI. (Bengoa and Sanchez-Robles , 2003; Demirhan and Masca, 2008).
Population growth (annual %) (POP): This variable captures the rate of growth of midyear population from year t-1 to t. Population size is accepted as an indication of market size. Since FDI is increasing in market size, population should have positive impact on FDI (Kristjánsdóttir, 2005).
Unemployment (UNEMP): Unemployment refers to the share of the labor force that is without work but available for and seeking employment (World Bank definition). Botric and Skuflic (2006) find a negative relation between unemployment rate and FDI. They explain this negative relation with the idea that more investments are bound to decrease unemployment.
Corporate Tax Rate (TAX): Billington (1999), Cassou (1997) and Kemsley (1998) report that decreased tax rates attracts higher level of FDI inflows. On the other hand, there is another part of the literature which shows that tax rate is not effective on FDI levels, ie. Yulin and Reed (1995) and Porcano and Price (1996).
Tax Revenue (REV): This variable is the total tax revenue as a percentage of GDP. Gropp and Kostial (2000) find that FDI flows may affect corporate income tax revenues through increasing the domestic capital stock.
Openness (OPEN): This variable is the ratio of trade (export and imports) to GDP. Charkrabarti (2001, p.99) explain the relation between openness and FDI level as follows: “…given that most investment projects are directed towards the tradable sector, a country’s degree of openness to international trade should be a relevant factor in the decision.” Edwards (1990) and Pistoresi (2000) are among the studies which find a positive relation between openness and FDI.
Kaufmann, Kraay and Mastruzzi (KKM) governance indicators: Following Beltratti et al. (2009), we use average of KKM governance indicators as a measure of a country’s governance quality. Kaufman et al. (2007, p.3-4) define these indicators as follows: “1. Voice and Accountability (VA), measures the extent to which a country’s citizens are able to participate in selecting their government, as well as freedom of expression, freedom of association, and a free media. 2. Political Stability and Absence of Violence (PV), measures perceptions of the likelihood that the government will be destabilized or overthrown by unconstitutional or violent means, including domestic violence and terrorism. 3. Government Effectiveness (GE), measures the quality of public services, the quality of the civil service and the degree of its independence from political pressures, the quality of policy formulation and implementation, and the credibility of the government’s commitment to such policies. 4. Regulatory Quality (RQ), measures the ability of the government to formulate and implement sound policies and regulations that permit and promote private sector development. 5. Rule of Law (RL), measures the extent to which agents have confidence in and abide by the rules of society, and in particular the quality of contract enforcement, the police, and the courts, as well as the likelihood of crime and violence. 6. Control of Corruption (CC), measures the extent to which public power is exercised for private gain, including both petty and grand forms of corruption, as well as “capture” of the state by elites and private interests.”
3.2 Methodology
We use following model to test our hypothesis:
, 0 1 , ,
c t c t z c t
FDI
=
a a TAX
+
+
a X
+
YD
+
ε
(1)In the model, we test our hypothesis for the period 2003-2013. The dependent variable (FDI) is the foreign direct investment inflows to a country at time t, as a percentage of GDP. Our main independent variable is TAX which is corporate tax rate in each country at time t. X is a vector of variables that are effective on foreign direct investment inflows. These variables are annual growth rate of GDP, annual inflation rate, population growth, unemployment rate, corporate tax revenue, openness of the economy and average of KKM measures. YD is the set of year dummies. To confirm our hypotheses, we expect the coefficient α1 to be negative. We use country fixed effect panel
regressions to test our model. Fixed effect model removes the effect of time-invariant country level omitted characteristics that may bias the outcome variables. Hausman test is applied in order to decide between fixed effects and random effects model. Since the null of Hausman test, which is the difference in coefficients is not systematic, is rejected with 0.04 p-value, fixed effect model is used. To control for cross-sectional dependence and to remove time trends from our model, we also use year dummies in our regression. We use heteroskedasticity and
autocorrelation consistent robust standard errors in our regressions.
3.3 Descriptive Statistics
Figure 1 reports the changes in FDI percentages between 2003 and 2013 for our sample countries. Although FDI percentage was 6.75% in 2000, it decreased to 2.33% in 2004. However, by showing a sharp increase, FDI reached 6.12% in 2005. As it can be seen from Figure1, FDI percentage remains in the higher levels between 2005 and 2008. After 2008, it starts to decrease again.
Figure 1: Foreign Direct Investment Inflows as a Percentage of GDP in the Sample Countries Table 1 reports corporate tax rate changes for
our sample countries. We colour the years when the corporate tax rate starts to decrease. Table 1 shows that most of the countries start to decrease their tax rates especially in 2005. There seems to be reductions in tax rate for some countries between 2005 and 2008.
Table 2 presents summary statistics of the country-specific characteristics. The average country in our sample has a FDI percentage of 3.46 % and
GDP growth rate of 1.94%. Unemployment rate account for 8.03% of total labor force. The average country in our sample reports inflation of 2.73% a year. Population growth accounts for 0.55% and openness level is 0.90 of GDP. The average country has corporate tax rate of 26.33% and has tax revenue of 36.43. Finally, we report summary statistics of the KKM governance variables. Most of the governance variables and the average value of them (KKM) have an average of one or above which indicates high quality of the governance for our sample countries.
Table 1: Corporate Income Tax Rates 2003 2004 2005 2006 2007 2008 2009 2010 2011 2012 2013 Austria 34,0 34,0 25,0 25,0 25,0 25,0 25,0 25,0 25,0 25,0 25,0 Canada 24,1 22,1 22,1 22,1 22,1 19,5 19,0 18,0 16,5 15,0 15,0 Czech Republic 31,0 28,0 26,0 24,0 24,0 21,0 20,0 19,0 19,0 19,0 19,0 Denmark 30,0 30,0 28,0 28,0 25,0 25,0 25,0 25,0 25,0 25,0 25,0 Estonia* 26,0 26,0 24,0 23,0 22,0 21,0 21,0 21,0 21,0 21,0 21,0 Finland 29,0 29,0 26,0 26,0 26,0 26,0 26,0 26,0 26,0 24,5 24,5 France* 35,4 35,4 35,0 34,4 34,4 34,4 34,4 34,4 34,4 34,4 34,4 Germany* 28,0 26,4 26,4 26,4 26,4 15,8 15,8 15,8 15,8 15,8 15,8 Greece 35,0 35,0 32,0 29,0 25,0 25,0 25,0 24,0 20,0 20,0 26,0 Israel* 36,0 35,0 34,0 31,0 29,0 27,0 26,0 25,0 24,0 25,0 25,0 Italy* 34,0 33,0 33,0 33,0 33,0 27,5 27,5 27,5 27,5 27,5 27,5 Korea 27,0 27,0 25,0 25,0 25,0 25,0 22,0 22,0 22,0 22,0 22,0 Netherlands 34,5 34,5 31,5 29,6 25,5 25,5 25,5 25,5 25,0 25,0 25,0 New Zealand* 33,0 33,0 33,0 33,0 33,0 30,0 30,0 30,0 28,0 28,0 28,0 Poland 27,0 19,0 19,0 19,0 19,0 19,0 19,0 19,0 19,0 19,0 19,0 Slovenia 25,0 25,0 25,0 25,0 23,0 22,0 21,0 20,0 20,0 18,0 17,0 Spain 35,0 35,0 35,0 35,0 32,5 30,0 30,0 30,0 30,0 30,0 30,0 Turkey 30,0 33,0 30,0 20,0 20,0 20,0 20,0 20,0 20,0 20,0 20,0 United Kingdom* 30,0 30,0 30,0 30,0 30,0 28,0 28,0 28,0 26,0 24,0 23,0
Table 2: Descriptive Statistics of Dependent and Independent Variables
Variable N MEAN SD p25 p50 p75 FDI 219 3.461 5.039 1.013 2.121 3.930 GDP 219 1.938 3.389 .431 2.285 3.706 INF 220 2.729 2.433 1.52 2.293 3.276 POP 220 .552 .584 .210 .468 .80 UNEMP 220 8.03 4.022 5.4 7.5 9.2 TAX 220 26.334 5.443 22 26 30 REV 198 36.430 6.184 32.3 35.7 42.5 OPEN 216 .895 .360 .589 .791 1.118 VO 200 1.148 .418 .965 1.19 1.46 PS 200 .562 .693 .345 .77 1.03 GE 200 1.32 .575 .93 1.375 1.77 RQ 200 1.266 .432 .935 1.3 1.64 RL 200 1.243 .552 .855 1.22 1.76 CC 200 1.238 .810 .46 1.31 1.975 KKM 200 1.130 .525 .74 1.16 1.61
Notes: Mean, median (p50), standard deviation (SD), 25th percentile (p25) and 75th percentile (p75) are reported. N is the number of
observations. FDI is Foreign Direct Investment inflows divided by GDP. TAX is corporate income tax rate, GDP is GDP growth rate, INF is inflation rate, POP is rate of growth of population, UNEMP is unemployment rate, REV is tax revenue as a percentage of GDP, OPEN is openness which is the ratio of trade (exports and imports) to GDP. VA is Voice and Accountability; PS is Political Stability and Absence of Violence; GE is Government Effectiveness; RQ is Regulatory quality; RL is Rule of Law; CC is Control of Corruption. KKM is the average of the six KKM is Kaufmann, Kraay and Mastruzzi governance indicators.
4. EMPIRICAL RESULTS
We first examine the relation between FDI and corporate tax rate at univariate level. We determine a dummy variable which is equal to 1 for the years after 2005 and zero otherwise. We choose 2005 to compare the FDI percentages because of the higher number of countries dropped their corporate tax levels in 2005. As we have report in Table 1, most of the countries in our sample start to decrease their corporate tax levels in 2005. We suppose that since
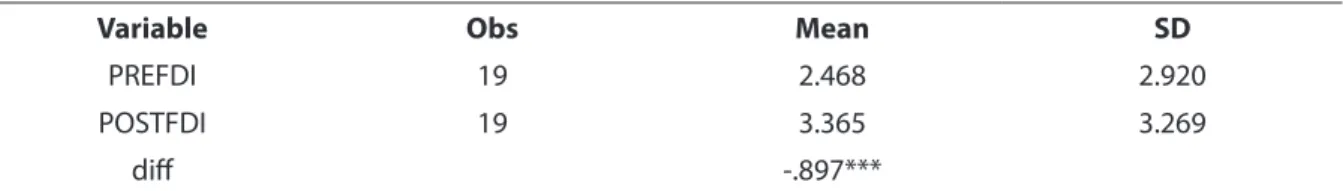
tax levels start to decline in 2005 at most, we should see its impact on FDI after 2005. We expect to find a higher level of FDI post 2005. In order to test this expectation at univariate level, we simply run a t-test which is reported in Table 3. According to Table 3, higher level of FDI is more pronounced post-2005 than in pre-2005. The average FDI is 2.47% pre-2005 and it is 3.36% post-2005. The difference is negative and highly economically and statistically significant, at -0.90% (p-value<0.03). This result shows a higher FDI post-2005 compare to pre-2005.
Table 3: Univariate Result- t-test
Variable Obs Mean SD
PREFDI 19 2.468 2.920
POSTFDI 19 3.365 3.269
diff -.897***
Notes: This table reports the univariate analyses carried out to show the impact of corporate tax rate on FDI levels. We test the difference
in the mean values of FDI levels pre (PREFDI) and post 2005 (POSTFDI). Obs is the number of observations. Mean is the mean value of institutional investment.
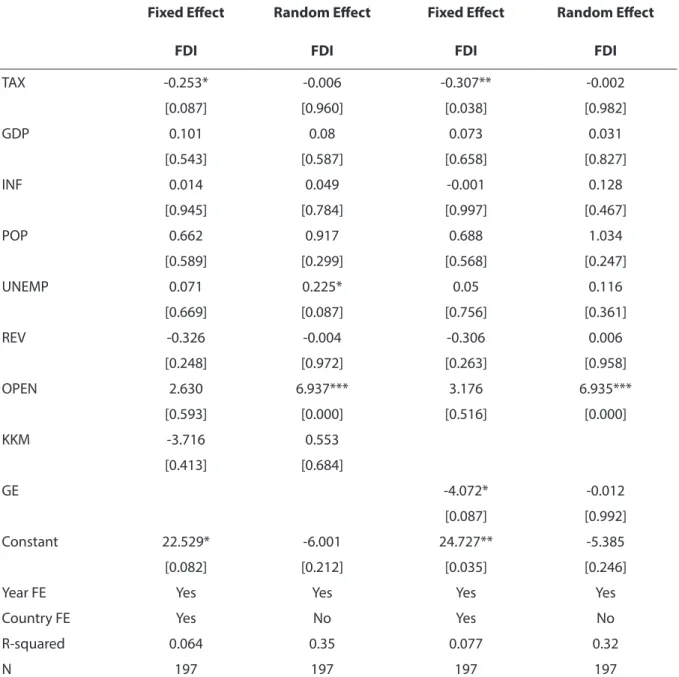
In order to examine the effect of corporate tax rate changes on FDI level at multivariate level, we run a fixed effect panel regression to test model 1. Table 4 reports the results of fixed effect panel regression where the dependent variable is FDI. In column 1 of Table 4, we use average of KKM as one of the independent variable and in column 3 of Table 4, we only use ‘Governance Effectiveness’ indicator as one of the independent variables4. According to our reported results, FDI is higher in the countries whose corporate tax rates are at low levels. This result is in line with our argument which states that as corporate
tax rate decreases, FDI increase. In this table, we also analyse the effect of country level quality on FDI levels. We only find a positive significant coefficient for GE which shows that for the foreign investors, in our sample, effective governance is an important determinant. We neither find a significant coefficient for KKM or other World Bank Development Indicators (unreported results). In Table 4, we also report the random effect panel regression results. Since we reject the null hypothesis of Hausman test, we use fixed effect model to test our hypothesis.
Table 4: The Effect of Corporate Tax on Foreign Direct Investment
Fixed Effect Random Effect Fixed Effect Random Effect
FDI FDI FDI FDI
TAX -0.253* -0.006 -0.307** -0.002 [0.087] [0.960] [0.038] [0.982] GDP 0.101 0.08 0.073 0.031 [0.543] [0.587] [0.658] [0.827] INF 0.014 0.049 -0.001 0.128 [0.945] [0.784] [0.997] [0.467] POP 0.662 0.917 0.688 1.034 [0.589] [0.299] [0.568] [0.247] UNEMP 0.071 0.225* 0.05 0.116 [0.669] [0.087] [0.756] [0.361] REV -0.326 -0.004 -0.306 0.006 [0.248] [0.972] [0.263] [0.958] OPEN 2.630 6.937*** 3.176 6.935*** [0.593] [0.000] [0.516] [0.000] KKM -3.716 0.553 [0.413] [0.684] GE -4.072* -0.012 [0.087] [0.992] Constant 22.529* -6.001 24.727** -5.385 [0.082] [0.212] [0.035] [0.246]
Year FE Yes Yes Yes Yes
Country FE Yes No Yes No
R-squared 0.064 0.35 0.077 0.32
N 197 197 197 197
Notes: This table presents the results of fixed effect and random effect panel regressions. Dependent variable is Foreign Direct Investment
inflows (FDI) divided by GDP. TAX is corporate income tax rate, GDP is GDP growth rate, INF is inflation rate, POP is rate of growth of population, UNEMP is unemployment rate, REV is tax revenue as a percentage of GDP, OPEN is openness which is the ratio of trade (exports and imports) to GDP, KKM is the average of 6 Kaufmann, Kraay and Mastruzzi governance indicators , GE is governance effectiveness. Year dummies (Year FE) and country dummies (Country FE) are included in all regressions. The numbers in brackets are p-values. * indicates 10% significance level, ** indicates 5% significance level and *** indicates 1% significance level. N is the number of observation
5. DYNAMIC PANEL REGRESSION RESULTS
In order to deal with endogeneity issue we use GMM tests as well. Since the countries determine their foreign direct investment levels by taking into account previous year’s FDI levels, we use a dynamic model in order to test our hypothesis. In addition, control variables might not be endogenous and the shocks that affect FDI in some countries might
affect some of the control variables. As a solution to this problem, we use an instrumental variable estimation method, one step GMM. In this model, the one period lagged dependent variable is used as an endogenous variable (FDIt-1) and lagged levels of the dependent variable dated t-2 and t-3 are included as instruments. The validity of instruments is tested by Sargan test. Since the null can not be rejected,
the instruments used in this study are valid and are not correlated with the error term. Table 5 shows the GMM estimation results. We find that when we take into account endogeneity issue, FDI is still negatively affected by corporate tax rate. We also find a positive relation between FDI and GDP growth at %5 significance level. Therefore, we can conclude
that there are better growing opportunities in the rapidly growing economies (Charkrabarti, 2001) and investment in these countries is high. Openness and GE measure negatively affect FDI. The table shows that a country’s degree of openness to international trade has a negative effect on FDI.
Table 5: Dynamic Panel Regression Results
FDI FDI FDIt-1 -0.262** -0.270** [0.041] [0.032] TAX -0.515** -0.500** [0.019] [0.022] GDP 0.512** 0.534** [0.015] [0.010] INF 0.466 0.495 [0.322] [0.283] POP 0.95 0.615 [0.632] [0.753] UNEMP 0.284 0.295 [0.275] [0.241] REV -0.156 -0.202 [0.752] [0.678] OPEN -17.729** -20.021*** [0.011] [0.005] KKM -10.556 [0.199] GE -7.764* [0.071] Constant 46.281* 48.029** [0.060] [0.035] Sargan 0.97 0.94 N 157 157
Notes: This table presents the results of one step GMM estimation results. Dependent variable is Foreign Direct Investment inflows (FDI)
divided by GDP. TAX is corporate income tax rate, GDP is GDP growth rate, INF is inflation rate, POP is rate of growth of population, UNEMP is unemployment rate, REV is tax revenue as a percentage of GDP, OPEN is openness which is the ratio of trade (exports and imports) to GDP, KKM is the average of 6 Kaufmann, Kraay and Mastruzzi governance indicators , GE is governance effectiveness. Year dummies (Year FE) and country dummies (Country FE) are included in all regressions. The numbers in brackets are p-values. ***, **, and * denote significance at the 1%, 5% and 10% levels, respectively. N is the number of observations. Sargan test is a test of overidentifying restrictions and it is distributed as chi-square under the null of instrument validity.
5. CONCLUSION
Nearly all of the countries around the world have their own characteristics. But corporate tax rate has a
relevant factor for attracting foreign direct investors. Therefore, many countries have been developed some tax instruments to foster the foreign investment
to their countries. The main reason for exhibiting tax advantages to foreign direct investment is to achieve the country’s economic goals, such as economic growth, economic stability and etc.
According to our empirical results, it is finalized that the corporate income tax rate has a significant impact on FDI inflows in selected OECD members over the period 2003-2013. As a result we can state that FDI is attracted by the lower tax rate. In our dynamic panel regression results, we find that GDP growth positively affects FDI as in Billington
(1999). We do not find a significant coefficient for population variable and unemployment variable in line with Kristjánsdóttir (2005) and Clausing (2007), respectively. Coefficient of inflation variable is not significant as in Sato (2012).
To summarize, FDI levels is higher in countries which offer more advantages. Location decision is all about making more profit. The reduced corporate tax rate performs lower tax burden and in connection with play a big role in increasing FDI inflows.
END NOTES
1Since World Bank does not provide data for unemployment variable for 2013, we collect unemployment data from International Labour
Organization website for 2013.
2Countries that do not show a decrease in corporate tax rate or those show an increases in tax rates are not included in the dataset. 3In particular, Botric and Skuflic (2006) and Cak and Karakas (2009).
4We used each of the KKM indicators as independent variables in different regressions (unreported results). However, only ‘Governess
Efectiveness’ gives us a significant result.
REFERENCES
Agostini C. (2007) “The Impact of State Corporate Taxes on FDI Location” Public Finance Review, 35 (3): 335-360.
Beltratti, A. and Stulz, R.M. (2009) “Why did some banks perform better during the credit Crisis? A cross-country study of the impact of governance and regulation” Fisher College of Business Working Paper. Bengoa, M. and Sanchez-Robles, B. (2003) “Foreign direct investment, economic freedom and growth: New evidence from Latin America” Eur. J. Polit. Econ, 19: 529–545.
Billington, N. (1999) “The Location of Foreign Direct Investment: An Empirical Analysis” Applied Economics, 31: 65–76.
Botric, V. and Skuflic, L. (2006) “Main Determinants of Foreign Direct Investment in the Southeast European Countries” Transition Studies Review, 13 (2): 359-377 Cak, M. and Karakas, M. (2009) “Doğrudan Yabancı Sermaye Yatırımlarını Belirleyen Unsurlar ve Etkileri”
Marmara Universitesi I.I.B.F Dergisi, 26(1): 43-54.
Cassou, S. P. (1997) “The Link Between Tax Rates and Foreign Direct Investment” Applied Economics, 29: 1295-1301.
Charkrabarti, A. (2001) “The Determinants of Foreign Direct Investment: Sensitivity Analyses of Cross-Country Regressions”, Kyklos, 54(1): 89-114.
Clausing, K. A. (2007) “Corporate Tax Revenues in OECD Countries”, International Tax and Public Finance, 14 (2): 115-133.
Culem, C. G. (1988) “The Locational Determinants of Direct Investments Among Industrialized Countries”
European Economic Review, 32: 885–904.
Cummins, J.G. and Hubbard, R.G. (1995) “The Tax Sensitivity of Foreign Direct Investment: Evidence from Firm-Level Panel Data” The Effects of Taxation on
Multinational Corporations (ed. M. Feldstein, J.R. Hines
and R.G. Hubbard), National Bureau of Economic Research: 123- 152.
Demirhan, E. and Masca, M. (2008) “Determinants of Foreign Direct Investment Flows to Developing Countries: A Cross-sectional Analysis” Prague
Economic Papers, University of Economics, Prague.
Devereux, M.P. and Freeman, H. (1995) “The Impact of Tax on Foreign Direct Investment: Empirical Evidence and the Implications for Integration Schemes”
International Tax and Public Finance, 2: 85- 106.
Devereux, M.P. and Griffith, R. (2002) “The Impact of Corporate Taxation on the Location of Capital: A Review” Swedish Economic Policy Review, 9: 79- 102. Devereux, M.P. and Maffini, G. (2006) “The Impact of Taxation on the Location of Capital, Firms and Profit: A Survey of Empirical Evidence” April, 1- 52, http:// www.ifs.org.uk/ conferences/etpf_devereux.pdf (16.10.2014).
Diamond J., Zodrow G. and Carroll, R. (2013) “Macroeconomic Effects of Lower Corporate Income Tax
Dunning, J. H. (1988) “The Eclectic Paradigm of International Production: A Restatement and Some Possible Extensions” Journal of International Business
Studies, 19 (1): 1-31.
Edwards, S. (1990) “Capital Flows, Foreign Direct Investment, and Debt-Equity Swaps in Developing Countries” National Bureau of Economic Research (Cambridge, M. A.), Working Paper No. 3497.
Egger, P. and Raff, H. (2011) “Tax Rate and Tax Base Competition for Foreign Direct Investment” Kiel
Working Papers, No: 1734, September.
Gordon, Roger H., and James R. Hines Jr. (2002) “International Taxation.” In Handbook of Public
Economics, Vol. IV, eds. Alan Auerbach and Martin
Feldstein, 1935-1995. Amsterdam: North-Holland. Gropp, R. and Kostial, K. (2000) “The Disappearing Tax Base: Is Foreign Direct Investment (FDI) Eroding Corporate Income Taxes?” IMF Working Paper, October. Helpman, E., Melitz, M. J. and Yeaple, S. A. (2004) “Export versus FDI with heterogeneous firms” American Economic Review, 94(1): 300–16.
Jun, J. (1994) “How Taxation Affects Foreign Direct Investment (Country-specific Evidence)” Policy
Research Working Paper, The World Bank, No: 1307,
June.
Kaufmann, D., Kraay, A. and Mastruzzi, M. (2007) “Governance matters VI: aggregate and individual governance indicators 1996-2006” World Bank Policy
Research Working Paper, No 4280.
Kemsley, D. (1998) “The Effect of Taxes on Production Location” Journal of Accounting Research. 36: 321–341. Kristjánsdóttir, H. (2005) “Determinants of Foreign Direct Investment in Iceland” Centre for Applied Microeconometrics. Department of Economics, University of Copenhagen.
Mooij R.A. and Ederveen, S. (2005) “How Does Foreign Direct Investment Respond to Taxes? A meta-Analysis” Conference on Foreign Direct Investment and
Taxation, 3 October 2005: 1-32.
Morrissey, O. and Y. Rai (1995) “The GATT Agreement on Trade Related Investment Measures: Implications for Developing Countries and their Relationship with Transnational Corporations” Journal of Development
Studies, 31(5): 702-724
Morisset, J. and Pirnia, N. (1999) “How Tax Policy and Incentives Affect Foreign Direct Investment: A Review” World Bank Policy Research Working Paper, No. 2509, November.
Mottaleb, K. A. and Kalirajan, K. (2010) “Determinants of Foreign Direct Investment in Developing Countries: A Comparative Analysis” ASARC Working Paper
2010/13, Australian National University, Australia
South Asia Research Centre
Nigh, D. (1985) “The Effect of Political Events on United States Direct Foreign Investment: A Pooled Time-series Cross-sectional Analysis” Journal of
International Business Studies, 16: 1–17.
OECD (2007) “Tax Effects on Foreign Direct Investment (Recent Evidence and Policy Analysis)” OECD Tax
Policy Studies, No: 17.
OECD (2014) Statistics http://stats.oecd.org/ Index.aspx?DatasetCode=FDI_FLOW_ PARTNER# (26.05.2015)
Pistoresi, B. (2000) “Investimenti diretti esteri e fattori di localizzazione: L’America Latina e il Sud Est asiatico”
Rivista di Politica Economica, 90: 27– 44.
Porcano, T. M. and C. E. Price (1996) “The Effects of Government Tax and Non-tax Incentives on Foreign Direct Investment” Multinational Business Review, 4: 9–20.
Sanjo, Y. (2012) “Country risk, country size, and tax competition for foreign direct investment”
International Review of Economics and Finance, 21:
292-301.
Sato, T. (2012) “Empirical Analysis of Corporate Tax and Corporate Tax and Foreign Direct Investment”
Public Policy Review, 8 (1): 1-20.
Schneider, F. and Frey, B. (1985) “Economic and Political Determinants of Foreign Direct Investment”
World Development, 13(2): 161-175.
Scholes M.S., and Wolfson M.A., (1992) Taxes and
business strategy: A planning approach Prentice-Hall,
Englewood Cliffs, NJ.
Shahzad N. and Zahid M. (2011) “The Determinants of Foreign Direct Investment in Pakistan” Abasyn Journal
of Social Sciences, 5(1): 111-121.
Swenson, D.L. (1994) “The Impact of U.S. tax reform on Foreign Direct Investment in the United States”
Journal of Public Economics, 54: 243-266.
Sudsawasd, S. (2008) “Taxation, Business Regulation and Foreign Direct Investment In East Asia” in Soesastro. H. (ed), Deepening Economic
Integration-The ASEAN Economic Community and Beyond-, ERIA Research Project Report 2007-1-2, Chiba: IDE-JETRO:
239-265.
Wisniewski, T.P. and Pathan, S.M. (2014) “Political Environment and Foreign Direct Investment:
Evidence from OECD countries” European Journal of
Political Economy, 36: 13-23.
Young, K.H. (1988) “The Effects of Taxes and Rates of Return on Foreign Direct Investment in the United States” National Tax Journal, 41 (1): 109-121.
Yulin, N. and M. R. Reed (1995) “Locational Determinants of U. S. Direct Foreign Investment in Food and Kindered Products” Agrobusiness, 11: 77– 86.