Full Terms & Conditions of access and use can be found at
https://www.tandfonline.com/action/journalInformation?journalCode=uawm20
ISSN: 1096-2247 (Print) 2162-2906 (Online) Journal homepage: https://www.tandfonline.com/loi/uawm20
Effect of Meteorological Parameters on Fine and
Coarse Particulate Matter Mass Concentration in a
Coal-Mining Area in Zonguldak, Turkey
Lokman Hakan Tecer , Pinar Süren , Omar Alagha , Ferhat Karaca & Gürdal
Tuncel
To cite this article:
Lokman Hakan Tecer , Pinar Süren , Omar Alagha , Ferhat Karaca & Gürdal
Tuncel (2008) Effect of Meteorological Parameters on Fine and Coarse Particulate Matter Mass
Concentration in a Coal-Mining Area in Zonguldak, Turkey, Journal of the Air & Waste Management
Association, 58:4, 543-552, DOI: 10.3155/1047-3289.58.4.543
To link to this article: https://doi.org/10.3155/1047-3289.58.4.543
Published online: 24 Jan 2012.
Submit your article to this journal
Article views: 1162
View related articles
Effect of Meteorological Parameters on Fine and Coarse
Particulate Matter Mass Concentration in a Coal-Mining Area
in Zonguldak, Turkey
Lokman Hakan Tecer and Pinar Su
¨ ren
Department of Environmental Engineering, Balikesir University, Balikesir, Turkey
Omar Alagha and Ferhat Karaca
Department of Environmental Engineering, Fatih University, Istanbul, Turkey
Gu
¨ rdal Tuncel
Department of Environmental Engineering, Middle East Technical University, Ankara, Turkey
ABSTRACT
In this work, the effect of meteorological parameters and local topography on mass concentrations of fine (PM2.5) and
coarse (PM2.5–10) particles and their seasonal behavior was
investigated. A total of 236 pairs of samplers were collected using an Anderson Dichotomous sampler between Decem-ber 2004 and OctoDecem-ber 2005. The average mass concentra-tions of PM2.5, PM2.5–10, and particulate matter less than 10
m in aerodynamic diameter (PM10) were found to be
29.38, 23.85, and 53.23g/m3, respectively. The
concentra-tions of PM2.5and PM10were found to be higher in heating
seasons (December to May) than in summer The increase of relative humidity, cloudiness, and lower temperature was found to be highly related to the increase of particulate matter (PM) episodic events. During non-rainy days, the episodic events for PM2.5and PM10were increased by 30
and 10.7%, respectively. This is a result of the extensive use of fuel during winter for heating purposes and also because of stagnant air masses formed because of low temperature and low wind speed over the study area.
INTRODUCTION
Globally, anthropogenic air pollutants have intensified in the atmosphere of metropolitan cities and downtown locations. It is known that air pollutants have adverse effects on humans as well as the environment.1–11 The
close relationship between unfavorable health conditions and urban air pollution has increased the interest in stud-ies aimed to improving the air quality of urban areas. The
European Council (EC) renewed the daily and annual air quality limits (Directive 1999/30/EC). Because of the ad-verse effects of air quality, especially atmospheric partic-ulate matter (PM), there are numerous studies on tempo-ral and seasonal variations12–14and also on the effects of
meteorological factors on PM.15,16 European researches
on air quality carried out within the Forecasting Urban Meteorology, Air Pollution, and Population Exposure (FUMAPEX) and the European Cooperation in the Field of Scientific and Technical Research (COST) 715 projects17–19
employed air quality modeling systems for long-term air quality evaluation to minimize public health risk. The outcomes of these studies were used for urban planning and the design and management of transportation of industrial and residential areas
PM is a complex mixture of dry, solid particles, solid cores with liquid coatings, and small liquid droplets. These particles vary greatly in their physical and chemical properties, which are shape, size, solubility, residence time, reactivation, toxicity, and chemical composition and structure. In addition to the definition of these prop-erties, determination of pollution reduction strategies also depends on the definition of their pollution sources. The local and regional meteorology, wind speed, wind direction, atmospheric stability, long-range transport, and pollution dispersion are all factors that play an im-portant role in PM concentration reduction strategies. Analysis of local and regional meteorology is important to fully understand the processes responsible for the spatial and temporal distribution of PM.15,16,20 –24
There is an increasing demand on energy related to the rapid growth rate of industries and the population in Turkey. Although there was an increase in the use of natural gas during the last decade, coal remains a primary source of energy production in Turkey. Turkey produces a considerable amount of coal (1.5 to 2 million t/yr) for its national usage, and of its cities Zonguldak is the major coal-mining city located in the Black Sea region. In addi-tion to the utilizaaddi-tion of coal as an energy source, the emission of PM from various mining operations deterio-rate the air quality.17–19Sources of air pollution because of IMPLICATIONS
This study was conducted in the city of Zonguldak, which is a city where a large reservoir of coal is located and its economy mainly depends on the coal-mining industry. The coal-mining activities have been criticized because they adversely affect both human health and air quality in the city. In Zonguldak, chronic respiratory, asthma, and chronic bronchitis patients are considered above normal preva-lence in Turkey. This study is the first to be conducted in the city of Zonguldak.
TECHNICAL PAPER
ISSN:1047-3289 J. Air & Waste Manage. Assoc. 58:543–552 DOI:10.3155/1047-3289.58.4.543coal-mining activities generally include drilling, blasting, coal loading and unloading, road transport, coal handling plants, and exposed pit faces.
This study was carried out in Zonguldak, a city where a large reservoir of coal is located and its economy mainly depends on the coal-mining industry. Coal-mining activ-ities have been criticized because they adversely affect both human health and air quality in the city.25,26 In
Zonguldak, chronic respiratory, asthma, and chronic bronchitis patients are considered above the normal prev-alence in Turkey.27To our knowledge, there are no other
studies considering the effects of Turkish coal-mining ac-tivities along with coal combustion on urban air quality to date; therefore this study carried out in Zonguldak, Turkey is the first of its kind.
The aims of this work include the evaluation of: (1) seasonal and temporal variations of fine (PM2.5),
coarse (PM2.5–10),and PM less than 10m in
aero-dynamic diameter (PM10) mass concentrations;
(2) correlations between PM fractions,
(3) the effects of meteorology over PM fractions; and (4) Turkish coal-mining activities and coal
combus-tion-related air quality of the city. EXPERIMENTAL METHODS AND DATA ARCHIVING
Sampling Site
Zonguldak is a city located in the western Black Sea region of Turkey (41 °27⬘ N, 31 °46⬘ E). The city has rough ground with an area consisting of approximately 56% mountains, 31% level ground, and 13% valley area. The population of the city is approximately 110,000. The city has produced coal since 1948; accordingly, its economy is related to coal and coal-production industries. The State-owned coal company Turkish Hardcoal Enterprise pro-duces, processes, and distributes hard coal (1.5–2 million t/yr) at the Kozlu, Uzulmez, and Karadon coal-mining sites located 5 km west, 7 km south, and 12 km east of Zonguldak city center, respectively (Figure 1). Produced coal, which is used mainly for power generation (66% utilized by C¸ ates), steel production (Erdemı˙r), and domes-tic heating, is generally of poor quality with low calorific value, containing 0.8% sulfur, 13 ⫾ 2% ash, and 2% moisture. Erdemı˙r is a steel company that has a high pro-duction capacity (3 million t/yr) and is considered the larg-est energy utilization steel production facility in Turkey.
Settlement in the city has increased and developed as metallurgical workers settle in the city center. The coal-mining industry; the electric power plant (C¸ ates), which is located 13 km northeast of the city center; the Demir-C¸ elik steel factory (Erdemı˙r), which is located at 40 km to the southwest of the city center; and a paper factory (Seka), which is located 35 km to the southwest of the city center, have all contributed to the problem of local indus-trial air pollution in the city. In addition, domestic heat-ing and mobile sources have also made an important contribution to the increased problem of PM.
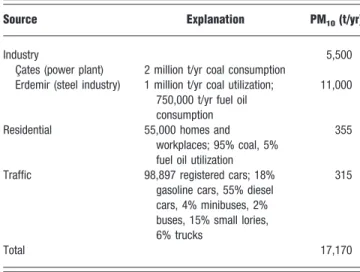
An emission inventory of the region in terms of major PM source categories are defined and in Table 1. They are classifieds as (1) the combustion-related emissions of the important industrial point sources, C¸ ates and Erdemı˙r; (2) combustion-related emission sources; (3) domestic space-heating-related emissions; and (4) traffic-related tailpipe emissions. In the calculation of the amount of the emissions for each category, the U.S. Environmental Protection Agency (EPA) emissions factors were used.28 –31In these
cal-culations some parameters such as the daily coal usage, total number of houses, yearly fuel consumption, and the shares of the fuel types (coal, fuel, oil), registered number of cars and vehicles, their engine types, and estimated mileages were collected and/or calculated from related authorities like the management at the factories, city management, and the Turkish Statistical Institute.32
Sampling, Analyzing, Method, and Period A total of 236 pairs of PM2.5 and PM2.5–10 samples were
collected between December, 25, 2004, and October 9, 2005. The selection of the sampling site was done follow-ing the EPA guidelines.33
The PM sampling station selection was decided after a careful evaluation of the meteorological, topographical, land-use, and PM potential sources affecting the area. Accordingly, the selected sampling site represents an ur-ban background. Consequently, a Dichotomous sampler was placed in the city center of Zonguldak, specifically at the campus of Karaelmas University. The site is approxi-mately 4 m above sea level at coordinates 41.4508 ° N, 31.7726 ° E as seen in Figure 1. The site was not under significant influence from nearby stationary fossil fueled combustion sources. Furthermore, the sampler was 100 m away from the nearest motorway and away from human curiosity and vandalism.
The collection of PM2.5and PM2.5–10was performed
using an Anderson automatic Dichotomous sampler (se-ries 245). The sampler has a cutoff for PM greater than 10 m; the mass of the entered particles was divided into PM2.5 aerodynamic size and collected on a separate
37-mm diameter ringed Teflon filter (pore size equivalent to 2.5m) and PM2.5–10was collected on another filter.
The sampler has a total volume flow of 1 m3/hr.
The filter was conditioned in a desiccator for 24 hr before weighing with an accurate four-digit balance. The filters were placed in pre-acid-washed standard filter ring holder and situated in the sampler carousel to be ready for sampling. To prevent contamination of the filters during transportation, the carousel was covered with a special covering tray. After a 24-hr sampling period, the filters carousel was brought to the laboratory and the filters were
placed in the desiccator again for 24 hr before determin-ing the weight of the filter with the sample. For accuracy of the PM mass determination, the method of weighing was repeated three times until constant weight (uncer-tainty⫾ 0.0002) was gained. The method used by Karaca et al.34was followed for the collection of the mass
con-centrations of PM2.5,PM2.5–10, and PM10(total of PM2.5
and PM2.5–10) and the gravimetric measurements. Meteorological Data
The Zonguldak area is typified by temperate atmospheric conditions near the Black Sea. However, going inland from the coastal area the weather becomes colder. The city is affected by marine and terrestrial winds of 2.4 m/sec on average. The dominant meteorological condi-tions are high humidity (82% relative humidity [RH]) and foggy weather. The meteorological parameters such as wind speed and direction, temperature, humidity, rain volume, and cloudiness were obtained from the nearby governmental meteorology station for the study period and are given in Figure 2.
Statistical Analysis
The correlation between the observed PM concentration and meteorological parameters were investigated utilizing different tools including descriptive statistics, correlation analysis, classification, and cross-table tools. The annual, monthly, and daily variation and correlations between PM2.5and PM10were investigated in particular. To
eluci-date these relationships multiple correlation methods were applied.
The relationship between PM mass concentrations and meteorological parameter characteristics were deter-mined using classification and cross-table techniques. These methods were used to:
(1) classify sampling days from December 2004 to October 2005 according to PM2.5and PM10
con-centrations;
(2) classify episode days and meteorological charac-teristics; and
(3) determine key relationships and parameters that lead to different PM2.5and PM10concentrations.
Percentile range of dependent (PM2.5, PM10) and independent
(meteorological parameters) variables were used to separate
and group days into classes. This analysis provides informa-tion about the condiinforma-tions that are associated with episodes days of PM2.5, PM10concentrations, as well as the frequency
of occurrence of different types of conditions. Classification categories of PM2.5, PM10, and meteorological parameters
defined by percentiles are given in Table 2.
The direction of the maximum wind speed was as-signed a number between 1 and 16, it was arranged into order and numbered as north⫽ 1 and north-northwest ⫽ 16. The rainy days were classified as wet and non-rainy days as dry (“rainy day” is defined as a day on which any rainfall was recorded, i.e.,⬎0.8 mm/day).
RESULTS AND DISCUSSION
PM Mass Concentrations
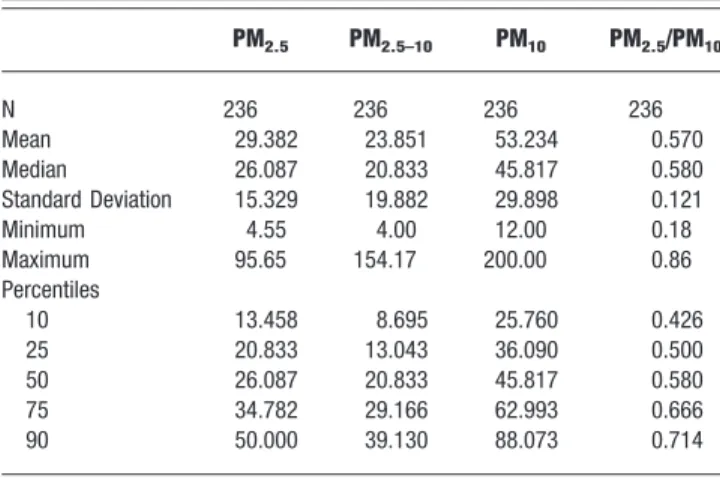
The average mass concentration of PM2.5 and PM2.5–10
particles during the study period was found as 29.38 g/m3and 23.85g/m3, respectively. General descriptive
statistics results for PM mass concentration are given in Table 3. The results given include all data collected during the sampling period. The annual average value for PM10
was calculated as 53.23g/m3.
For the year 2005, European urban background value for PM10was calculated as 16.9g/m
3, with the averages of
PM10 concentrations of 32 European countries showing
considerable differences. For the year 2004, European PM10
yearly average concentration was calculated using data from 742 urban background sites and reported as 26g/m3.35,36
However, the highest urban background concentrations were reported in cities in central eastern and southern Eu-ropean countries. EPA’s yearly average limit value of 60 g/m3was exceeded in the cities of Sofia, Milano, Provdiv,
and Rybrile during 2005.35In this study, the measured
con-centrations of PM fractions were higher than many Euro-pean cites. In addition, PM2.5and PM10mass concentrations
were 38 and 105% higher than the European urban back-ground value but not higher than the limit value. The com-parisons of the measured mass concentrations of this study with other literature values are given in Table 4.
The annual average value for PM10was less than the
EPA annual average limit of 60g/m3. However, the
an-nual average European Union (EU) limit value for PM10
(40 g/m3) is lower than the corresponding measured
values at the sampling site. Our value is 33% higher than the limit value. In some European countries (Bulgaria, Poland, Italy, and the Czech Republic) the limit value was exceeded in 69 and 89 stations during 2004 and 2005, respectively.35 EPA annual average limit for PM
2.5 is 15
g/m3, and the measured PM
2.5 value at Zonguldak was
29.38g/m3, approximately twice the EPA limit value.
Figure 3 shows the histogram of the collected data, and the corresponding percentiles of the exceeding num-ber of the daily EU limits was calculated. During the study period, 62% of PM10concentrations were under the
50-g/m3limit value whereas this limit value was exceeded
in 38% of the cases. The EU daily limit value for PM10(50
g/m3) was exceeded 89 times in Zonguldak during the
study period. Larssen et al.35 reported that the EU PM 10
daily limit was exceeded 99 times in Ispra, Italy and 40 times in Illmitz, Austria during 2005.
EC set up a target value for yearly average of atmo-spheric PM2.5 of 25g/m
3to be operative in 2012, but Table 1. PM emission inventory for Zonguldak, Turkey.
Source Explanation PM10(t/yr)
Industry 5,500
Çates (power plant) 2 million t/yr coal consumption Erdemı˙r (steel industry) 1 million t/yr coal utilization;
750,000 t/yr fuel oil consumption
11,000
Residential 55,000 homes and workplaces; 95% coal, 5% fuel oil utilization
355
Traffic 98,897 registered cars; 18% gasoline cars, 55% diesel cars, 4% minibuses, 2% buses, 15% small lories, 6% trucks
315
Total 17,170
this limit is now in use in the World Health Organization (WHO) criteria for a 24-hr PM2.5daily limit. This target
value was also not fulfilled in Zonguldak. During the study period, the average mass of PM2.5 particles was
29.38g/m3, which is 18% higher than the target value.
This limit value was exceeded 122 times, which accounts for almost half of our sampling days (Figure 3). Similar
results were reported for the stations located in Ispra, Italy (162 times) and in Illmitz, Austria (104 times) for 2005.42
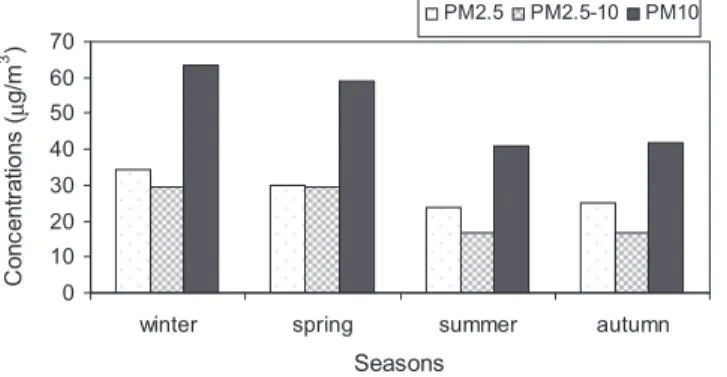
Seasonal, Monthly, and Daily Variations To understand the general trend of the measured mass con-centration, the seasonal, monthly, and daily variations of PM2.5, PM2.5–10,and PM10were graphically investigated. To
understand the change of PM concentration throughout a whole year, seasonal mean concentrations were calculated. The mean mass concentrations of PM2.5and PM10during
the heating season, which includes both winter and spring, were 34.17 and 63.59g/m3for winter and 29.84 and 59.16
g/m3 for spring, respectively. Consequently, the mean
mass concentrations of PM2.5 and PM10 for summer and
autumn were 25.03 and 41.83g/m3, and 23.03 and 39.66
g/m3, respectively. When compared with studies given in
Table 5, our values are in accordance with research con-ducted by other researchers. Our results were slightly higher
0 2 4 6 8 10 12 14 16 De c -0 4 J an-05 Fe b -0 5 Ma r-0 5 Ap r-0 5 Ma y -0 5 J un-05 Ju l-0 5 A ug-05 S ep-05 Oc t-0 5 Months Precipitation (mm) 0 20 40 60 80 100 De c -0 4 J an-05 F eb-05 Ma r-0 5 Ap r-0 5 Ma y -0 5 J un-05 Ju l-0 5 A ug-05 S ep-05 Oc t-0 5 Months R e la tiv e H u m u d ity ( % ) 0 5 10 15 20 25 De c -0 4 J an-05 F eb-05 Ma r-0 5 Ap r-0 5 Ma y -0 5 J un-05 Ju l-0 5 A ug-05 S ep-05 Oc t-05 Months T e m p e rat ur e ( o C ) 0 5 10 15 20 25 De c -0 4 J an-05 Fe b -0 5 M a r-0 5 Apr -05 Ma y -0 5 J un-05 Ju l-0 5 A ug-05 S ep-05 Oc t-0 5 Months V a p o ur pr essur e ( m b) 0 1 2 3 4 5 6 7 8 De c -0 4 J an-05 Fe b -0 5 M a r-0 5 Ap r-0 5 Ma y -0 5 J un-05 Ju l-0 5 Au g -0 5 Se p -0 5 Oc t-0 5 Months C lo udn ess ( x /1 0) 0 0,5 1 1,5 2 2,5 3 3,5 De c -0 4 J an-05 Fe b -0 5 M a r-0 5 Ap r-0 5 Ma y -0 5 J un-05 Ju l-0 5 Au g -0 5 Se p -0 5 Oc t-0 5 Months W in d spe e d ( m /s ec)
(a)
(b)
(c)
(d)
(e)
(f)
Figure 2. Monthly average values of meteorological parameters affecting the study area: (a) precipitation, (b) RH, (c) temperature, (d) vapor pressure, (e) cloudiness, and (f) wind speed.
Table 2. Classification categories of PM2.5, PM10, and meteorological
parameters defined by percentiles.
Percentiles PM2.5, PM10
RH, Temperature, Vapor Pressure, Cloudiness,
and Wind Speed
⬍25th Low (background) Low ⬎25th and ⬍75th Medium (impacted) Medium ⬎75th High (episode) High
than those measured in Bu¨yu¨kc¸ekmece, Vienna, and Oslo, but lower than those found in Beijing.
The seasonal changes of mass concentration values are shown in Figure 4. The winter/spring mass concentra-tions of PM2.5 and PM10 during the study period show
significant differences from summer/autumn, where the former are higher than the later. This clearly shows the effect of local domestic heating due to utilizing coal in the study region. The PM mass concentration could be in-creased and affected by different factors, including traffic congestion, domestic heating, population intensity, to-pography, and meteorology. Some workers suggested there is significant amount of long-range transport inputs to the region from eastern Europe, the Mediterranean, and the Middle East during winter, as well as spring and summer.34,45– 48 Long-range transportation may be
an-other factor that affects the region. However, this was not possible to confirm in this study because at a site affected by high local emissions, especially during the heating season, it is very difficult to identify long-range transport inputs due to high local contributions.
High-level PM winter mass concentrations can be re-lated to specific thermal inversions and domestic heating emissions. We believe that the observed high levels of PM mass concentrations in the Zonguldak region were mostly related to the low-quality coal used locally. During fall and winter the region has many long-lasting inversions. Topog-raphy also has a significant effect on the regional inversions
(typical of the Black Sea region city with high elevations closest to the sea). Throughout the whole year, the PM2.5
mass concentration in each season was higher than PM2.5–10. The chief portion of the sudden increase in
winter and spring PM10 mass concentration is
attrib-uted to the increase of PM2.5–10 due to local
meteoro-logical conditions triggered by the urban structures and transportation activities, whereas another part is attrib-uted to the increase of PM2.5 mass concentration
gen-erated from domestic heating and fuel combustion for energy production. The prevailing winds blow from the northwest and northeast locations, where the two big-gest industrial plants, Erdemı˙r and C¸ ates are located. This meteorological situation makes these plants more significant as PM sources affecting the region. The most important anthropogenic PM2.5–10sources are the coal
processing and mining industries located in Kozlu, U¨ zu¨lmez, and Karadon, which are located close to the study area and are operated during all seasons. Pinto et al.49studied ambient PM
2.5,sulfate, organic and
elemen-tal carbon, and polyaromatic hydrocarbons, with a focus on the effect of sulfur dioxide measurements to estimate the relative contributions to aerosol samples collected at the Teplice site in the Czech Republic. Modeling results from a chemical mass balance were evaluated to estimate the emissions from various sources (chimney of home heating, power plants, hospital incinerator, and motor vehicle traffic). They reported that residential space heat-ing was the major source of fine PM, whereas power plants, motor vehicles and incinerators were less important.
Figure 5 shows monthly concentrations of PM2.5,
PM2.5–10, and PM10. PM10 concentrations during January,
February, March, and April were higher than other months. The highest monthly PM10concentration was observed
dur-ing February (77.78 g/m3), whereas the lowest was
ob-served during May (37.61 g/m3). The highest PM 2.5
monthly mean concentration of 43.47g/m3was found in
January, whereas the lowest value of 19.84g/m3was found
in May. The highest PM2.5–10monthly mean concentration
value of 39.68g/m3was found in February, whereas the
lowest value of 15.34g/m3was found in August.
In this study, PM2.5, PM2.5–10, and PM10
concentra-tions were parallel to seasonal and monthly mean changes, the daily mean concentrations show higher val-ues in winter and spring compared with summer and autumn because of the utilization of fuel in domestic heating, industrial activities, coal-mining production, transportation, and traffic.
Correlations between PM2.5and PM10
For further understanding the possible sources, annual and seasonal correlations of summer and winter mass concen-trations of PM samples and their ratio were investigated. The correlation between annual mean values of PM2.5and PM10
particles is 0.80 (R value). Statistically, when the number of the samples was considered (⬎50), this value indicates a strong relationship at C¸ ates. A similar result was reported for some northern European countries. This correlation value was higher (0.88) than our average value of all European Monitoring and Evaluation Programme (EMEP) countries, and lower than some Nordic countries such as Denmark, Finland, Ireland, Norway, and Sweden.35
Table 3. Descriptive statistical analysis of PM concentrations.
PM2.5 PM2.5–10 PM10 PM2.5/PM10 N 236 236 236 236 Mean 29.382 23.851 53.234 0.570 Median 26.087 20.833 45.817 0.580 Standard Deviation 15.329 19.882 29.898 0.121 Minimum 4.55 4.00 12.00 0.18 Maximum 95.65 154.17 200.00 0.86 Percentiles 10 13.458 8.695 25.760 0.426 25 20.833 13.043 36.090 0.500 50 26.087 20.833 45.817 0.580 75 34.782 29.166 62.993 0.666 90 50.000 39.130 88.073 0.714
Table 4. Average PM concentrations measured from different regions. Measured Concentrations
(g/m3)
Region PM2.5 PM10
Zonguldak (this work) 29.38⫾ 15.32 53.23⫾ 29.89 Bu¨yu¨kc˛ekmece, Istanbul34 32.56⫾ 13.60 47.11⫾ 20.76
Rajshahi, Bangladesh37 22.465⫾ 10.413 41.131 ⫾ 21.979
Vienna, Austria38 18.6⫾ 10.7 26.5⫾ 13.3
Salzburg, Austria (urban traffic, 2005) 26 33 Innsbruck, Austriad(urban, 2005)35 21 29
Bern, Switzerland39 20.7 32.5
Nontelibretti, Italy (semi-rural, 2006)-Italy40
17.6 29.2 Urban background in Spain41 19–29 28–47
Inspection of the correlations between PM2.5 and
PM10mass concentration values indicates that at C¸ ates,
summer has higher correlations than winter. The correla-tion coefficients for winter and summer are 0.70 and 0.90, respectively. Two possible effects that generate seasonal differences in the ratio of PM2.5to PM10can be attributed
to (1) the absence of residential burning, which has a decreasing effect on the relative amount of fine fraction in PM10; and (2) resuspension of surface dust in summer,
which increases the relative amount of the coarse fraction in PM10. The relatively high correlation observed in
sum-mer could be an indication of common sources44or
par-ticles carried to the receptor site by similar transportation mechanisms.34 We believe that the latter option is the
most possible one in our case. Thus, surface winds, which carry PM2.5-sized anthropogenic particles from their
emis-sion sources along with PM2.5–10-sized resuspended
sur-face dust, were the main governing meteorological factor on the transportation of atmospheric particles in the re-gion during the study period.
However, the heating season PM2.5and PM10
concen-trations (December–May) show weak correlation. In this case, the increased emissions of winter-related activities like space heating and strong ground-level inversions were ob-served frequently during the season in the region. Under these winter meteorological conditions such as strong inver-sions, wet ground due to increased precipitation, and stag-nant atmospheric conditions, it is well possible to have more anthropogenic PM directly dispersed from its source and less natural PM due to ongoing conditions.
Special attention was given to winter concentrations. The observed high winter PM10concentration is due to
the increase in PM2.5during January, whereas in PM2.5–10
mass concentration during February, March, and April PM10.This situation during winter and spring months can
be explained by regional and/or local meteorological fac-tors. The presence of high humidity during spring in the study area in addition to an increase in evaporation in marine and crustal regions causes the increase of coarse-sized crustal elements such as sodium in the PM2.5–10
particle size range. Another possible effect that increases the anthropogenic fine particles over the city is winter inversions related to atmospheric stability. The typical features of the weather of Zonguldak, rainy with very high humidity, are the governing factor over the PM2.5–10mass
concentration during the whole year, especially in spring and winter months, where it has a significant correlation with PM measurements.
PM2.5/PM10Ratio
As seen from Table 3, the average and median ratio values of PM2.5to PM10are 0.57 and 0.58, respectively. The 75th
percentile is given as 0.66. The ratio is almost equal dur-ing heatdur-ing and nonheatdur-ing times (0.57 and 0.56), but with detailed monthly inspection it has higher values during summer (Figure 6). The situation was possibly caused by the decrease of PM2.5–10 mass concentration
during summer. The results of these analyses show that the seasonal averages of the PM2.5/PM10 ratio during a
year are greater than 0.5. This is an indication that coarse 0% 5% 10% 15% 20% 25% 30% 35% 40% 0-15 16-25 26-35 36-50 51-65 66-75 76-85 86-100 Concentration ranges, µ g/m3 0% 10% 20% 30% 40% 50% 60% 0-25 26-50 51-7576-100 101-125 126-150 151-175 176-200 3 49% 51% PM2.5 62% 38% PM10 Concentration ranges, µ g/m3
(a)
(b)
Figure 3. Exceedance days of EU limit values for (a) PM2.5and (b) PM10.
Table 5. PM winter and summer average concentration from different regions.
Concentration (g/m3)
Winter Summer
Region PM2.5 PM10 PM2.5/PM10 PM2.5 PM10 PM2.5/PM10
Zonguldak (this work) 34.17 63.59 0.53 25.03 41.83 0.59 By¨k¨çekmece, Istanbul34 24.77 47.1 18.11 47.54
Vienna, Austria38 19.5 (13) 26.9 (16.6) 0.72 (0.14) 17.5 (7.3) 26.1 (10.5) 0.67 (0.09)
Beijing, China43 140.8 (73.9) 287.7 (155.7) 82.2 (49) 170 (66.7)
Oslo, Norway 14 32 11 20
Trondheim, Norway44 11 21 7.7 15
particles are more available in the atmosphere than fine particles in this region of Turkey.
Winter and summer histogram graphs for the ratio are given in Figure 7. These figures show that no clear difference in the graphs, but the summer profile is more symmetrical, has a thinner left tail, and a more leptokur-tic distribution peaked at 0.6. These results indicate sum-mer concentrations fit normal distribution. Coal mining, transportation, and coal-processing activities can contrib-ute significantly to PM2.5 emissions in the
atmo-sphere.25,26The conveyed left tail between 0.4 and zero in
Figure 7 during winter indicates that the PM2.5 has a
constant share in PM10. This may be a clear indication of
fine-sized PM contribution from sources such as industrial coal burning, coal-related mining, transportation, and coal-processing activities in the region. Some similar re-sults are reported. In the north, northwest, and central/ eastern Europe there is a clear tendency toward higher ratios of 0.46, 0.61, and 0.70, respectively.35
Relationship between Meteorological Parameters and PM Measurements
The temporal patterns of meteorological parameters were analyzed to establish a consistent description for Zongul-dak during the study period. The aim of the analysis conducted in this aspect was to discuss the effect of the meteorological conditions, especially during the occur-rence of pollution episodes
Accordingly, the increase of RH and cloudiness is associated with an increase in episodic values of PM2.5
and PM10. Cloudiness is also found to be directly related
to PM episodes. The maximum episode occurrence was observed in the range of 62– 83% RH, compared with the ranges of 0 – 62% and 83–100%. This can be explained by
cloud scavenging characteristic of high RH levels (⬎83%), which result in low concentrations of gas and aerosols.20
The amount of rain had a decreasing effect on PM2.5
and PM10mass concentration, in which an atmospheric
washout process takes place. During non-rainy days, the episodic events for PM2.5and PM10were increased by 30
and 10.7%, respectively. Similar results were obtained in EMEP model scenarios during 2002 and 2003.35Under the
conditions of low amount of rainfall, PM, especially nat-urally originated PM, tends to increase. It is reported by Frolova et al.50that on dry days (i.e., days without or with
poor precipitation), the daily limit value of PM10 was
exceeded in 94% of the cases in Latvia.
Temperature and PM have a significant effect on the occurrence of episodic events. The correlation between PM and temperature shows that there is a significant negative correlation. In the case of the 25th percentile of temperature (the lowest values of the temperature), the number of episodes of PM2.5and PM10increased six and
seven times, respectively. The effect of wind on the ob-served PM concentration over the city was not profound. This could be due the surface roughness and topography of the region. The other possible limiting effect over wind is the urban meteorology and the effects of structures. The city is located on a hilly area with unplanned, dense housing construction. This structure has a breaking, di-luting, and diverging effect on the wind speed. When the wind speed increases from 1.39 to 2.80 m/sec, the number of polluted days increases. This may be an unexpected result, because of the dilution effects of wind, but it should be also be noted that buildings and trains have a marked influence on the behavior of plumes.51The results
for PM10 show that for wind speeds higher than 2.80
m/sec, the number of episodic days decreased up to 40%. High concentrations of PM are found in a mining area and the concentrations are gradually diminished with an increase in distance due to transportation, depo-sition, and dispersion of particles.52–54The dispersion of
PM follows the annual predominant wind direction of an area. The prevailing winds, which may transport PM from nearby sources, play a significant role on the observa-tion of PM episode in city. The major prevailing wind directions are westerly (south-southwest, southwest, west-northwest, north-northwest) and easterly (north-north-east, northeast) winds. The westerly and easterly prevail-ing winds have an increasprevail-ing effect on the number of episodes over Zonguldak. This is thought to be because of nearby PM10local sources, Kozlu (located at 5 km west)
0 10 20 30 40 50 60 70
winter spring summer autumn Seasons C o nc ent rat ions ( µ g/ m 3 ) PM2.5 PM2.5-10 PM10
Figure 4. PM mass concentration seasonal change.
0 20 40 60 80 100 De c -0 4 Ja n -0 5 F eb-05 Ma r-0 5 Ap r-0 5 Ma y-0 5 Ju n -0 5 Ju l-0 5 Au g -0 5 S ep-05 Oc t-0 5 Months C onc ent rat ios (µ g/ m 3 ) PM2.5-10 PM2.5 PM10
Figure 5.PM2.5, PM2.5–10, and PM10monthly mean concentrations.
0.40 0.50 0.60 0.70 De c -0 4 Ja n -0 5 Fe b -0 5 M a r-0 5 A p r-0 5 Ma y -0 5 Ju n -0 5 Ju l-0 5 Au g -0 5 Se p -0 5 Oc t-0 5 Months PM 2. 5 /P M 10
Figure 6. PM2.5/PM10monthly variation.
(a)
(b)
Figure 7. Frequency distribution of the PM2.5/PM10ratio for Zonguldak city in (a) winter and (b) summer.
Figure 8. Relationship between meteorological parameters and PM episode days: (a) precipitation, (b) range of RH, (c) temperature range, (d) cloudiness range, (e) wind speed range, and (f) vapor pressure.
and U¨ zu¨lmez (located 7 km northwest); for a regional perspective, C¸ ates (located to the east) and Erdemı˙r (lo-cated to the west) (Figure 1).
The number of PM episode occurrences (75th percen-tile) under specified meteorological conditions are given in Figure 8. The effect and correlation between PM2.5and
PM10episodic values and local meteorological parameters
could be inferred easily from these figures. CONCLUSIONS
Located in the western Black Sea region of Turkey, Zon-guldak is a city of different industrial activities, mainly the coal-mining industry. This study related to PM and its fractions in the city center during December 2004 and October 2005 shows significant and meaningful correla-tions between meteorological parameters and PM mass concentration.
As a result, the mass concentration of PM2.5particle size
is dominant in the atmospheric inhalable fraction (PM10).
Compared with many European cities, the measured con-centrations are among the highest.14 –19During the entire
study the two particle sizes, PM2.5and PM10,show a
signif-icant correlation. This study showed that in a region char-acterized by coal-mining activities, fine sized particles can represent a constant share of inhalable particles throughout the year. However, this is more applicable during summer. It is noted that high winter values are consistent with contri-butions from domestic heating sources and governing local and/or regional meteorological conditions. Also, coal-min-ing activities create wider air-quality deterioration due to PM in and around the mining complexes, which affects Zongul-dak. There is a need to carry out additional campaigns to address these effects.
The analysis showed that the meteorological param-eters have a major effect on the observed PM2.5and PM10
(Table 6). The increase of RH and cloudiness coincides with an increase of PM episodic events. As expected, low temperatures are associated with an increase in the num-ber of episodic events. This is a result of the use of coal in space heating during winter and also because of stagnant air masses formed because of low temperature and low wind speed over the study area.
The roughness of the topography of the study area and the unplanned, crowded settlement in the city center
along with a low wind speed (2.79 m/sec) hindered the distribution of PM air pollution over the city.
Serious health problems such as asthma, allergies, and other respiratory system problems in the study region could be attributed to the high concentrations of PM and meteo-rological conditions, especially the occurrence of episodic events in the study region. There is a need to spend a special effort in evaluating the health effects of air quality over the city. This will be addressed in detail in a separate paper. ACKNOWLEDGMENTS
The authors express sincere gratitude to Tu¨bı˙tak for their financial support of this work (project no. 104Y022). The authors also thank reviewers for their valuable contribu-tions to the paper throughout the review process. REFERENCES
1. Helander, M.L.; Savolainen, J.; Ahlholm, J. Effects of Air Pollution and Other Environmental Factors on Birch Pollen Allergens; Eur. J. Allergy
Clin. Immunol. 1997, 52, 1207-1214.
2. Monn, C.; Alean-Kirkpatrick, P.; Ku¨nzli, N.; Defila, C.; Peeters, A.; Ackermann-Liebrich, U.; Leuenberger, F. Air Pollution, Climate and Pollen Comparisons in Urban, Rural and Alpine Regions in Switzer-land (SAPALDIA Study); Atmos. Environ. 1999, 33, 2411-2416. 3. Moshammer, H.; Neuberger, M. The Active Surface of Suspended
Par-ticles as a Predictor of Lung Function and Pulmonary Symptoms in Austrian School Children; Atmos. Environ. 2003, 37, 1737-1744. 4. Martonen, T.B.; Schroeter, J.D. Risk Assessment Dosimetry Model for Inhaled
Particulate Matter: I. Human Subjects; Toxicol. Lett. 2003, 138, 119-132. 5. Alberini, A.; Krupnick, A. Air Quality and Episodes of Acute
Respira-tory Illness in Taiwan Cities: Evidence from Survey Data; J. Urban Econ.
1992, 44, 68-92.
6. Williams, R.; Creason, J.; Zweidinger, R.; Watts, R.; Sheldon, L.; Shy, C. Indoor, Outdoor, and Personal Exposure Monitoring of Particulate Air Pollution: the Baltimore Elderly Epidemiology-Exposure Pilot Study;
Atmos Environ. 2000, 34, 4193-4204.
7. Wordley, J.; Walters, S.; Ayres, J. Short Term Variations in Hospital Admissions and Mortality and Particulate Air Pollution; Occup.
Envi-ron. Med. 1997, 54, 108-116.
8. Timonen, K.L.; Pekkanen, J.; Tittanen, P.; Salonen, R.O. Effects of Air Pollu-tion on Changes in Lung FuncPollu-tion Induced by Exercise in Children with Chronic Respiratory Symptoms; Occup. Environ. Med. 2002, 59, 129-134. 9. Gomzi, M. Indoor Air and Respiratory Health in Preadolescent
Chil-dren; Atmos. Environ. 1999, 33, 4081-4086.
10. Wong, G.W.K.; Ko, F.W.S.; Lau, T.S.; Li, S.T.; Hui, D.; Pang, S.W.; Leung, R.; Fok, T.F.; Lai, C.K.W. Temporal Relationship between Air Pollution and Hospital Admissions for Asthmatic Children in Hong Kong; Clin. Exp. Allergy 2001, 31, 565-569.
11. Brunekreef, B.; Holgate, S.T. Air Pollution and Health; The Lancet
2002, 360, 1233-1242.
12. Horng, C.L.; Cheng, M.T.; Chiang, W.F. Distribution of PM2.5and
Gaseous Species in Central Taiwan during Two Chinese Festival Peri-ods; Environ. Eng. Sci. 2007, 24, 515-524.
Table 6. Descriptive statistics of meteorological parameters and PM concentrations. PM2.5 (g/m3) PM10 (g/m3) Rain (mm) RH (%) Temperature (ⴗC) Vapor Pressure (mb) Cloudiness (x/10) Wind Speed (m/sec) n 236 236 97 236 236 235 236 236 Mean 29.38 53.23 6.90 73.87 15.01 13.83 4.43 2.15 Standard Deviation 15.32 29.89 8.98 13.64 7.39 6.52 3.30 1.08 Minimum 4.55 12 0.00 29.00 ⫺0.10 4.10 0.00 0.30 Maximum 95.65 200 38.50 95.00 26.80 26.20 10.00 6.50 Percentiles 10th 13.46 25.76 0.10 56.19 3.81 5.50 0.00 0.90 25th 20.84 36.09 0.80 68.08 8.80 8.10 1.30 1.40 50th 26.09 45.81 3.30 77.70 16.55 13.30 4.30 2.00 75th 34.79 62.99 8.80 82.60 21.80 20.30 7.30 2.80 90th 50.01 88.07 19.82 87.70 23.53 22.84 9.00 3.53
13. Pio, C.; Alves, C.; Carvalho, A.; Santos, C. Size Distribution Character-istics of Organic Species in Atmospheric Particulate Matter from Finn-ish and German Rural Sites with Variable Anthropogenic Influence;
Environ. Eng. Sci. 2006, 23, 933-941.
14. Karaca, F.; Alagha, O.; Erturk, F. Statistical Characterization of Atmo-spheric PM10and PM2.5Concentrations at a Non-Impacted Suburban
Site of Istanbul, Turkey; Chemosphere 2004, 59, 1183-1190. 15. Yang, L.X.; Wang, D.C.; Cheng, S.H.; Wang, Z.; Zhou, Y.; Zhou, X.H.;
Wang, W.X. Influence of Meteorological Conditions and Particulate Matter on Visual Range Impairment in Jinan, China; Sci. Tot. Environ.
2007, 383, 164-173.
16. Hogrefe, C.; Porter, P.S.; Gego, E.; Gilliland, A.; Gilliam, R.; Swall, J.; Irwin, J.; Rao, S.T. Temporal Features in Observed and Simulated Meteorology and Air Quality over the Eastern United States; Atmos.
Environ. 2006, 40, 5041-5055.
17. Meteorology Applied to Urban Air Pollution Problems: Final Report COST
Action 715, Fisher, B., Joffre, S., Kukkonen, J., Piringer, M., Rotach, M.,
Schatzmann, M., Eds.; ISBN 954-9526-30-5; Demetra: Bulgaria, 2005. 18. Fisher, B.; Kukkonen, J.; Piringer, M.; Rotach, M.W.; Schatzmann, M. Meteorology Applied to Urban Air Pollution Problems: Concepts from COST 715; Atmos. Chem. Phys. 2006, 6, 555-564.
19. Baklanov, A.; Hanninen, O.; Slordal, L.H.; Kukkonen, J.; Bjergene, N.; Fay, B.; Finardi, S.; Hoe, S.C.; Jantunen, M.; Karppinen, A.; Rasmussen, A.; Skouloudis, A.; Sokhi, R.S.; Sorensen, J.H.; Integrated Systems for Forecasting Urban Meteorology, Air Pollution and Population Expo-sure; Atmos. Chem. Phys. 2007, 7, 855-874.
20. Elminir, H.K. Dependence of Urban Air Pollutants on Meteorology;
Sci. Total Environ. 2005, 350, 225-237.
21. Hien, D.; Bac, T.; Tham, C.; Nhan, D.; Vinh, D. Influence of Meteoro-logical Conditions on PM2.5 Concentrations during the Monsoon
Season in Hanoi; Atmos. Environ. 2002, 36, 2473-3488.
22. Laakso, L.; Hussein, T.; Aarnio, P.; Komppula, M.; Hiltunen, V.; Vi-isanen, Y.; Kulmala, M. Diurnal and Annual Characteristics of Particle Mass and Number Concentrations in Urban, Rural and Arctic Envi-ronments in Finland; Atmos. Environ. 2003, 37, 2629-2641. 23. Tarrason, L.; Jonson, J.E.; Fagerli, H.; Benedictow, A.; Wind, P.;
Simp-son, D.; Klein, D.H. Transboundary Acidication, Eutrrophication and
Ground Level Ozone in Europe. Source-Receptor Relationship; Status Report
1/2003; Part III; Convention on Long-Range Transboundary Air Pol-lution, Co-Operative Programme for Monitoring and Evaluation of Long Range Transmission of Air Pollutants in Europe, Norwegian Meteorological Institute; 2003.
24. Querol, X.; Alastuey, A.; Viana, M.M.; Rodriguez, S.; Artinano, B.; Salva-dor, P.; Garcia do Santos, S.; Fernandez Patier, R.; Ruiz, C.R.; de la Rosa, J.; Sanchez de la Campa, A.; Menendez, M.; Gil, J.I. Speciation and Origin of PM10and PM2.5in Spain; Aerosol Sci. 2004, 35, 1151-1172
25. Ghose, M.K.; Majee, S.R. Sources of Air Pollution Due to Coal Mining and Their Impacts in Jharia Coalfield; Environ. Int. 2000, 26, 81-85. 26. Ghose, M.K.; Majee, S.R. Air Pollution Caused by Opencast Mining
and its Abatement Measures in India; J. Environ. Manage. 2001, 63, 193-202.
27. Tomac¸, N.; Acun, C.; Demirel, F.; Ermic, B.; Ayoglu, F.N. Prevalence and Risk Factors of Asthma and Allergic Diseases in Zonguidat Prov-ince. X National Conference on Allergy and Clinical Immunology, Adana, September 24 –27, 2002.
28. Inhalable Particulate Source Category Report for External Combustion
Sources; EPA Contract No. 68-02-3156; Prepared by Acurex Corp.,
Mountain View, CA, 1985.
29. Compilation of Air Pollution Emission Factors Volume I: Stationary Point and
Area Sources, 4th ed.; AP-42; U.S. Environmental Protection Agency;
Of-fice of Air Quality Planning and Standards: Washington, DC, 1985. 30. Emission Factor Documentation for AP-42; U.S. Environmental
Protec-tion Agency; Office of Air Quality Planning and Standards: Research Triangle Park, NC, 1993.
31. AP-42 Fifth Edition, Compilation of Air Pollutant Emission Factors, Vol. 1:
Stationary Point and Area Sources; U.S. Environmental Protection Agency;
2005; available at http://epa.gov./ttn/chief/ap42/index.html (accessed 2007). 32. Turkstat; 2007; available at http://www.turkstat.gov.tr (accessed 2007). 33. EPA Guidance for Network Design and Optimum Site Exposure for PM2.5
and PM10; U.S. Environmental Protection Agency; Office of Research
and Development: Washington, DC, 1997.
34. Karaca, F.; Alagha, O.; Ertu¨rk, F. Statistical Characterization of Atmo-spheric PM10and PM2.5Concentrations at a Non-Impacted Suburban
Site of Istanbul, Turkey; Chemosphere 2005, 59, 1183-1190. 35. Larssen, S.; Barrett, K.; Adams, A.; van het Bolscher, M.; de Leeuw, F.;
Pulles, T.; van Loon, M.; van Pul, A. Air Pollution in Europe 1997–2004. Chemical Coordinating Centre of the European Monitoring and Eval-uation Programme, 2007.
36. Mol, W.J.A.; van Hooydonk, P.R.; de Leeuw, F.A.A.M. European Exchange of Monitoring Information and State of the Air Quality in 2005; Draft Report; ETC/ACC Technical Paper 2007/1; European Topic Centre on Air and Climate Change, Bilthoven, The Nether-lands, 2007; available at http://air-climate.eionet.europa.eu/reports/
ETCACC_TechnPaper_2007_1_EoI_AQ_meta_info2005 (accessed 2007).
37. Begum, B.A.; Kim, E.; Biswas, S.K.; Hopke, P.K. Investigation of Sources of Atmospheric Aerosol at Urban and Semi-Urban Areas in Bang-ladesh; Atmos. Environ. 2004, 38, 3025-3038.
38. Gomiscek, B.; Hauck, H.; Stoper, S.; Preining, O. Spatial and Temporal Variations of PM1, PM2.5, PM10and Particle Number Concentration
during the AUPHEP--Project; Atmos. Environ. 2004, 38, 3917-3934. 39. Gehig, R.; Buchmann, B. Characterising Seasonal Variations and Spatial
Distribution of Ambient PM10and PM2.5Concentrations Based on
Long-Term Swiss Monitoring Data; Atmos. Environ. 2003, 37, 2571-2580. 40. Perrino, C.; Finzi, G.; Silibello, C. EMEP–PM Assessment Report, National
Contribution of Italy, EMEP Particulate Matter Assessment Report,
Chem-ical Coordinating Centre of the European Monitoring and Evaluation Programme, 2007.
41. Querol, X.; Alastuey, A.; Moreno, T.; Viana, M.M.; Castillo, S.; Pey, J.; Escudero, M.; Rodriguez, S.; Cristobal, A.; Gonzalez, A.; Jimenez, S.; Pallares, M.; Rosa, J.; Artinano, B.; Salvador, P.; Santos, S.G.D.; Patier, R.F.; Cuevas, E. Atmospheric Particulate Matter in Spain: Levels,
Compo-sition and Source Origin; Consejo Superior de Investigaciones
Cientifi-cas and Ministerio de Medioambiente: Madrid, Spain, 2006. 42. Ytrri, K.E.; Aas, W. Measurement of Particulate Matter in the European
Rural Environment: Status in 2005; EMEP Particulate Matter Assessment
Report; Chemical Coordinating Centre of the European Monitoring and Evaluation Programme, 2007.
43. Sun, Y.; Zhuang, G.; Wang, Y.; Han, L.; Gua, J.; Dan, M.; Zhang, W.; Wang, Z.; Hao, Z. The Air-Borne Particulate Pollution in Beijing— Concentration, Composition, Distribution and Sources; Atmos.
Envi-ron. 2004, 38, 5991-6004.
44. Yttri, K.E. Concentrations of Particulate Matter (PM10, PM2.5) in Norway Annual and Seasonal Trends and Spatial Variability; EMEP Particulate
Matter Assessment Report; Chemical Coordinating Centre of the Eu-ropean Monitoring and Evaluation Programme; 2007.
45. O¨ zsoy, T. Saydam. A.C. Acidic and Alkali Precipitation in the Clinician Basin, North-Eastern Mediterranean Sea; Sci. Tot. Environ. 2000, 253, 93-109. 46. O¨ zsoy, T.; Saydam, A.C. Iron Specification in Precipitation in the
North-Eastern Mediterranean and its Relationship with Sahara Dust;
Earth Environ. Sci. 2004, 40, 41-67.
47. Kindap, K.; Unal, A.; Chen, S.H.; Hu, Y.; Odman, M.T.; Karaca, M. Long-Range Aerosol Transport from Europe to Istanbul, Turkey;
At-mos. Environ. 2006, 40, 3536-3547.
48. Karaca, F.; Alagha, O.; Elc¸i, E.; Ertu¨rk, F.; Yılmaz, Y.Z.; O¨ zkara, T. PM10
and PM2.5Chromium Concentrations of Bu¨yu¨kc¸ekmece Lake Basin; Ekoloji 2006, 15, 1-6.
49. Pinto, J.P.; Stevens, R.K.; Xwillis, R.K.; Kellogg, R.; Mamane, Y.; Novak, J.; Santroch, J.; Benes, I.; Lenice K.J.; Bures, V. Czech Air Quality Monitoring and Receptor Modeling Study; Environ. Sci. Technol. 1998, 32, 843-854. 50. Frolova, M.; Steinberga, I.; Lyulko, I. Analysis of Particulate Matter
(PM10) Concentrations in Latvia; EMEP Particulate Matter Assessment
Report; Chemical Coordinating Centre of the European Monitoring and Evaluation Programme, 2007.
51. Wark, K.; Warner, C.F.; Davis, W.T. Air Pollution, Its Origin and Control. Addison Wesley Longman: Reading, MA, 1998; p 138.
52. Chaulya, S.K.; Chakraborty, M.K.; Singh, R.S. Air Pollution Modeling for a Proposed Limestone Quarry; Water Air Soil Pollut. 2001, 126, 171-191. 53. Jones, T.; Blackmore, P.; Leach, M.; Matt, B.K.; Sexton, K.; Richards, R. Characterisation of Airborne Particles Collected within and Proximal to an Opencast Coalmine: South Wales; UK Environ. Monit. Assess.
2002, 75, 293-312.
54. Chaulya, S.K. Assessment and Management of Air Quality for an Opencast Coal Mining Area; J. Environ. Man. 2004; 70, 1-14.
About the Authors
Assistant Professor Dr. Lokman Hakan Tecer and Master’s student Pinar Su¨ren are with the Department of Environ-mental Engineering at Balikesir University in Balikesir, Tur-key. Assistant Professor Dr. Omar Alagha and Assistant Professor Dr. Ferhat Karaca are with the Department of Environmental Engineering at Faith University in Istanbul, Turkey. Professor Dr. Gu¨rdal Tuncel is with the Department of Environmental Engineering Middle East Technical Univer-sity in Ankara, Turkey. Please address correspondence to: Assistant Professor Dr. Lokman Hakan Tecer, Department of Environmental Engineering, Cagis Campus, Balikesir Univer-sity, Balikesir, Turkey 10165; phone:⫹90-266-612-11-9; fax: ⫹90-266-612-11-95; e-mail: [email protected].