International Journal of
Intelligent Systems and
Applications in Engineering
Advanced Technology and ScienceISSN:2147-67992147-6799 www.atscience.org/IJISAE Original Research Paper
This journal is © Advanced Technology & Science 2013 IJISAE, 2016, 4(2), 25–28 | 25
The Classification of Diseased Trees by Using kNN and MLP
Classification Models According to the Satellite Imagery
Muhammed Fahri Unlersen *
1, Kadir Sabanci
2Accepted 7th April 2016 DOI: 10.18201/ijisae.05552:
10.1039/b000000x
Abstract: In this study, the Japanese Oak and Pine Wilt in forested areas of Japan was classified into two group as diseased trees and all
other land cover area according to the 6 attributes in the spectral data set of the forest. The Wilt Data Set which was obtained from UCI machine learning repository database was used. Weka (Waikato Environment for Knowledge Analysis) software was used for classification of areas in the forests. The classification success rates and error values were calculated and presented for classification data mining algorithms just as Multilayer Perceptron (MLP) and k-Nearest Neighbor (kNN). In MLP neural networks the classification performance for various numbers of neurons in the hidden layer was presented. The highest success rate was obtained as 86.4% when the number of neurons in the hidden layer was 10. The classification performance of kNN method was calculated for various counts of neighborhood. The highest success rate was obtained as 72% when the count of neighborhood number was 2.
Keywords: k - Nearest Neighbor, Multilayer Perceptron Neural Network, Weka, Classification, Remote Sensing.
1. Introduction
Nowadays, vast amounts of data are collected daily. Terabytes or petabytes of data pour into storage devices from business, society, science and engineering, medicine and almost every other aspect of daily life. Scientific and engineering practices generate high orders of petabytes of data in a continuous manner, from remote sensing, process measuring, scientific experiments, system performance, engineering observations and environmental surveillance. And also the medical and health industry generates tremendous amounts of data from medical records, patient monitoring and medical imaging. This explosively growing available data creates a necessity of powerful and versatile tools to automatically uncover valuable information from the tremendous amounts of data and to transform such data into organized knowledge [1].
Data mining is a new and rapidly growing field. It draws ideas and resources from several disciplines, including machine learning, statistics, database research, high-performance computing and commerce [2]. Data mining is the process of searching and analysing data in order to find implicit, but potentially useful, information. It involves selecting, exploring and modelling large amounts of data to uncover previously unknown patterns, and ultimately comprehensible information, from large databases [3].
Classification is one the most used tasks in data mining. In classification or regression, the task is to predict the outcome associated with a particular individual given a feature vector
describing that individual [4].
Classification steps in the knowledge discovery process are as follows [5]:
1. Data cleaning - The removal of noise and inconsistent data. 2. Data integration - The combination of multiple sources of data. 3. Data selection - The data relevant for analysis is retrieved from the database.
4. Data transformation - The consolidation and transformation of data into forms appropriate for classification.
5. Classification - The use of intelligent methods to extract patterns or relations from data.
In the literature, various studies in which data mining classification algorithms are used have main areas like science and engineering, medical, food and agriculture.
Kurvonen et al., 1999 used SAR images for classification of land cover and forest types. While using the SAR image intensity for classification of land cover and forests areas which consist of seven types of plants have 45% mean accuracy, using the textural measures of SAR images made the mean accuracy about 65%. The textural information of a multitemporal set of ERS-1 and JERS-1 synthetic aperture radar (SAR) images was studied with the first- and second-order statistical measures [5].
Kosaka et al., 2005 proposes fusion analysis of high-resolution multispectral and panchromatic satellite imageries for forest type classification. With texture features obtained from a panchromatic imagery, forest was classified into two types, such as coniferous and broad-leaved forests [6].
In their study conducted in 2014, Yang et al. classified trees in Boreal forests in Canada. Using LiDAR, RapidEye and the combination of these two data along with the support vector machine classification method, the success rates were compared.
_______________________________________________________________________________________________________________________________________________________________
1 Selcuk University Doğanhisar Vocational School Konya Turkey 2 Karamanoglu Mehmetbey University Electrical and Electronics
Engineering Engineering Department Karaman Turkey * Corresponding Author: Email: [email protected]
IJISAE, 2016, 4(2), 25-28 This journal is © Advanced Technology & Science 2013
The data they used composed of six components. These are digital elevation model, slope, red-edge NDVI, red-edge, canopy height and near infrared bands of RapidEye data. The best result was obtained using the combination of LiDAR and RapidEye data [7].
Forests and savannahs, along with plantation forests, offer numerous benefits to rural communities and society at large. Forests provide such benefits like consumptive resources, spiritual and aesthetic needs, employment, and ecological services such as carbon sequestration and water regulation [8]. Global forest area has been reduced by 40% over the last three centuries, primarily as a result of human activities, particularly the conversion of forested land to agricultural usage [9]. Today, less than one-third of the earth’s land area is covered by forests [10]. Determining the changes in forest areas is important to prevent and take measures to loss of forest area. In our paper, high-resolution remote sensing data set [11] obtained from UCI machine learning repository was used to determine the diseased trees in Japan. The classification was done by using WEKA software. For classification the k-Nearest Neighbour (kNN) and Multilayer Perceptron (MLP) algorithms were performed and the results of these algorithms with different number of neighbours and neurons were compared.
2. Material and Methods
2.1. Dataset
The studied area (approximately 3.0 km × 2.5 km) is located near Yonezawa City in Yamagata Prefecture, Japan, and consisted mainly of deciduous broadleaf forest and evergreen needle leaf forest, with smaller areas of clear-cut forest and residential and agricultural land. The high-resolution QuickBird images of 165 different area were acquired in 27 August 2012 to detect the diseased trees. The QuickBird images contains four 2.4 m resolution MS bands (B, 0.450–0.520 μm; G, 0.520–0.600 μm; R, 0.630–0.690 μm; NIR, 0.760–0.900 μm) and a 0.6 m PAN band (0.445–0.900 μm) [11].
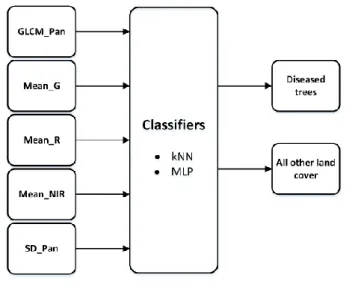
This data set contains some training and testing data from a remote sensing study by Johnson et al. (2013) that involved detecting diseased trees in Quickbird imagery [11]. The data set consists of image segments, generated by segmenting the pan sharpened image. The segments contain spectral information from the Quickbird multispectral image bands and texture information from the panchromatic (Pan) image band. There are few training samples for the 'diseased trees' class (74) and many for 'other land cover' class (4265). Totally the dataset consist of 4889 instances and each instance has 6 attributes. These attributes are class, GLCM mean texture of pan, mean of green value, mean of red value, mean of blue value, mean of NIR (Near Infrared) value and standard derivation of pan band.
2.2. Software WEKA
Developed by Waikato University in New Zealand, WEKA is an open-source data mining software with a functional graphical interface which incorporates machine learning algorithms [12]. WEKA includes various data pre-processing, classification, regression, clustering, association rules, and visualization tools. The algorithms can be applied on the data cluster either directly or by calling via Java code [13]. They are also suitable for developing new machine learning algorithms.
Today, WEKA is recognized as a landmark system in data mining and machine learning. It has achieved widespread acceptance within academia and business circles, and has become
a widely used tool for data mining research [12].
2.3. Data mining algorithms
K – Nearest Neighbour Algorithm: The k-NN is a supervised learning algorithm that solves classification problems. Classification is the examination of the attributes of an image and the designation of this image to a predefined class. The important point is the determination of the features of each category in advance [14]. According to the kNN algorithm used in the classification, based on the attributes drawn from the classification stage, the distance of the new individual that is wanted to be classified to all previous individuals is considered and the nearest k class is used. As a result of this process, test data belongs to the k-nearest neighbour category that has more members in a certain class.
The most important optimization problems in the kNN method are the identification of the number of neighbours and the method of distance calculation algorithm. In the study, the identification of the optimum k number is performed with experiments, and the Euclidean Distance Calculations method is used as a distance calculation method.
Euclidean calculation method [15]:
𝑑(𝑥𝑖, 𝑥𝑗) = (∑(𝑥𝑖𝑠+ 𝑥𝑗𝑠) 2 𝑝 𝑠=1 ) 2
xi and xj are two different points, and we need distance
calculation process in between.
Multilayer Perceptron: It is a feed forward type artificial neural network model which maps input sets onto appropriate output sets. A multilayer perceptron (MLP) is composed of multiple layers of nodes where each layer is connected to the next. Each node is a processing element or a neuron that has a nonlinear activation function except the input nodes. It uses a supervised learning technique named back propagation and it is used for train
ing the network. The alteration of the standard linear perceptron, MLP is capable of distinguishing data which are not linearly separable [12]. The classification structure is seen in Figure 1.
3. Results and Discussion
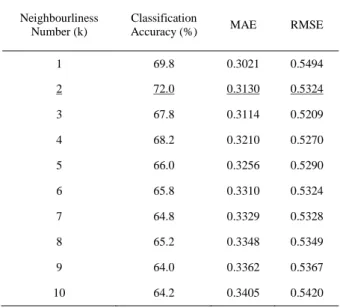
The dataset was processed by using WEKA software to distinguish the diseased trees and other vegetation. The classification success rate of wheat was obtained for various k neighbourhood values by using kNN algorithm. Also the root mean square error (RMSE) and mean absolute error (MAE) values were calculated. Classification success rates obtained by kNN algorithm and MAE and RMSE values is presented in Table 1. The change of MAE and RMSE error values versus number of neighbours of kNN algorithm is shown in Figure 2.
Table 1. The Success Rate and Error Values Obtained by using kNN
Classifier Neighbourliness
Number (k)
Classification
Accuracy (%) MAE RMSE
1 69.8 0.3021 0.5494 2 72.0 0.3130 0.5324 3 67.8 0.3114 0.5209 4 68.2 0.3210 0.5270 5 66.0 0.3256 0.5290 6 65.8 0.3310 0.5324 7 64.8 0.3329 0.5328 8 65.2 0.3348 0.5349 9 64.0 0.3362 0.5367 10 64.2 0.3405 0.5420
Figure 2. Variation of error rate based on the number of neighborhood
Table 2. Success Rate Obtained By Using Multilayer Perceptron
Classifier Error Values The number of neurons in
the hidden layer
Classification
accuracy (%) MAE RMSE
1 78.4 0.2639 0.3978 2 84.8 0.1668 0.3407 3 85.8 0.1587 0.3305 4 86.2 0.1568 0.3235 5 84.6 0.1669 0.3444 6 84.4 0.1727 0.3556 7 84.6 0.1643 0.338 8 85.8 0.1604 0.3296 9 85.4 0.1614 0.3299 10 86.4 0.1586 0.3200 15 86.2 0.1645 0.3253 20 84.4 0.1756 0.3405 25 83.0 0.1831 0.3484
Figure 3. Variation of error rate based on the number of neurons in
hidden layer
The same data in the same dataset were classified by using multilayer perceptron model as normal and diseased trees. Classification success rate in various number of neurons in the hidden layer of MLP, MAE, RMSE error rate were calculated. Classification success rates, MAE and RMSE error values obtained by using MLP model are presented in Table 2. The change of MAE and RMSE error values versus number of neurons in the hidden layer of MLP algorithm is shown in Figure 3.
The model of MLP whose hidden layer consists of 10 neurons which creates the highest classification success rate is shown in Figure 4.
IJISAE, 2016, 4(2), 25-28 This journal is © Advanced Technology & Science 2013
Figure 4. The structure of Multilayer Perceptron
4. Conclusion
In this study, values of 5 different spectral information of diseased trees and other vegetation in the data set were used to classify them as normal or diseased trees by using kNN and MLP algorithms. Also success rates were calculated for kNN and MLP. In the obtained classification success rates the success rate of MLP method was higher than kNN. In classification success rate obtained by kNN algorithm, the highest success rate was when the number of neighbour is 2. For this count of neighbourhood the MAE error value was calculated as 0.313 and the RMSE error value was calculated as 0.5324. The highest classification success rate as 86.4% was obtained by using MLP when it has 10 neurons in the hidden layer. When there were 10 neurons in the hidden layer of MLP, the MAE and RMSE error values were 0.1586 and 0.32 respectively.
References
[1] Han J., Pei J., Kamber M., Data Mining: Concepts and Techniques, 3. Edition, Morgan Kaufmann, 2012, p.740.
[2] Hegland M., Data mining techniques, Acta Numerica, 2001, Vol. 10, pp 313-355.
[3] Michael J. Shaw M.J., Subramaniam C., Tan G.W., Welge M.E., Knowledge management and data mining for marketing, Decision Support Systems, 2001, vol. 31(1), pp.127-137.
[4] Frank E., Hall M., Trigg L., Holmes G., Witten I. H., Data mining in bioinformatics using Weka, Bioinformatics Applications Note, 2004, Vol.20(15), pp. 2479-2481.
[5] Kurvonen L., Hallikainen M. T., Textural Information of Multitemporal ERS-1 and JERS-1 SAR Images with Applications to Land and Forest Type Classification in Boreal Zone, IEEE Transactions On Geoscience And Remote Sensing, 1999, VOL. 37(2), pp. 680-689. [6] Kosaka, N., Akiyama, T., Tsai, B., Kojima, T., Forest
type classification using data fusion of multispectral and panchromatic high-resolution satellite imageries, In International Geoscience and Remote Sensing Symposium, 2005, Vol. 4, pp. 2980 2983.
[7] Yang X., Rochdi N., Zhang J., Banting J., Rolfson D., King C., Purdy B., Mapping tree species in a boreal forest area using RapidEye and LiDAR data, In Geoscience and Remote Sensing Symposium (IGARSS), 2014 IEEE International, pp. 69-71.
[8] Shackleton C.M., Shackleton S.E., Buiten E., Bird N., The importance of dry woodlands and forests in rural livelihoods and poverty alleviation in South Africa, Forest Policy and Economics, 2007, Vol. 9(5), Pages 558–577.
[9] Shvidenko A., Barber C.V., Persson R., Forest and woodland systems, Ecosystems and Human Well-being: Current State and Trends, 2005, Vol 1, pp. 587– 621.
[10] Sturrock R. N., Frankel S. J., Brown A. V., Hennon P. E., Kliejunas J. T., Lewis K. J., Worrall J. J., Woods A. J., Climate change and forest diseases, Plant Pathology, 2011, vol. 60(1), pp. 133-149.
[11] Johnson, B., Tateishi, R., Hoan, N., A hybrid pansharpening approach and multiscale object-based image analysis for mapping diseased pine and oak trees, International Journal of Remote Sensing, 2013, vol. 34(20), pp. 6969-6982.
[12] Hall M. , Frank E., Holmes G., Pfahringer B., Reutemann P., Witten I. H., The WEKA Data Mining Software: An Update, SIGKDD Explorations, 2009, Vol. 11(1), pp. 10-18.
[13] Arora R., Suman S., Comparative Analysis of Classification Algorithms on Different Datasets using WEKA, International Journal of Computer Applications, 2012, Vol. 54(13), pp. 21-25.
[14] Wang J., Neskovic P., Cooper L. N., Improving nearest neighbor rule with a simple adaptive distance measure, Pattern Recognition Letters, 2007, Vol. 28(2), pp. 207-213.
[15] Zhou Y., Li Y., Xia S., An improved KNN text classification algorithm based on clustering, Journal of computers, 2009, Vol. 4(3), pp. 230-237.