© TÜBİTAK
doi:10.3906/kim-1912-36 h t t p : / / j o u r n a l s . t u b i t a k . g o v . t r / c h e m /
Research Article
Colorimetric cadmium ion detection in aqueous solutions by newly synthesized
Schiff bases
Ziya AYDIN1,∗, Mustafa KELEŞ2
1Vocational School of Technical Sciences, Karamanoğlu Mehmetbey University, Karaman, Turkey 2Department of Chemistry, Faculty of Arts and Sciences, Osmaniye Korkut Ata University, Osmaniye, Turkey
Received: 18.12.2019 • Accepted/Published Online: 10.05.2020 • Final Version: 01.06.2020
Abstract: Two newly synthesized Schiff bases DMCA and DMBA were used for selective detection of Cd2+ over a wide range of other metal ions in acetonitrile (ACN)/ Tris-HCl buffer (10 mM, pH 7.32, v/v 2:1). The sensors can detect Cd2+ ions by colour changes from colourless to orange for DMBA and yellow to reddish for DMCA. Response of the probes towards metal ions was investigated by using UV-vis spectroscopy. The complex stoichiometry between the sensors, DMBA and DMCA, and Cd2+ was found to be 2:1 and the binding constants were calculated to be 2.65 ×10¹² M−2and 4.95 ×10¹² M−2, respectively. The absorbance-based detection limits of DMBA and DMCA were calculated as 0.438 µM and 0.102 µM, respectively. The sensors were also successfully applied to real samples.
Key words: Colorimetric, Schiff base, sensor, cadmium
1. Introduction
As one of the highly toxic heavy metal ions, cadmium is widely distributed in water, soil and crops, generated from its use sources such as fertilizers, the combustion of fossil fuels, paint pigments, Ni-Cd rechargeable batteries, causing serious problems for human health [1–3]. Due to the high affinity to sulphur, Cadmium ion (Cd2+) can interfere with Ca2+ and Zn2+ in the binding sites of some enzymes containing sulphur [4,5]. It
causes these enzymes to malfunction, causing severe organ damage. Cadmium and cadmium compounds are category I carcinogens [6], and are known to be associated with liver and kidney damage, cancer mortality and cardiovascular disease [7–9]. Thus, it is an essential point to develop detection methods for cadmium.
Several methods have been reported to detect Cd2+; however, these methods are generally expensive,
time consuming and have sophisticated synthetic procedures [10–13]. As alternative methods, fluorometric and colorimetric sensors require easier procedures. In recent years, fluorescent sensors have gained growing interest in detecting Cd2+ ions [14–17]. Many of them, however, have some limitations such as having a poor
detection limit [18] and complicated synthesis steps [19]. Moreover, most of the sensors for Cd2+ also give
response to Zn2+ ions due to their similar properties [20]. Recently, several colorimetric sensors for Cd2+
have been also reported [21–24]. These sensors also suffer from long response time, poor selectivity, complex organic synthesis and poor detection limits [25]. Nowadays, Schiff base derivatives have been increasingly used as colorimetric sensors due to having simple synthesis steps and high selectivity. Especially, cinnamaldehyde-based and benzaldehyde-cinnamaldehyde-based Schiff base derivatives have been developed for the detection of metal ions such
∗Correspondence: [email protected]
as Ni2+ [26], Ag+ [27], Al3+[28,29] Cu2+/Hg2+ [30]. However, simple, rapid, highly selective, and sensitive
colorimetric sensors for Cd2+ are still rare and needed to be developed.
In this paper, we presented 2 newly synthesized Schiff base derivatives, one of them is a benzaldehyde-based sensor and the other is a cinnamaldehyde-benzaldehyde-based sensor, which detected Cd2+ ions by colour change
in aqueous solutions. Response of the sensors was investigated using UV-vis spectroscopy in the presence of various metal ions. The detection limits of DMBA and DMCA were calculated to be 0.438 µM and 0.102 µM, respectively.
2. Experimental
2.1. Materials and methods
N-phenyl-o-phenylenediamine, 4-(dimethylamino)cinnamaldehyde and 4-(dimethylamino)benzaldehyde were pur-chased from Sigma-Aldrich. The solvents and the other chemicals used in the experiments were commercially obtained. The solution of Fe3+ and Fe2+ was prepared separately by dissolving in 0.1 M HCl. Unless otherwise
stated, the solutions of the metal ions tested were prepared from nitrate salts or chloride salts of them in deion-ized water. A NMR spectrometer (a Bruker NMR spectrometer (Bruker Ultrashield Plus Biospin Avance III 400 MHz NaNoBay FT-NMR)) was used to record 1H and 13C NMR spectra. An Agilent LC-MS/MS 6460Triple
Quadrupole mass spectrometer was used to perform ESI-MS analyses. Shimadzu UV-1800 spectrophotometer was used to record UV-vis spectra.
2.2. Synthesis and characterization of the probes
Synthesis of N,N-dimethyl-4-(((2-(phenylamino)phenyl)imino)methyl)aniline (DMBA):
4-(Dimethyl)aminobenzaldehyde (300 mg, 2 mmol) and N-phenyl-o-phenylenediamine (369 mg, 2 mmol) were dissolved in ethanol (5 mL), respectively. The solutions were charged in Schlenk tube and mixed for 1h. Then, a pale-yellow precipitate product was filtered and washed with cold ethanol to obtain DMBA. Yield 0.510 g (81%). 1H NMR (400 MHz, CDCl
3) δ 8.34 (s, 1H), 7.76 (d, J = 8.8 Hz, 2H), 7.25 (dd, J = 7.1, 6.1 Hz, 2H),
7.21–7.14 (m, 2H), 7.07 (ddd, J = 16.2, 6.7, 5.2 Hz, 4H), 6.94–6.85 (m, 1H), 6.72 (d, J = 8.9 Hz, 2H), 5.73 (s, 1H), 3.03 (s, 6H). 13C NMR (100MHz, CDCl
3) δ 158.3, 152.4, 146.5, 143.7, 140.6, 130.3, 129.4, 124.0, 120.6,
119.2, 117.3, 111.7, 111.1, 40.2. ESI-MS (positive mode) m/z 316.2 [DMBA +H]+.
Synthesis of N,N-dimethyl-4-((1E,3E)-3-((2-(phenylamino)phenyl)imino)prop-1-en-1-yl)aniline (DMCA):
4-(Dimethylamino)cinnamaldehyde (350 mg, 2 mmol) and N-phenyl-o-phenylenediamine (369 mg, 2 mmol) were dissolved in ethanol (5 mL), respectively. The solutions were charged in Schlenk tube and mixed for 1h. Then, the reddish precipitate product was filtered and washed with cold ethanol to obtain DMCA. Yield 0.580 g (85%). 1H NMR (400 MHz, CDCl3) δ 8.27 (d, J = 8.7 Hz, 1H), 7.49–7.33 (m, 2H), 7.33–7.23 (m, 3H), 7.21–7.11 (m,
2H), 7.12–7.01 (m, 5H), 7.01–6.87 (m, 2H), 6.68 (t, J = 12.2 Hz, 2H), 5.76 (s, 1H), 3.02 (s, 6H). 13C NMR
(100MHz, CDCl3) δ 159.9, 151.3, 144.0, 143.3, 141.2, 129.4, 129.0, 124.1, 122.1, 120.9, 118.7, 117.7, 112.1,
2.3. UV-vis absorption measurements
DMBA (3.15 mg, 0.01 mmol) and DMCA (3.42 mg, 0.01 mmol) were dissolved in ACN (10 mL) and 30 µ L of the sensors (1 mM) were diluted with 1.470 mL ACN/Tris-HCl buffer (10 mM, pH 7.32, v/v 2:1) to make final concentrations of 20 µ M. For each spectrum, 1.0 mL of a probe solution was added to a 1-cm quartz cell, to which different stock solutions of cations were gradually added by using a micro-pipette. All absorption spectra were collected from 220 to 800 nm. Upon addition of each metal ions tested to the sensors solutions, the spectral readings were immediately recorded.
2.4. Determination of Cd2+ in real samples
To evaluate the analytical applicability of the sensors, DMBA and DMCA, they were used to detect Cd2+ ions
in tap water samples collected in Osmaniye, Turkey. The tap water samples were spiked with solutions of Cd2+
and were diluted with ACN/Tris-HCl buffer (10 mM, pH 7.32, v/v 2:1) to obtain samples at concentrations of 0, 2, 5, and 10 mg. L−1 (ppm) Cd2+, respectively. All spectroscopic measurements were done under the same
experimental conditions proposed for the selectivity experiments, and measurements were performed at least triplicate and resulting averages were reported.
3. Results and discussion
3.1. Design and synthesis of the sensors, DMBA and DMCA
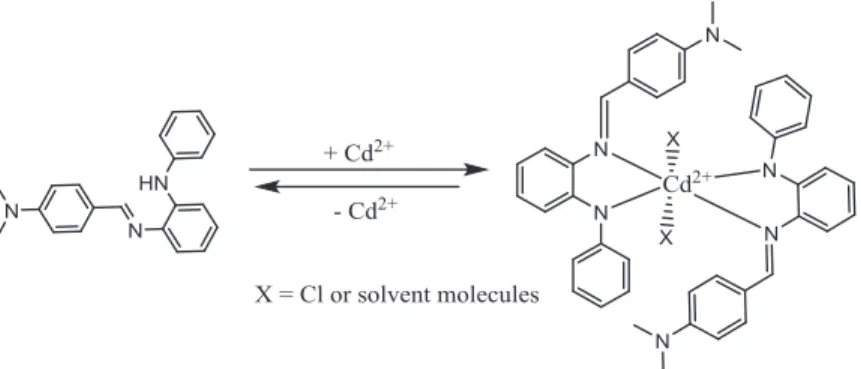
The molecular structures of the sensors were designed to contain an N-phenyl-o-phenylenediamine as a binding part for Cd2+, a cinnamaldehyde moiety (for DMCA), and a benzaldehyde moiety (for DMBA) as chromophore
parts. The binding parts of the sensors consist of 2 nitrogen atoms to give 2 5-membered rings in 2:1 binding between the sensors and Cd2+. The binding part and the chromophore parts were linked via the formation of
the C =N bonds in a 1-step procedure with 81% and 86% yields for DMBA and DMCA, respectively (Scheme 1). The structures of the sensors were verified by NMR (13C NMR and 1H NMR) and ESI-mass spectrometry.
Scheme 1. Synthesis of the probes, DMBA and DMCA.
3.2. The absorption and colorimetric properties of DMBA and DMCA
We first evaluated the spectroscopic properties of DMBA and DMCA and their interactions with various metal ions. The colourless compound DMBA (20 µM) in ACN/Tris-HCl buffer (10 mM, pH 7.32, v/v 2:1) displays
a maximum absorption at 349 nm ( ε = 4.75 ×10⁴M−1 cm−1, only DMBA) that may be ascribed to n- π * transition [31]. However, the addition of Cd2+ resulted in a decrease in the absorption intensity at 349 nm and
formation of a new absorption peak at 488 nm (Figure 1a) with a remarkable colour change from colourless to orange (Figure 1b inset). As depicted in Figure 1b, the tested metal ions including Cu2+, Cr3+, Cu+, Na+,
Hg2+, Mg2+, Ca2+, Zn2+, Ag+, Pb2+, K+, Co2+, Fe2+, Mn2+, and Ni2+ did not respond to DMBA while
Fe3+ caused a decreasing the absorption intensity at 349 nm without any increase at 488 nm.
300 400 500 600 0.0 0.2 0.4 0.6 0.8 1.0 1.2 A b so rb an ce Wavelength (nm) Cd2+ Fe3+ DMBA and other metal ions (b) 300 400 500 600 700 0.0 0.2 0.4 0.6 0.8 1.0 1.2 Wavelength (nm) A b so rb an ce 488 nm 349 nm (a)
Figure 1. (a) Absorption spectra of 20 µ M DMBA with gradual addition of CdCl2 (0, 2, 4, 6, 8, 10, 12, 14, 16, 18, 20, 25, 30, 35, and 40 µM, respectively) in ACN/Tris-HCl buffer (10 mM, pH 7.32, v/v 2:1) (b) Absorption spectra of DMBA (20 µM) with various metal ions (20 µM for Cd2+, Cu2+, Ni2+, Mn2+, Hg2+, Zn2+, Ag+, Pb2+, Fe3+, Co2+, Fe2+, Cu+ and Cr3+; 50 µM for Ca2+, Mg2+, K+, and Na+) in ACN/Tris-HCl buffer (10 mM, pH 7.32, v/v 2:1) (inset: colour changes of DMBA with the metal ions tested)
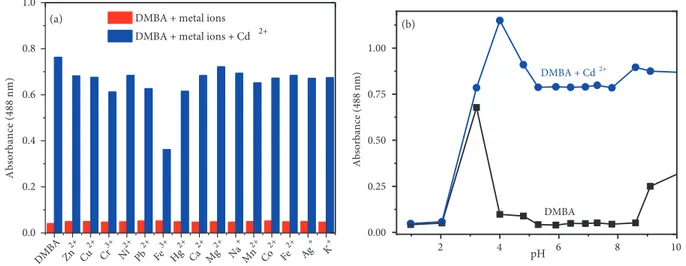
The detection of the target cation in the presence of other metal ions in real sample is an important assay. Competition experiments were performed to confirm the high selectivity of the detection system. First, the meal ions (200 µ M) such as Cu2+, Cr3+, Cu+, Na+, Hg2+, Mg2+, Ca2+, Zn2+, Ag+, Pb2+, K+, Co2+, Fe2+,
Mn2+and Ni2+ were preincubated with DMBA (20 µ M). As expected, no remarkable change was observed
(red bars in Figure 2a). However, the addition of Cd2+ (20 µ M) to each of them resulted in an increase in the
absorption intensity at 488 nm (blue bars in Figure 2a). These results show that none of the metal ions tested affect the sensing properties of DMBA to Cd2+. Moreover, the effects of pH on the stability of the sensor and
its Cd2+?complex were investigated and monitored by absorption spectra in a pH range from 1 to 10. The
pH of the solutions was adjusted by adding HCl (0.1 m) and NaOH (0.1M) into the solutions. As depicted in Figure 2b, the sensor, DMBA, is not stable at pH 1-2 and gives response to H+ ions at pH 3. The absorbance
intensity of DMBA remains constant at pH between 4 and 9, which indicates that Cd2+ can be detected with
DMBA in the environmental pH 4–9.
We repeated the same selectivity experiments for DMCA. The absorption spectral changes of DMCA after coordination with Cd2+ in ACN/Tris-HCl buffer (10 mM, pH 7.32, v/v 2:1) were studied first. As seen
in Figure 3a, the solution of DMCA alone (20 µM) exhibits an absorption maximum at 396 nm ( ε = 5.08 ×10⁴M−1 cm−1, only DMCA); as predicted, the maximum absorption wavelength of DMCA (396 nm) is
2 4 6 8 10 0.00 0.25 0.50 0.75 1.00 (b) DMBA DMBA + Cd2+ A b so rb an ce ( 4 8 8 n m ) pH DM BA Zn 2+ Cu 2+ Cr 3+ Ni 2+ Pb 2+ Fe 3+ Hg 2+ Ca 2+ Mg 2+ Na + Mn 2+ Co 2+ Fe 2+ Ag + K+ 0.0 0.2 0.4 0.6 0.8 1.0
DMBA + metal ions DMBA + metal ions + Cd 2+
A b so rb an ce ( 4 8 8 n m ) (a)
Figure 2. (a) Absorbance intensities of DMBA (20 µM) with various metal ions (200 µM) (red bar) and the subsequent
addition of Cd2+ (20 µM) (blue bar) (b) Variation of absorption values of DMBA (20 µM) and DMBA + Cd2+ (20 µM) at various pH values.
longer than that of DMBA (349 nm) because of the 1 extra double bond. With addition of Cd2+ to DMCA,
the absorbance at 396 nm decreased, while the absorbance at 545 nm ( ε = 4.05 ×10⁴M−1 cm−1, DMCA
and Cd2+ 1:1 ratio) increased accordingly (>64-fold with 1.0 equivalent of Cd2+) (Figure 3a). This apparent
bathochromic shift can be explained with the coordination of Cd2+. Furthermore, an isosbestic point around
449 nm showed that free sensor molecules convert to Cd2+-complex. Moreover, this bathochromic shift of 149
nm resulted in a colour change from yellow to reddish (Figure 3b inset). In contrast, other metal ions such as Cu2+, Cr3+, Cu+, Na+, Hg2+, Mg2+, Ca2+, Ag+, Pb2+, K+, Co2+, Fe2+, Mn2+and Ni2+ did not give
response to DMCA (20 µ M) (Figure 3b). The sensor also responded to Zn2+ with weaker absorption intensity
(~48-fold with 1.0 equivalent of Zn2+) .
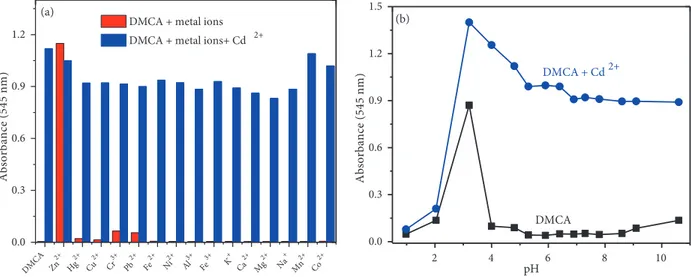
The competing selectivity of DMCA as a colorimetric sensor for Cd2+ sensing was controlled with various
metal cations. First, the meal ions (200 µM) such as Cu2+, Cr3+, Cu+, Na+, Hg2+, Mg2+, Ca2+, Zn2+,
Ag+, Pb2+, K+, Co2+, Fe2+, Mn2+, and Ni2+ were preincubated with DMCA (20 µ M). As expected, no
remarkable change was observed (red bars in Figure 4a). The naked-eye detection of Cd2+ by DMCA was not
interfered by other metal ions tested, while Zn2+ increased the absorption intensity at 545 nm (blue bars in
Figure 4a). The stability of the sensor at different pHs (1–10) was also investigated and monitored by UV-vis spectroscopy. The pH of the solutions was adjusted by adding HCl (0.1 M) and NaOH (0.1 M) into the solutions. The absorption intensities of DMCA and DMCA + Cd2+ at different pH values were plotted in Figure 4b.
Cd2+ ion can be detected with DMCA in the environmental pH range of 4–10.
3.3. Investigation of complexation between the sensors and Cd2+
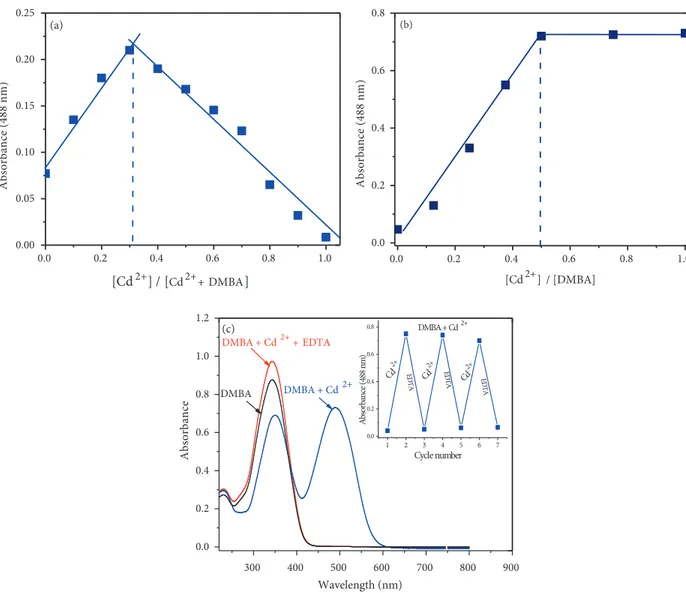
In order to confirm the binding stoichiometry between the sensors, DMBA and DMCA, and Cd2+, Job’s
method and UV-vis titration values were used. As shown in Figure 5a (Job’s plot), DMBA/Cd2+ molar
fractions represented a maximum absorption peak (at 488 nm) when it was close to 0.33, which indicates that the binding between DMBA and Cd2+ was in 2:1 stoichiometry. A titration curve (a plot of DMBA versus
300 400 500 600 700 0.0 0.2 0.4 0.6 0.8 1.0 1.2 1.4 A b so rb an ce Wavelength (nm) DMCA and other metal ions
Cd2+ Zn2+ (b) 300 400 500 600 700 800 0.0 0.2 0.4 0.6 0.8 1.0 1.2 1.4 A b so rb an ce Wavelength (nm) 545 nm 396 nm (a)
Figure 3. (a) Absorption spectra of 20 µ M DMCA with gradual addition of CdCl2 (0, 2, 4, 6, 8, 10, 12, 14, 16, 18, 20, 25, 30, 35, and 40 µM, respectively) in ACN/Tris-HCl buffer (10 mM, pH 7.32, v/v 2:1) (b) Absorption spectra of DMCA (20 µM) with various metal ions (20 µM for Cd2+, Cu2+, Ni2+, Mn2+, Hg2+, Zn2+, Ag+, Pb2+, Fe3+, Co2+, Fe2+, Cu+ and Cr3+; 50 µM for Ca2+, Mg2+, K+, and Na+) in ACN/Tris-HCl buffer (10 mM, pH 7.32, v/v 2:1) (inset: colour changes of DMCA with Cd2+
) . DM CA Zn 2+ Hg 2+ Cu 2+ Cr 3+ Pb 2+ Fe 2+ Ni 2+ Al 3+ Fe 3+ K+ Ca 2+ Mg 2+ Na + Mn 2+ Co 2+ 0.0 0.3 0.6 0.9 1.2 A b so rb an ce ( 5 4 5 n m )
DMCA + metal ions DMCA + metal ions+ Cd 2+
(a) 2 4 6 8 10 0.0 0.3 0.6 0.9 1.2 1.5 (b) DMCA DMCA + Cd2+ pH A b so rb an ce ( 5 4 5 n m )
Figure 4. (a) Absorbance values of DMCA (20 µM) with various metal ions (200 µM) (red bar) and the subsequent
addition of Cd2+ (20 µM) (blue bar) (b) Variation of absorption values of DMCA (20 µM) and DMCA + Cd2+ (20 µM) at various pH values.
Cd2+ concentration) was also used to determine the binding stoichiometry between DMBA and Cd2+. As
seen in the inset in Figure 5b, the DMBA/Cd2+ molar ratio (at 488) reached a plateau when 0.5 equivalent
of Cd2+ was added, suggesting the formation of a 2:1 DMBA-Cd2+ complex. The binding constant between
Cd2+ and DMBA was determined by a previously reported method [32], with absorption values at 488 nm,
and was calculated to be 2.65 ×10¹² M−2. Furthermore, the reversibility of the binding between the sensor
and Cd2+was examined. A solution of EDTA (1.0 equivalent) was added to the complex solution of DMBA
absorbance changes were almost reversible even after several cycles with the equivalent addition of Cd2+ and
EDTA (Figure 5c inset). These results indicated that the binding between DMBA and Cd2+ is reversible.
Scheme 2 shows the possible structures for this process.
0.0 0.2 0.4 0.6 0.8 1.0 0.00 0.05 0.10 0.15 0.20 0.25 [Cd2+] / [Cd2++DMBA] A b so rb an ce ( 4 8 8 n m ) (a) 0.0 0.2 0.4 0.6 0.8 1.0 0.0 0.2 0.4 0.6 0.8 A b so rb an ce ( 4 8 8 n m ) [Cd2+]/ [DMBA] (b) 300 400 500 600 700 800 900 0.0 0.2 0.4 0.6 0.8 1.0 1.2 1 2 3 4 5 6 7 0.0 0.2 0.4 0.6 0.8 EDT A EDT A Cd 2+ Cd 2+ A bs or ba n ce ( 48 8 n m ) Cycle number Cd 2+ EDT A DMBA + Cd2+ A b so rb an ce Wavelength (nm) DMBA + Cd2+ DMBA DMBA + Cd2+ + EDTA (c)
Figure 5. (a) Job’s plot (b) Titration of 20 µ M DMBA with gradual addition of CdCl2 (0, 2, 4, 6, 8, 10, 12, 14, 16, 18, 20, 25, 30, 35, and 40 µM, respectively) in ACN/Tris-HCl buffer (10 mM, pH 7.32, v/v 2:1) (c) UV-vis spectra showing reversibility of DMBA to Cd2+ ions by EDTA.
Moreover, the linear concentration range and the detection limit of DMBA were obtained. The absorption intensity (at 488 nm) was linearly dependent on the concentration of Cd2+ in the range from 0 to 10 µM ( R2 =
0.982). The detection limit was calculated to be 0.438 µM based on 3 σ /k (Figure 6) via absorption-based measurement.
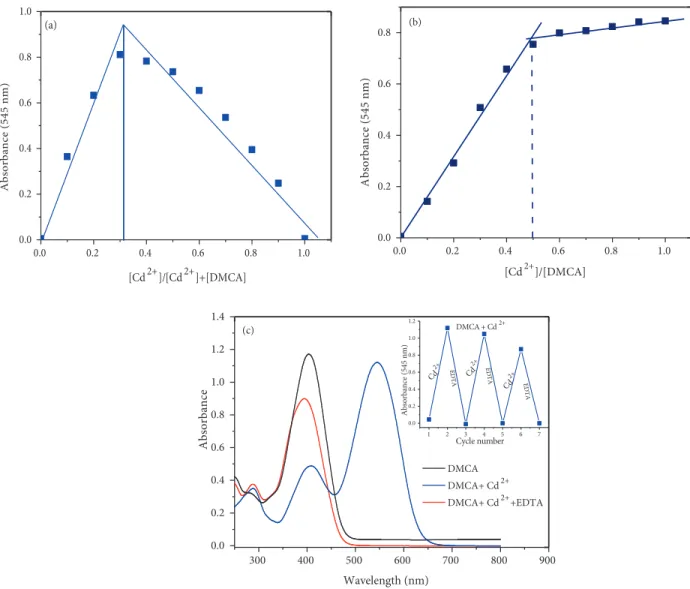
Job’s method and UV-vis titration were also used to understand binding mode between DMCA and Cd2+. As shown in Figure 7a (Job’s plot), DMCA/Cd2+ molar fractions represented a maximum absorption
peak (at 545 nm) when it was close to 0.33, which indicated that the binding between DMCA and Cd2+
Scheme 2. Proposed reversible binding mechanism between DMBA and Cd2+. 0 2 4 6 8 10 0.0 0.2 0.4 0.6 0.8 [Cd2+] (µM) A b so rb an ce ( 4 8 8 n m ) Y = 0.070 X + 0.002 R2 = 0.982
Figure 6. Linear relationship between absorbance intensity and Cd2+concentration (0–20 µ M).
equivalent of Cd2+ ion respectively, suggesting the formation of a 2:1 DMCA-Cd2+ complex. The binding
constant between Cd2+ and DMCA was determined with absorption values at 545 nm, and was calculated to
be 4.95 ×10¹² M−2.
To ascertain the reversibility of the sensing mechanism of the sensor DMCA, the solution of EDTA (1.0 equivalent) was added to the complex solution of the sensor and Cd2+. The absorption signal at 545
nm disappeared and the peak at 396 nm increased (Figure 7b). After addition of Cd2+again to the mixture
containing DMCA, Cd2+, and EDTA, the previous intensity of absorption was almost recovered. Meanwhile,
the red solution immediately turned yellow. These cycles were repeated 3 times with the consecutively addition of Cd2+/EDTA (Figure 7c inset). These results indicated that the binding between DMCA and Cd2+ is
reversible. Scheme 3 shows the possible structures for this process.
The linear concentration range and the detection limit of DMCA were also studied. The absorption intensity (at 545 nm) was linearly dependent on the concentration of Cd2+ in the range from 0 to 10 µM
( R2 = 0.991). The detection limit was calculated to be 0.102 µM based on 3 σ /k (Figure 8) via
absorption-based measurement.
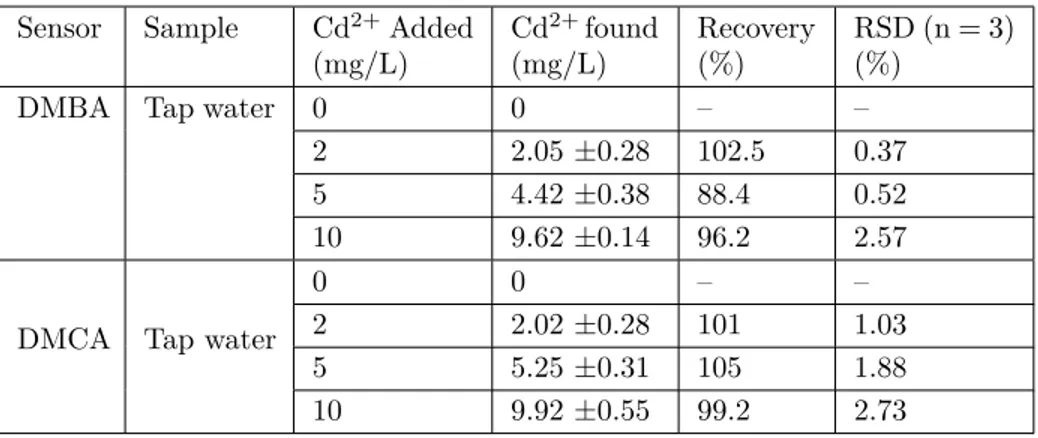
To evaluate the analytical applicability of the sensors, DMBA and DMCA, they were applied for deter-mination of Cd2+ ions in tap water samples. With the calibration plots of the sensors (Figure 6 and Figure 8),
0.0 0.2 0.4 0.6 0.8 1.0 0.0 0.2 0.4 0.6 0.8 1.0 A b so rb a n ce ( 5 4 5 n m ) [Cd2+]/[Cd2+]+[DMCA] (a) 0.0 0.2 0.4 0.6 0.8 1.0 0.0 0.2 0.4 0.6 0.8 A b so rb an ce ( 5 4 5 n m ) [Cd2+]/[DMCA] (b) 300 400 500 600 700 800 900 0.0 0.2 0.4 0.6 0.8 1.0 1.2 1.4 1 2 3 4 5 6 7 0.0 0.2 0.4 0.6 0.8 1.0 1.2 E D T A E D T A Cd 2+ Cd 2+ Ab so rb an ce (545 n m) Cycle number Cd 2+ ED T A DMCA + Cd2+ A b so rb an ce Wavelength (nm) DMCA DMCA+ Cd2+ DMCA+ Cd2++EDTA (c)
Figure 7. (a) Job’s plot (b) Titration of 20 µ M DMCA with gradual addition of CdCl2 (0, 2, 4, 6, 8, 10, 12, 14, 16, 18, 20, 25, 30, 35, and 40 µM, respectively) in ACN/Tris-HCl buffer (10 mM, pH 7.32, v/v 2:1) (b) UV-vis spectra showing reversibility of DMCA to Cd2+ ions by EDTA.
0 2 4 6 8 10 0.0 0.2 0.4 0.6 0.8 A b so rb an ce ( 5 4 5 n m ) [Cd2+] (µM) Y = 0.07877-0.0005 R2 = 0.9911
Figure 8. Linear relationship between absorbance intensity and Cd2+concentration (0–10 µ M).
each sample was analysed 3 times and the recovery values were calculated (Table 1). These results showed the suitability and applicability of the sensors for the detection of Cd2+ in real samples.
Table 1. Measurement of Cd2+ in tap water samples.
Sensor Sample Cd2+Added
(mg/L) Cd2+found (mg/L) Recovery (%) RSD (n = 3) (%)
DMBA Tap water 0 0 – –
2 2.05 ±0.28 102.5 0.37 5 4.42 ±0.38 88.4 0.52 10 9.62 ±0.14 96.2 2.57
DMCA Tap water
0 0 – –
2 2.02 ±0.28 101 1.03 5 5.25 ±0.31 105 1.88 10 9.92 ±0.55 99.2 2.73
Condition: [sensors, (DMBA and DMCA)] = 20 µM in ACN/ Tris-HCl buffer (10 mM, pH 7.32, v/v 2:1)
In recent years, several colorimetric/fluorescent sensors have been developed for the detection of Cd2+
ions. Compared to some selected sensors, the sensors, DBMA and DMCA, exhibit an excellent ability to detect Cd2+ ions by changes in both colour and UV-vis absorption spectra with a low detection limit in the presence
T able 2 . Comparison of sev eral colorimetric sensors for the detection of Cd 2+ . Ref. T esting media Resp onse time Resp onse İn terferences Repro ducibilit y Binding constan t Detection limit [24] EtOH/H 2 O (1:1, v/v) NA Colorimetric/ Fluorescence Zn 2+ , Pb 2+ Rev ersible 1.17 ×10 5 M − 1 0.073 µ M [33] Buffer–acetonitrile NA Colorimetric/ Fluorescence Zn 2+ , Co 2+ NA 5.60 ×10 5 M − 1 0.120 µ M [34] DMSO NA Colorimetric F − , Hg 2+ Rev ersible 4.73 ×10 3 M − 1 1.03 µ M [35] HEPES-buffered solution (20 mM, CH 3 CN: H2 O, 3:7, v/v, pH 7.0) NA Colorimetric/ Fluorescence None Rev ersible 9.56 ×10 5 M − 1 0.058 µ M [36] EtOH/H 2 O (1:1 v/v) NA Colorimetric/ Fluorescence Zn 2+ Rev ersible NA 1.10 µ M [37] A CN/HEPES buffer (10 mM, pH: 7.05, v/v 1:1 <1 min Colorimetric/ Fluorescence Cu 2+ , Co 2+ Rev ersible 2.70 ×10 7 M − 1 0.218 µ M [38] 10 µ M HEPES buffer solution (pH 7.54), NA Colorimetric/ Fluorescence None NA 2.33 ×10 5 M − 1 0.018 µ M [39] CH 2 Cl 2 /CH 3 CN (1:9, v/v). NA Colorimetric/ Fluorescence None Rev ersible 10 3-10 4 (1:3 complex) NA [40] DMF/H 2 O (9:1, v/v) <1 min Colorimetric/ Fluorescence Zn 2+ , Ni 2+ , Mn 2+ Rev ersible 4.98 ×10 4M − 1 0.861 µ M DMBA This study A CN/T ris-HCl buffer (10 mM, pH 7.32, v/v 2:1) <1 min Colorimetric None Rev ersible 2.65 ×10 12 M − 2 0.438 µM DMCA This study A CN/T ris-HCl buffer (10 mM, pH 7.32, v/v 2:1) <1 min Colorimetric Zn 2+ Rev ersible 4.95 ×10 12 M − 2 0.102 µM PEC = NA: not a v ailable
4. Conclusion
We presented 2 new Schiff base derivatives, a benzaldehyde-based sensor (DMBA) and a cinnamaldehyde-based sensor (DMCA), for colorimetric sensing of Cd2+ ions in aqueous solutions. The sensors depicted visible
absorption characteristics that range from colourless to orange for DMBA and yellow to reddish for DMCA. The sensors had a 2-nitrogen Cd2+-receptor moiety and coordinates with Cd2+ in a 2:1 binding mode with a
reversible response. The binding constant of the complexes was calculated as 2.65 ×10¹² M−2for DMBA and
4.95 ×10¹² M−2for DMCA. The detection limits of DMBA and DMCA were calculated via absorption-based
measurement and found to be 4.38 ×10⁻⁷M and 1.02 ×10⁻⁷, respectively, which gave a marked sensitivity towards Cd2+. For the practical application, the sensors were applied to real samples for identifying Cd2+ in
tap water. Therefore, the sensors, DMBA and DMCA, could serve as a colorimetric sensor for the detection of Cd2+ in aqueous solutions.
Acknowledgement
This study was supported by Osmaniye Korkut Ata University (project number: OKUBAP-2015-PT2-010). The authors are also very grateful to Karamanoğlu Mehmetbey University for providing technical supports during the data collection for this current work.
References
1. Williams C, David D. The effect of superphosphate on the cadmium content of soils and plants. Soil Research 1973; 11 (1): 43-56. doi: 10.1071/SR9730043
2. Salviano-Mendes AM, Duda GP, Araujo do Nascimento CW, Silva MO. Bioavailability of cadmium and lead in a soil amended with phosphorus fertilizers. Scientia Agricola 2006; 63 (4): 328-332. doi: 10.1590/S0103-90162006000400003
3. Wang C, Fang Y, Peng S, Ma D, Zhao J. Synthesis of novel chelating agents and their effect on cadmium decorporation. Chemical Research in Toxicology 1999; 12 (4): 331-334. doi: 10.1021/tx970134z
4. Varriale A, Staiano M, Rossi M, D’Auria S. High-affinity binding of cadmium ions by mouse metallothionein prompting the design of a reversed-displacement protein-based fluorescence biosensor for cadmium detection. Analytical Chemistry 2007; 79 (15): 5760-5762. doi: 10.1021/ac0705667
5. Prozialeck WC, Edwards JR, Woods JM. The vascular endothelium as a target of cadmium toxicity. Life Sciences 2006; 79 (16): 1493-1506. doi: 10.1016/j.lfs.2006.05.007
6. Boffetta P. Carcinogenicity of trace elements with reference to evaluations made by the International Agency for Research on Cancer. Scandinavian Journal of Work, Environment and Health 1993: 19 (Suppl 1): 67-70.
7. Goyer RA, Liu J, Waalkes MP. Cadmium and cancer of prostate and testis. Biometals 2004; 17 (5): 555-558. doi: 10.1023/B:BIOM.0000045738.59708.20
8. Satarug S, Baker JR, Urbenjapol S, Haswell-Elkins M, Reilly PE et al. A global perspective on cadmium pol-lution and toxicity in non-occupationally exposed population. Toxicology Letters 2003; 137 (1-2): 65-83. doi: 10.1016/S0378-4274(02)00381-8
9. McFarland C, Bendell-Young L, Guglielmo C, Williams T. Kidney, liver and bone cadmium content in the Western Sandpiper in relation to migration. Journal of Environmental Monitoring 2002; 4 (5): 791-795. doi: 10.1039/B206045K
10. Gholivand MB, Pourhossein A, Shahlaei M. Simultaneous determination of copper and cadmium in environmental water and tea samples by adsorptive stripping voltammetry. Turkish Journal of Chemistry 2011; 35 (6): 839-846. doi: 10.3906/kim-1004-553
11. Satti AA, Temuge ID, Bektaş S, Şahin ÇA. An application of coacervate-based extraction for the separation and preconcentration of cadmium, lead, and nickel ions prior to their determination by flame atomic absorption spectrometry in various water samples. Turkish Journal of Chemistry 2016; 40 (6): 979-987. doi: 10.3906/kim-1605-80
12. Dolan SP, Nortrup DA, Bolger PM, Capar SG. Analysis of dietary supplements for arsenic, cadmium, mercury, and lead using inductively coupled plasma mass spectrometry. Journal of Agricultural Food Chemistry 2003; 51 (5): 1307-1312. doi: 10.1021/jf026055x
13. Pyle SM, Nocerino JM, Deming SN, Palasota JA, Palasota JM et al. Comparison of AAS, ICP-AES, PSA, and XRF in determining lead and cadmium in soil. Environmental Sciencetechnology 1995; 30 (1):204-13. doi: 10.1021/es9502482
14. Zhu YF, Wang YS, Zhou B, Yu JH, Peng LL et al. A multifunctional fluorescent aptamer probe for highly sensitive and selective detection of cadmium(II). Analytical Bioanalytical Chemistry 2017; 409 (21): 4951-4958. doi: 10.1007/s00216-017-0436-1
15. Shim S, Tae J. Rhodamine Cyclen-based fluorescent chemosensor for the detection of Cd2+. Bulletin of the Korean Chemical Society 2011; 32: 2928-2932. doi: 10.5012/bkcs.2011.32.8.2928
16. Zhang Y, Zhang Z, Yin D, Li J, Xie R et al. Turn-on fluorescent InP nanoprobe for detection of cadmium ions with high selectivity and sensitivity. ACS Applied Materials Interfaces 2013; 5 (19): 9709-9713. doi: 10.1021/am402768w 17. Gunnlaugsson T, Lee TC, Parkesh R. Highly selective fluorescent chemosensors for cadmium in water. Tetrahedron
2004; 60 (49): 11239-11249. doi: 10.1016/j.tet.2004.08.047
18. Xue L, Li G, Liu Q, Wang H, Liu C et al. Ratiometric fluorescent sensor based on inhibition of resonance for detection of cadmium in aqueous solution and living cells. Inorganic Chemistry 2011; 50 (8): 3680-3690. doi: 10.1021/ic200032e
19. Xue L, Liu C, Jiang H. Highly sensitive and selective fluorescent sensor for distinguishing cadmium from zinc ions in aqueous media. Organic Letters 2009; 11 (7): 1655-1658. doi: 10.1021/ol900315r
20. Nolan EM, Ryu JW, Jaworski J, Feazell RP, Sheng M et al. Zinspy sensors with enhanced dynamic range for imaging neuronal cell zinc uptake and mobilization. Journal of the American Chemical Society 2006; 128 (48): 15517-15528. doi: 10.1021/ja065759a
21. Wang AJ, Guo H, Zhang M, Zhou DL, Wang RZ et al. Sensitive and selective colorimetric detection of cadmium(II) using gold nanoparticles modified with 4-amino-3-hydrazino-5-mercapto-1, 2, 4-triazole. Microchimica Acta 2013; 180 (11-12): 1051-1057. doi: 10.1007/s00604-013-1030-7
22. Kim HN, Ren WX, Kim JS, Yoon J. Fluorescent and colorimetric sensors for detection of lead, cadmium, and mercury ions. Chemical Society Reviews 2012; 41 (8): 3210-3244. doi: 10.1039/C1CS15245A
23. Song S, Zou S, Zhu J, Liu L, Kuang H. Immunochromatographic paper sensor for ultrasensitive colorimetric detection of cadmium. Food and Agricultural Immunology 2018; 29 (1): 3-13. doi: 10.1080/09540105.2017.1354358 24. Lv Y, Wu L, Shen W, Wang J, Xuan G et al. A porphyrin-based chemosensor for colorimetric and fluorometric detection of cadmium(II) with high selectivity. Journal of Porphyrins and Phthalocyanines 2015; 19 (6): 769-774. doi: 10.1142/S1088424615500510
25. Cheng D, Liu X, Xie Y, Lv H, Wang Z et al. A ratiometric fluorescent sensor for Cd2+ based on internal charge transfer. Sensors 2017; 17 (11): 2517. doi: 10.3390/s17112517
26. Peralta-Domínguez D, Rodríguez M, Ramos-Ortíz G, Maldonado JL, Meneses-Nava MA et al. A Schiff base derivative from cinnamaldehyde for colorimetric detection of Ni2+ in water. Sensors and Actuators B: Chemical 2015; 207: 511-517. doi: 10.1016/j.snb.2014.09.100
27. Kang JH, Chae JB, Kim C. A multi-functional chemosensor for highly selective ratiometric fluorescent detection of silver(I) ion and dual turn-on fluorescent and colorimetric detection of sulfide. Royal Society Open Science 2018; 5: 180293. doi: 10.1098/rsos.180293
28. Aydin Z, Keles M. Highly selective Schiff base derivatives for colorimetric detection of Al3+. Turkish Journal of Chemistry 2017; 41 (1): 89-98. doi: 10.3906/kim-1603-127
29. Kar C, Samanta S, Goswami S, Ramesh A, Das G. A single probe to sense Al(III) colorimetrically and Cd(II) by turn-on fluorescence in physiological conditions and live cells, corroborated by X-ray crystallographic and theoretical studies. Dalton Transactions 2015; 44 (9): 4123-4132. doi: 10.1039/C4DT01433B
30. Cho H, Chae JB, Kim C. Cinnamaldehyde-based chemosensor for colorimetric detection of Cu2+ and Hg2+ in a near-perfect aqueous solution. Chemistry Select 2019; 4 (9): 2795-2801. doi: 10.1002/slct.201900199
31. Vashisht D, Sharma S, Kumar R, Saini V, Saini V et al. Dehydroacetic acid derived Schiff base as selective and sensitive colorimetric chemosensor for the detection of Cu(II) ions in aqueous medium. Microchemical Journal 2020; 104705. doi: 10.1016/j.microc.2020.104705
32. Guo M, Perez C, Wei Y, Rapoza E, Su G et al. Iron-binding properties of plant phenolics and cranberry’s bio-effects. Dalton Transactions 2007; 43: 4951-4961. doi: 10.1039/B705136K
33. Song EJ, Kang J, You GR, Park GJ, Kim Y et al. A single molecule that acts as a fluorescence sensor for zinc and cadmium and a colorimetric sensor for cobalt. Dalton Transactions 2013; 42(43): 15514-15520. doi: 10.1039/C7NJ02569F
34. Arabahmadi R, Orojloo M, Amani S. Azo Schiff bases as colorimetric and fluorescent sensors for recognition of F−, Cd2+ and Hg 2+ ions. Analytical Methods 2014; 6(18): 7384-7393. doi: 10.1039/C4AY01564A
35. Kumar A, Ahmed N. A coumarin–chalcone hybrid used as a selective and sensitive colorimetric and turn-on fluoro-metric sensor for Cd2+ detection. New Journal of Chemistry 2017; 41(23): 14746-14753. doi: 10.1039/C7NJ02569F 36. Jiang XJ, Li M, Lu HL, Xu LH, Xu H et al. A highly sensitive C3-symmetric Schiff-base fluorescent probe for
Cd2+. Inorganic Chemistry 2014; 53(24): 12665-12667. doi: 10.1021/ic501279y
37. Aydin Z. A turn-on fluorescent sensor for cadmium ion detection in aqueous solutions. Journal of the Turkish Chemical Society Section A: Chemistry 2020; 7(1): 277-286. doi: 10.18596/jotcsa.638912.
38. Sakthivel P, Sekar K, Sivaraman G, Singaravadivel S. Rhodamine diaminomaleonitrile conjugate as a novel colorimetric fluorescent sensor for recognition of Cd2+ ion. Journal of Fluorescence 2017; 27(3): 1109-1115. doi: 10.1007/s10895-017-2046-x
39. Zhao Q, Li RF, Xing SK, Liu XM, Hu TL et al. A highly selective on/off fluorescence sensor for cadmium(II). Inorganic Chemistry 2011; 50(20): 10041-10046. doi: 10.1021/ic2008182
40. Hao J, Li XY, Zhang Y, Dong WK. A reversible bis (salamo)-based fluorescence sensor for selective detection of Cd2+ in water-containing systems and food samples. Materials 2018; 11(4): 523. doi: 10.3390/ma11040523