The Effect of Fish Farming on Zooplankton Fauna in Kozan Dam Lake (Adana)
Ahmet BOZKURT1,*, Cem TUGYAN1
1İskenderun Technical University, Faculty of Marine Sciences and Technology, İskenderun, Hatay, Turkey
[email protected], ORCID: 0000-0001-6673-550X [email protected], ORCID: 0000-0001-8653-1360
Received: 21.04.2020 Accepted: 30.05.2020 Published: 25.06.2020
Abstract
The effect of aquaculture on water quality (Dissolved Oxygen, temperature, pH, conductivity, NO2-N, NO3-N, NH4-N, PO4-P and chlorophyll-a) and zooplankton fauna was investigated in Kozan Dam Lake. As a result of the study, it was determined that fish farming did not have a statistically effect on zooplankton fauna and water quality parameters, but it caused some minor changes. In the study, a total of 50 zooplankton species were identified, including 29 from rotifers, 15 from cladocerans and 6 from copepods and Asplanchna priodonta, Polyarthra
dolichoptera, Bosmina longirostris Ceriodaphnia pulchella were found in both stations every
month during the study. While the reference station had more species in January, February, March, April, May, June, August, October and November than in the cage station, more species were found in the cage station only in September and November than in the reference station. The annual zooplankton abundance was 3.118±3.927 ind/m3 at the cage station and 2.552±2.452 ind/m3 at the reference station. Rotifer species and abundance were higher at the cage station whereas cladocer and copepod species and abundance were higher at the reference station. In the study, the species found only in the cage station were Lecane bulla and Disparalona rostrata while the species found only in the reference station were Cephalodella gibba, Filinia terminalis and Macrothrix laticornis.
Keywords: Zooplankton; Fish farming; Water quality; Kozan Dam Lake.
Kozan Baraj Gölü'nde (Adana) Balık Yetiştiriciliğinin Zooplankton Faunası Üzerine Etkisi
Öz
Kafeste balık yetiştiriciliğinin su kalitesi (Oksijen, sıcaklık, pH, iletkenlik, NO2-N, NO3 -N, NH4-N, PO4-P ve klorofil-a) ve zooplankton faunası üzerine etkisi Kozan Baraj Gölü’nde araştırılmıştır. Çalışma sonucunda balık yetiştiriciliğinin, bazı su kalite parametreleri ve zooplankton faunası üzerine istatistiki açıdan bir etkisinin olmadığı, ancak küçük değişikliklere neden olduğu belirlenmiştir. Çalışmada, Rotifera’dan 29, Cladocera’dan 15 ve Copepoda’dan 6 olmak üzere toplam 50 zooplankton türü tespit edildi ve çalışma süresince Asplanchna priodonta,
Polyarthra dolichoptera, Bosmina longirostris Ceriodaphnia pulchella’nın her ay bulundukları
belirlenmiştir. Referans istasyonunda Ocak, Şubat, Mart, Nisan, Mayıs, Haziran, Ağustos, Ekim ve Kasım (9 ay) aylarında kafes istasyonundakinden daha fazla tür bulunurken, kafes istasyonunda sadece Eylül ve Kasım aylarında (2 ay) referans istasyonundakinden daha fazla tür bulundu. Yıllık zooplankton bolluğu, kafes istasyonunda 3.118 ± 3.927 birey/m3 ve referans istasyonunda 2.552 ± 2.452 birey/m3 idi. Rotifer türleri ve bollukları kafes istasyonunda daha yüksekken kladoser ve kopepod türleri ve bollukları referans istasyonunda daha yüksekti. Çalışmada sadece kafes istasyonunda bulunan türler Lecane bulla ve Disparalona rostrata, sadece referans istasyonunda bulunan türler Cephalodella gibba, Filinia terminalis ve Macrothrix
laticornis idi.
Anahtar kelimeler: Zooplankton, Balık çiftliği, Su kalitesi, Kozan Baraj Gölü.
1. Introduction
In order to increase fish production, aquaculture was started in dam lakes with a protocol signed between the General Directorate of Agricultural Production (TÜGEM) and the General Directorate of State Hydraulic Works (DSI) in 1994 [1]. As a result, in Turkey, it was established in trout production farm in a cage in many reservoirs.
Good quality in water is essential in fish production [2]. However, due to daily feed intake and routine processes in fish farm, water quality is significantly affected since nitrate, nitrite, ammonium, phosphate, dissolved substances such as inedible feed, food waste and discharge products are directly released into the environment [3-5]. These cause growth disorders in fish, changes in benthos and eutrophication, and they are known to bring many environmental
problems such as chemical contamination, changes in physical parameters, and the spread of diseases caused by parasites and fungi [6, 7].
Since high density fish is usually stocked in cage fish farm, it is inevitable to use drugs and chemicals for fish health. Some of these are antifungals and antibiotics, copper-containing anti-fooling dyes, herbicides and phosphate-containing (Trisodium phosphate) disinfectants.
As an important link in the aquatic food web, zooplankton is one of the essential components of all aquatic ecosystems. In addition, some species of zooplankton are used in various studies as water quality, pollution and eutrophication indicator due to their sensitivity to environmental changes [8-12, 14]
There is a close relationship between the efficiency of the aquatic environment and the diversity and abundance of zooplankton. Zooplanktonic organisms are the main biotic factors of freshwater environments, as they have a significant impact on the growth, survival rate and distribution of fish larvae, as their reproductive periods are short, and their populations grow rapidly and have a renewal feature in a short time.
In this study, the effects of trout production in net cages (600 ton/year) on the water quality and zooplankton fauna were investigated in Kozan Dam Lake. In addition, it is thought that this study will provide data for future water quality, zooplankton and fishing activities.
2. Materials and Methods
The study was carried out between January 2011 and December 2011 in Kozan Dam Lake, which has 6 km2 lake area, in Adana province Kozan district (Fig. 1). The dam lake was built between 1967 and 1972 for irrigation purposes. The body volume of the dam, which is the rock body fill type, is 1680000 m³, its height from the river bed is 78.50 m, the lake volume at normal water level is 170.34 hm³, and the lake area at normal water level is 6.42 km². It provides irrigation services on an area of 10220 hectares. In addition, electricity production started in the dam lake in 2010/2011 [15].
Zooplankton samples were taken from 4 stations with horizontal and vertical hauls by using 60 μm mesh size plankton nets on monthly basis for systematic analyses. Zooplankton abundance was determined from the samples taken from first two stations (station 1: cage station and station 2: reference station). On the other hand, samples from the first two stations were used to determine the effect of fish production on zooplankton abundance and diversity. Six litres of water samples were collected from every water depths (surface, 1, 2.5, 5, 10, 15, 20, 30 and 40 m) of first and
One lt and 0.5 lt of water was used for chlorophyll-a analysis and chemical analysis respectively. The remaining part (4.5 lt) was filtered from a collector having a mesh size of 60 μm and zooplankton was fixed in 4% formaldehyde in 100 cc glass jars. Dissolved oxygen, water temperature, pH and conductivity were measured directly at the field by means of digital instruments (oxygen and temperature: YSI model 52 oxygen meter; pH: YSI 600 pH meter; conductivity: YSI model 30 salinometer). Merck spectroquant Nova 60 spectrophotometer and it’s procedure was used to determine NO2-N, NO3-N, NH4-N, PO4-P; the method in APHA 1995 was used to determine chlorophyll-a spectrophotometrically. Secchi Disk depth was measured using a Secchi Disk with a diameter of 20 cm.
Figure 1: Kozan Dam Lake and sampling stations
The highest depths were 47 m, 44 m, 31 m and 26 m in May, while the lowest depths were 31 m, 26 m, 12 m and 10 m in October at the cage station, reference station, third station and fourth station, respectively.
Species identifications were made using a binocular microscope according to the works of Edmondson [16], Scourfield and Harding [17], Dussart [18], Kiefer and Fryer [19], Koste [20], Negrea [21], Segers [22], De Smet [23, 24], Nogrady and Segers [25], Hołynska et al. [26] and Benzie [27].
Zooplankton count was performed using an invert microscope in a petri dish with 2 mm lines at the bottom. The sample cup was made homogenized by shaking and 2 cc sub-sample was taken from the cup and it was placed in a petri dish and the individuals of each species were
separately counted. This process has been repeated 4-5 times. SPSS package software was used for statistical analyses (t test).
3. Results
Although there are differences between the cage station and the reference station in the water quality parameters (Secchi depth, temperature, chlorophyll-a, conductivity, dissolved oxygen, pH, NO2-N, NO3-N, NH4-N and PO4-P) (Fig. 2), there is no statistical difference.
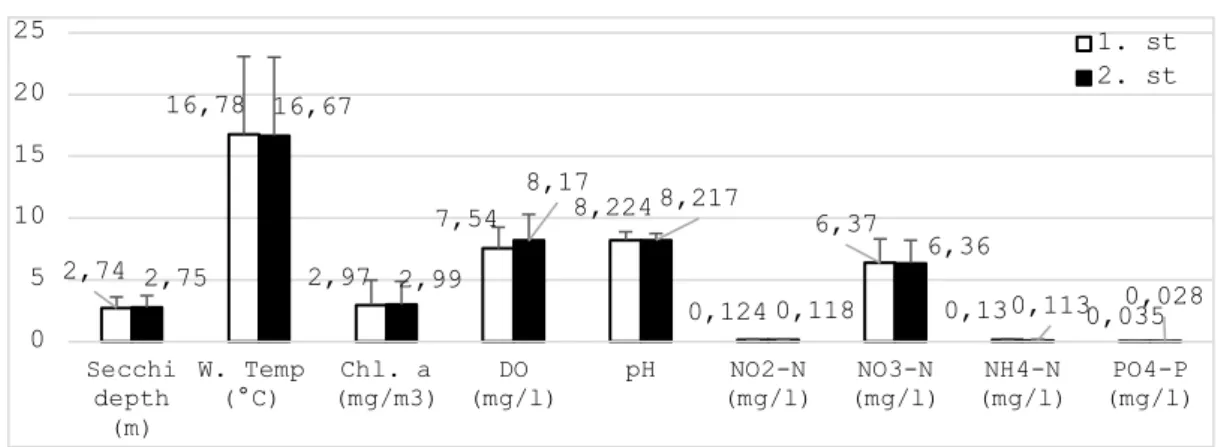
Figure 2: Annual average values of water quality parameters at the cage station and reference stations
The average Secchi Disc depths were very close at both stations, and were determined as 2.74±0.87 at the cage station and 2.75±0.98 at the reference station (Fig. 2).
The temperature was found almost the same at both stations. While the average temperature was 16.78±6.30 °C and 16.67±6.35 °C at the cage station and the reference station respectively. The temperature was higher at the cage station for 8 months (January, February, March, May, July, August, September, October) and at the reference station for 3 months (April, June, November), and it was equal at both stations in December (Fig. 3B).
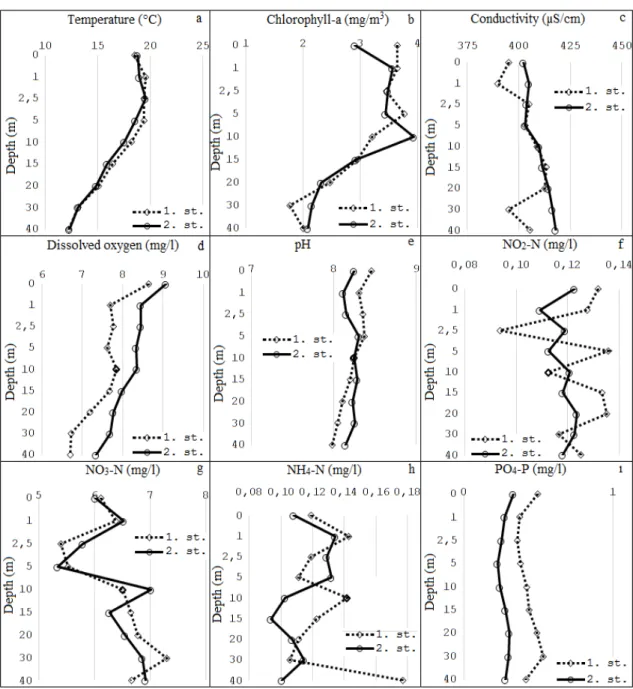
It was determined that the temperature increased to a depth of 2.5 m from the surface and decreased from this depth to the bottom. The temperature was higher in the cage station at depths of 1, 5, 10, 15, 20 and 30 m (6 depths), while it was higher in the reference station at 0, 2.5 and 40 m depth (3 depths) (Fig. 4a).
The average chlorophyll-a was 2.97±2.013 mg/m3 at the cage station and 2.99±1.89 mg/m3 at the reference station. While chlorophyll-a was high in the cage station for 5 months (January, March, April, August, November), it was higher in the reference station for 7 months (February, May, June, July, September, October and December). Chlorophyll-a, which increased in spring and autumn in both stations, was close to each other in all months (Fig. 3C). Although
2,74 16,78 2,97 7,54 8,224 0,124 6,37 0,13 0,035 2,75 16,67 2,99 8,17 8,217 0,118 6,36 0,113 0,028 0 5 10 15 20 25 Secchi depth (m) W. Temp
(°C) (mg/m3)Chl. a (mg/l)DO pH (mg/l)NO2-N (mg/l)NO3-N (mg/l)NH4-N (mg/l)PO4-P
1. st 2. st
chlorophyll-a was generally irregular at both stations, it was higher at the first 10 m depth and then decreased to the bottom. While chlorophyll-a was high at 0, 1, 5, 15, 20 m depths at the cage station, it was higher at the reference station at 2.5, 10, 30, 40 m depths (Fig. 4b).
Figure 3: Water quality parameters in the study 0 1 2 3 4 5 J F M A M J J A S O N D Secchi depth (m) A st. 1 st. 2 0 5 10 15 20 25 J F M A M J J A S O N D Water temperature (°C) B st. 1 st. 2 0 2 4 6 8 J F M A M J J A S O N D Chlorophyll-a (mg/m3) C st. 1 st. 2 360 400 440 480 J F M A M J J A S O N D Conductivity (µS/cm) D st. 1 st. 2 0 4 8 12 J F M A M J J A S O N D Dissolved oxygen (mg/l) E st. 1 st. 2 6 8 10 12 J F M A M J J A S O N D pH F st. 1 st. 2 0 0,04 0,08 0,12 J F M A M J J A S O N D NO2-N (mg/l) G st. 1 st. 2 0 2 4 6 8 10 J F M A M J J A S O N D NO3-N (mg/l) H st. 1 st. 2 0 0,2 J F M A M J J A S O N D NH4-N (mg/l) I st. 1 st. 2 0 0,02 0,04 0,06 J F M A M J J A S O N D PO4-P (mg/l) J st. 1 st. 2
The average conductivity was found as 403.14±34.01 μS/cm and 409.12±21.82 μS/cm at the cage station and reference station respectively. Although average conductivity values were close at both stations, it was generally a little higher at the reference station. While the conductivity was higher at the reference station in January, February, March, April, May, June, July, August, September, it was higher at the cage station in October, November and December (Fig. 3D). The conductivity depending on the depth changed irregularly to a depth of 5 m in the reference station and increased up to 40 m from here, while it displayed irregular fluctuations in depth at the cage station. Thus, the conductivity was more in the cage station at depths of 2.5, 5, 15 m, while it was more in the reference station at depths of 0, 1, 10, 20, 30 and 40 m (Fig. 4c).
Average dissolved oxygen values were 7.54±1.72 mg/l at the cage station and 8.17±2.13 mg/l at the reference station. Dissolved oxygen (DO) was high at the reference station in January, February, March, June, July, September, October, November, December, whereas it was high in the cage station in April, May and August (Fig. 3E). At both stations, DO was the most abundant on the surface water and its quantity decreased with increasing depth. DO at all depths was higher at the reference station than cage station (Fig. 4d).
It was determined that the pH was 8.224±0.673 at the cage station and 8.217±0.529 at the reference station, and the monthly average pH values at the stations were almost equal. The pH was higher in the cage station in February, March, April, May, June, September, October, November, while it was higher in the reference station in January, July, August and December (Fig. 3F). In the cage station the pH was high until 10 m depth from the surface but at the reference station it higher from 10 m depth to the bottom. Thus, pH was higher at 0, 1, 2.5, 5 m depths at the cage station, whereas it was higher at 10, 15, 20, 30 and 40 m depths at the reference station (Fig. 4e).
Nitrite nitrogen (NO2-N) was 0.124±0.05 mg/l and 0.118±0.04 mg/l at the cage station and reference station respectively. NO2-N was higher in the reference station in March, April, May, June, July, August, November, and December for most of the year, while it was higher in the cage station in January, February, September, October (Fig. 3G). The average NO2-N values measured in the dam lake showed an irregular increase and decrease in both stations depending on the depth, and an inverse relationship was observed between the stations in terms of nitrogen values. The mean NO2-N was high at the cage station at 0, 1, 5, 15, 20, 40 m depth, and higher at the reference station at 2.5, 10 and 30 m depths (Fig. 4f).
The mean nitrate nitrogen (NO3-N) was 6.37±1.94 mg/l at the cage station and 6.36±1.84 mg/l at the reference station. NO3-N values were higher in the cage station for 7 months (February, March, June, July, September, October, November) and in the reference station for 5 months (January, April, May, August, December); It was detected that the values between the two stations were closer to each other except February, May and July (Fig. 3H). The vertical distribution of NO3-N at both stations showed irregular fluctuations. NO3-N was found high in the cage station at depths of 0, 5, 15, 20, 30 m, while it was found more in the reference station at depths of 1, 2.5, 10, 40 m (Fig. 4g).
The average ammonium nitrogen (NH4-N) was 0.13±0.08 mg/l at the cage station and 0.11±0.06 mg/l at the reference station. NH4-N values showed monthly irregular increases and decreases at both stations. While NH4-N was higher at the cage station in January, March, April,
May, July, August, September, December, it was higher at the reference station in February, June, October and November. It was found that the difference between the two stations was high in March, May and June, and closer to each other in other months (Fig. 3I). The vertical distribution of ammonium nitrogen shows irregular fluctuations in both stations. Ammonium nitrogen was found at 0, 1, 10, 15, 20, 40 m depths at the cage station, whereas it was more at the reference station at 2.5, 5, 30 m depths (Fig. 4h).
The average PO4-P was calculated to be 0.035 ± 0.011 mg/l at the cage station and 0.028±0.012 mg/l at the reference station. PO4-P was high in the cage station during the months of January, February, March, April, June, July, August, September, October, November, but higher in the reference station in May and December (Fig. 3J). While PO4-P showed a depth-dependent decrease in both stations, it was higher at all depths in the cage station (Fig. 4i).
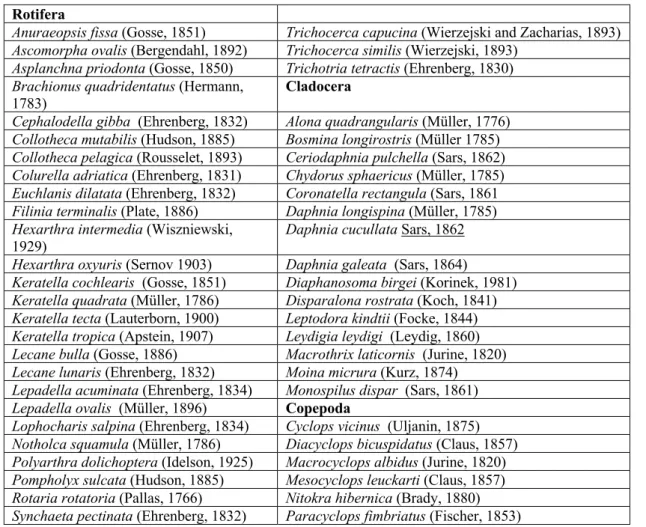
In the study, a total of 50 zooplankton species were identified, including 29 from rotifers, 15 from cladocerans and 6 from copepods (Table 1). Seventeen families were identified from Rotifera and Brachionidae was the most species rich family with 7 species, followed by Collothecidae, Hexarthridae, Lecanidae, Lepadellidae, Synchaetidae and Trichocercidae with 2 species each one. The remaining families from Rotifera were found to contain only one species in each one. Seven families found from Cladocera, Chydoridae was the most species rich family with 6 species, followed by Daphniidae with 4 species and other families were represented only one species each one. Two families were detected from Copepoda, Cyclopidae was the richest family with 5 species, but Ameiridae (Harpacticoida) was represented by only one species.
A. priodonta, P. dolichoptera, B. longirostris C. pulchella were found in both stations every month during the study. Collotheca mutabilis, K. quadrata, Pompholyx sulcata, Rotaria rotatoria, D. galeata, D. birgei were found in both stations equal number for several months.
In the study, the species found only in the cage station were L. bulla and D. rostrata while the species found only in the reference station were C. gibba, F. terminalis and M. laticornis. In addition, the species found mostly in the cage station were A. ovalis, C. pelagica, E. dilatata, K. cochlearis and L. lunaris, while the species mostly found in the reference station were N. squamula, S. pectinata, T. capucina, T. similis, D. cucullata, D. longispina, M. micrura, C. vicinus, D. bicuspidatus, M. albidus (Table 2).
The species found only 1 or 2 times during the study are Anuraeopsis fissa, Brachionus quadridentatus, Colurella adriatica, Hexarthra oxyuris, K. tecta, Lepadella acuminata, L. ovalis, Lophocharis salpina, Trichotria tetractis, Leptodora kindtii, Alona quadrangularis, Coronatella
rectangula, Chydorus sphaericus, Leydigia leydigi, Monospilus dispar, Mesocyclops leuckarti, Paracyclops fimbriatus, Nitokra hibernica, and therefore no comment on these species (Table 2).
Table 1: Zooplankton species in the study and their monthly presences Rotifera
Anuraeopsis fissa (Gosse, 1851) Trichocerca capucina (Wierzejski and Zacharias, 1893) Ascomorpha ovalis (Bergendahl, 1892) Trichocerca similis (Wierzejski, 1893)
Asplanchna priodonta (Gosse, 1850) Trichotria tetractis (Ehrenberg, 1830) Brachionus quadridentatus (Hermann,
1783)
Cladocera
Cephalodella gibba (Ehrenberg, 1832) Alona quadrangularis (Müller, 1776) Collotheca mutabilis (Hudson, 1885) Bosmina longirostris (Müller 1785) Collotheca pelagica (Rousselet, 1893) Ceriodaphnia pulchella (Sars, 1862) Colurella adriatica (Ehrenberg, 1831) Chydorus sphaericus (Müller, 1785) Euchlanis dilatata (Ehrenberg, 1832) Coronatella rectangula (Sars, 1861 Filinia terminalis (Plate, 1886) Daphnia longispina (Müller, 1785) Hexarthra intermedia (Wiszniewski,
1929) Daphnia cucullata Sars, 1862
Hexarthra oxyuris (Sernov 1903) Daphnia galeata (Sars, 1864) Keratella cochlearis (Gosse, 1851) Diaphanosoma birgei (Korinek, 1981) Keratella quadrata (Müller, 1786) Disparalona rostrata (Koch, 1841) Keratella tecta (Lauterborn, 1900) Leptodora kindtii (Focke, 1844) Keratella tropica (Apstein, 1907) Leydigia leydigi (Leydig, 1860) Lecane bulla (Gosse, 1886) Macrothrix laticornis (Jurine, 1820) Lecane lunaris (Ehrenberg, 1832) Moina micrura (Kurz, 1874) Lepadella acuminata (Ehrenberg, 1834) Monospilus dispar (Sars, 1861) Lepadella ovalis (Müller, 1896) Copepoda
Lophocharis salpina (Ehrenberg, 1834) Cyclops vicinus (Uljanin, 1875) Notholca squamula (Müller, 1786) Diacyclops bicuspidatus (Claus, 1857) Polyarthra dolichoptera (Idelson, 1925) Macrocyclops albidus (Jurine, 1820) Pompholyx sulcata (Hudson, 1885) Mesocyclops leuckarti (Claus, 1857) Rotaria rotatoria (Pallas, 1766) Nitokra hibernica (Brady, 1880) Synchaeta pectinata (Ehrenberg, 1832) Paracyclops fimbriatus (Fischer, 1853)
The most species were found at the reference station (23 species) in March, followed by 19 species in September (cage station) and December (referance station). The least species was found in both first two stations in July (5 species) (Fig. 5).
While there were more species in the reference station in January, February, March, April, May, June, August, October, November (9 months), more species were found in the cage station only in September and November (2 months). On the other hand, in July, an equal number of species was found at both stations (Fig. 5).
Table 2: Monthly distribution of zooplankton at the cage and reference stations +: available, -: absent)
Month J F M A M J J A S O N D Total Species stations 1/2 1/2 1/2 1/2 1/2 1/2 1/2 1/2 1/2 1/2 1/2 1/2 1/2
Rotifera
A. fissa -/- -/- -/- -/+ -/- -/- -/- -/- -/- -/- -/- -/- 0/1 A. ovalis -/- -/- -/- -/- +/+ +/+ -/- +/+ +/+ +/- +/+ -/- 6/5
A. priodonta +/+ +/+ +/+ +/+ +/+ +/+ +/+ +/+ +/+ +/+ +/+ +/+ 12/12 B. quadridentatus -/- -/- +/- -/- -/- -/- -/- -/- -/- -/- -/- -/- 1/0 C. gibba -/- -/- -/+ -/- -/- -/- -/- -/- -/- -/+ -/- -/- 0/2 C. mutabilis -/- -/- -/- +/+ -/+ -/- -/- -/- -/- -/- +/+ +/- 3/3 C. pelagica +/+ +/+ +/+ +/+ -/- -/- -/- -/- +/+ -/- +/+ +/- 7/6 C. adriatica -/- -/- -/- -/+ -/- -/- -/- -/- -/- -/- -/- -/- 0/1 E. dilatata -/- -/- -/- -/- -/- -/- -/- -/- +/- -/- -/- +/+ 2/1 F. terminalis -/- -/- -/+ -/+ -/- -/- -/- -/- -/- -/- -/- -/+ 0/3 H. intermedia -/- -/- +/- -/- -/- -/- -/- -/- -/- -/+ -/+ -/- 1/2 H. oxyuris -/- -/- -/- -/- -/+ -/- -/- -/ -/- -/- -/- -/- 0/1 K. cochlearis -/- -/- +/+ +/- -/- -/- -/- -/- -/- -/- +/+ -/- 3/2 K. quadrata +/- -/- +/+ -/- +/+ +/+ -/- -/+ +/+ +/+ -/+ +/- 7/7 K. tecta -/- -/- -/+ -/- -/- -/- -/- -/- -/- -/- -/- -/- 0/1 K. tropica -/- -/- -/- +/- -/+ -/- -/- -/- -/- -/- -/- -/- 1/1 L. bulla -/- -/- -/- -/- -/- +/- -/- -/- +/- -/- -/- -/- 2/0 L. lunaris -/- -/- +/- -/- -/+ -/- +/- +/- +/- +/- +/- -/- 6/1 L. acuminata -/- -/- -/+ -/- -/- -/- -/- -/- -/- -/- -/- -/- 0/1 L. ovalis -/- -/- -/+ -/- -/- +/- -/- -/- -/- -/- -/- -/- 1/1 L. salpina -/- -/- -/- -/- -/- -/- -/- -/- -/- -/- -/+ -/- 0/1 N. squamula -/+ -/- -/+ -/- -/- -/- -/- -/- -/- -/- +/- -/- 1/2 P. dolichoptera +/+ +/+ +/+ +/+ +/+ +/+ +/+ +/+ +/+ +/+ +/+ +/+ 12/12 P. sulcata +/- -/- -/+ -/+ -/- +/+ -/- -/- +/+ +/- -/- -/- 4/4 R. rotatoria +/+ -/- +/+ -/- -/- -/- -/- -/- +/+ -/- -/- +/+ 4/4 S. pectinata +/+ +/+ +/+ +/+ -/- -/+ -/- -/- -/- -/- +/+ +/+ 6/7 T. capucina -/- -/+ -/- -/- -/- +/+ -/+ -/- -/- -/- -/- -/- 1/3 T. similis -/+ +/+ +/+ +/+ +/+ -/+ -/+ -/+ -/+ -/- +/- +/+ 6/10 T. tetractis -/- -/+ -/- -/- -/- -/- -/- -/- -/- -/- -/- -/- 0/1 Cladocera B. longirostris +/+ +/+ +/+ +/+ +/+ +/+ +/+ +/+ +/+ +/+ +/+ +/+ 12/12 C. pulchella +/+ +/+ +/+ +/+ +/+ +/+ +/+ +/ +/+ +/+ +/+ +/+ 12/12 D. cucullata -/- -/- -/+ -/+ -/- +/+ +/- +/+ +/+ -/- -/- -/- 4/5 D. galeata -/- -/- +/+ -/- -/- +/+ -/- -/- -/- -/- -/- -/- 2/2 D. longispina -/+ +/+ +/+ +/- +/+ -/+ -/+ -/- -/+ -/- +/- -/+ 5/8 D. birgei -/+ -/- +/- -/- -/- +/+ +/+ +/+ +/+ +/+ +/+ -/- 7/7 L. kindtii -/- -/- -/- -/- -/- +/- -/- -/- -/- -/- -/- -/- 1/0 M. micrura -/- -/- -/+ -/- -/- +/+ -/- -/- +/+ -/+ -/- -/+ 2/5 A. quadrangularis -/- -/- -/- -/- -/- -/- -/- -/- -/- +/+ -/- -/- 1/1 C. rectangula -/- -/- -/- -/- -/- -/- -/- -/- -/- +/- -/- -/+ 1/1 C. sphaericus -/- -/- -/- -/- +/- -/- -/- -/- -/- -/- -/- -/- 1/0 D. rostrata +/- -/- -/- -/- -/- -/- -/- -/- -/- -/- -/- +/- 2/0 L. leydigi -/- -/- -/- -/- -/- -/- -/- -/+ -/- -/- -/- -/- 0/1 M. laticornis -/- -/- -/- -/- -/- -/- -/- -/- -/- -/+ -/- -/+ 0/2 M. dispar -/- -/- -/- -/- -/- -/- -/- -/- -/- -/+ -/- -/- 0/1 Copepoda C. vicinus +/+ +/+ +/+ +/- -/+ +/+ +/+ +/+ +/+ -/+ +/+ +/+ 10/11 D. bicuspidatus -/+ -/+ +/- -/+ -/+ +/+ -/+ -/- +/- -/- +/- +/+ 5/7 M. albidus -/- -/+ -/+ -/+ -/- -/- -/- -/- +/+ -/- -/- -/+ 1/5 M. leuckarti -/- -/- -/- -/- +/- -/- -/- -/- -/- -/- -/- -/- 1/0 P. fimbriatus -/- -/- -/- -/- -/- -/- -/- -/- -/- +/+ -/- -/- 1/1 N. hibernica -/- -/- -/- -/- -/- -/- -/- -/- -/- -/- -/- -/+ 0/1
Figure 5: Species number of cage and reference stations according to months.
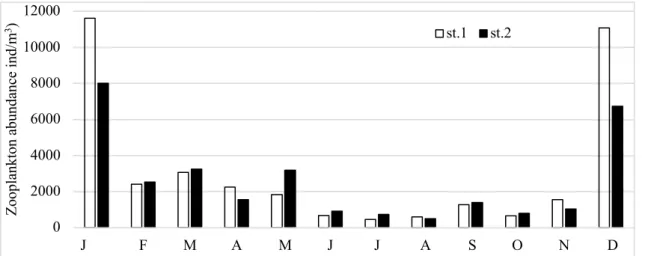
Figure 6: Abundance of zooplankton in cage and reference stations according to the months (ind/m3)
The annual zooplankton density was 3.118±3.927 ind/m3 at the cage station and 2.552±2.452 ind/m3 at the reference station. It was found that zooplankton was the most abundant at the reference station (11.607 ind/m3) in January and December (11.069 ind/m3), and at least at the reference station in July (460 ind/m3). While the amount of zooplankton was high at the reference station in February, March, May, June, July, September and October (7 times), it was high at the cage station (5 times) in January, April, August, November and December (Fig. 6).
The abundance of zooplankton varied at the cage and reference stations during the sampling periods, but was not statistically significant. While Rotifera was more abundant at the cage station, Cladocera and Copepoda were more abundant at the reference station. Thus, Ascomorpha ovalis,
Asplanchna priodonta, Colletheca pelagica, Lecane lunaris, Polyarthra dolichoptera, Synchaeta pectinata, Trichocerca capucina (Rotifera); Daphnia longispina (Cladocera) were abundant at
the cage station, while other species (Keratella quadrata, Pompholyx sulcata, Trichocerca similis from Rotifera; Bosmina longirostris, Cephalodella pulchella, Daphnia cucullata, D. galeata,
11 9 18 11 8 15 5 6 19 12 16 13 13 13 23 14 9 16 5 9 16 13 14 19 0 2 4 6 8 10 12 14 16 18 20 22 24 J F M A M J J A S O N D Speci es num ber st. 1 st. 2 0 2000 4000 6000 8000 10000 12000 J F M A M J J A S O N D Zo op la nk to n ab un da nc e in d/ m 3) st.1 st.2
Diaphanosoma birgei, Moina micrura, Coronatella rectangula from Cladocera; Cyclops vicinus, Diacyclops bicuspidatus and Paracyclops fimbriatus from Copepoda) were more abundant at the
reference station (Table 3).
Table 3: Abundance of zooplankton species at cages and reference stations (ind/m3)
Stations 1. st. 2. st. Rotifera Ascomorpha ovalis 1980±3890.16 905±1117.71 Asplanchna priodonta 689±412.15 592±357.23 Colletheca pelagica 1336±1159.44 796±666.45 Keratella quadrata 552±452.53 740±1333.16 Lecane lunaris 378±23.54 350±60 Polyarthra dolichoptera 2955±2550.28 2460±1828.26 Pompholyx sulcata 515±107.61 859±860.67 Synchaeta pectinata 23567±2783 16498±20163.54 Trichocerca capucina 1705±978 1079±1170.46 Trichocerca similis 246±7.23 447±174.37 Cladocera Bosmina longirostris 365±121.15 591±225.73 Cephalodella pulchella 422±203.06 508±235.96 Daphnia cucullata 333±117.92 464±253.47 D. galeata 311±110 431±145 D. longispina 604±313.52 475±301.91 Diaphanosoma birgei 509±214.82 516±200.56 Moina micrura 310±76 342±91.27 Coronatella rectangula 252±49 260±97 Chydorus sphaericus 236±102 184±66 Copepoda Cyclops vicinus 410±212.14 551±291.23 Diacyclops bicuspidatus 277±56.61 320±126.82 Paracyclops fimbriatus 241±68 271±89 Copepodit 687±711.24 538±313.39
The abundance of zooplankton species at the cage and reference stations is as in Table 4. The density of rotifers was more abundant at the cage station (3941±1154 ind/m3), while cladocer (1569±2443 ind/m3) and copepod (600±445 ind/m3) were more abundant at the reference station (Table 4).
4. Discussion
Kozan Dam Lake irrigates approximately 10220 ha of agricultural land and generates electricity. The streams feeding the dam are Kırksu and Düzağaç Creek. For this purpose, there is a water flow and mixture in the reservoir, which has continuous water inlet and outlet. This situation causes vertical and horizontal mixing of the reservoir water. Therefore, it was found that
there was no significant difference between zooplankton and water quality parameters at different depths of both stations.
The effects of cage fish farming have been analysed by various researchers and it was reported that nitrogen, phosphor and organic material load in sediment were significantly affected by these changes. Researches have shown that negative effects vary according to fish farm capacity, currents, change ratio and total volume of water and the technology used in fish farming [28-30].
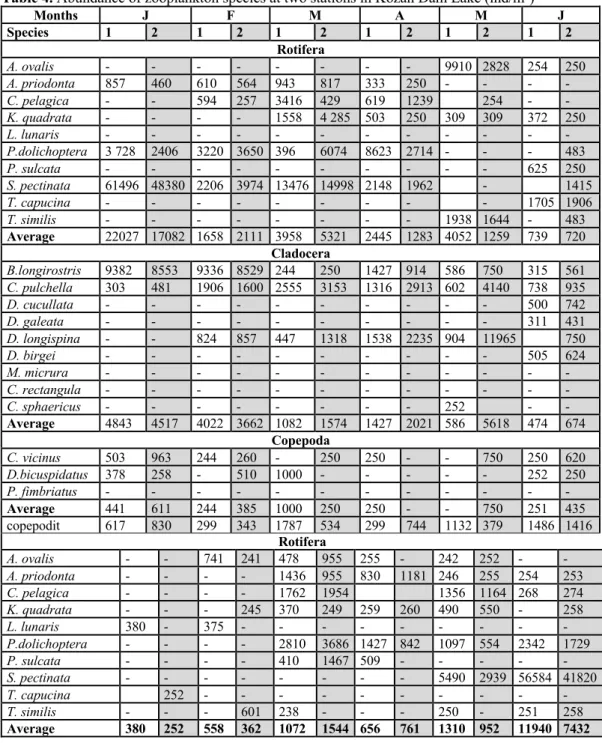
Table 4. Abundance of zooplankton species at two stations in Kozan Dam Lake (ind/m3)
Months J F M A M J Species 1 2 1 2 1 2 1 2 1 2 1 2 Rotifera A. ovalis - - - 9910 2828 254 250 A. priodonta 857 460 610 564 943 817 333 250 - - - - C. pelagica - - 594 257 3416 429 619 1239 254 - - K. quadrata - - - - 1558 4 285 503 250 309 309 372 250 L. lunaris - - - - P.dolichoptera 3 728 2406 3220 3650 396 6074 8623 2714 - - - 483 P. sulcata - - - 625 250 S. pectinata 61496 48380 2206 3974 13476 14998 2148 1962 - 1415 T. capucina - - - 1705 1906 T. similis - - - 1938 1644 - 483 Average 22027 17082 1658 2111 3958 5321 2445 1283 4052 1259 739 720 Cladocera B.longirostris 9382 8553 9336 8529 244 250 1427 914 586 750 315 561 C. pulchella 303 481 1906 1600 2555 3153 1316 2913 602 4140 738 935 D. cucullata - - - 500 742 D. galeata - - - 311 431 D. longispina - - 824 857 447 1318 1538 2235 904 11965 750 D. birgei - - - 505 624 M. micrura - - - - C. rectangula - - - - C. sphaericus - - - 252 - - Average 4843 4517 4022 3662 1082 1574 1427 2021 586 5618 474 674 Copepoda C. vicinus 503 963 244 260 - 250 250 - - 750 250 620 D.bicuspidatus 378 258 - 510 1000 - - - 252 250 P. fimbriatus - - - - Average 441 611 244 385 1000 250 250 - - 750 251 435 copepodit 617 830 299 343 1787 534 299 744 1132 379 1486 1416 Rotifera A. ovalis - - 741 241 478 955 255 - 242 252 - - A. priodonta - - - - 1436 955 830 1181 246 255 254 253 C. pelagica - - - - 1762 1954 1356 1164 268 274 K. quadrata - - - 245 370 249 259 260 490 550 - 258 L. lunaris 380 - 375 - - - - P.dolichoptera - - - - 2810 3686 1427 842 1097 554 2342 1729 P. sulcata - - - - 410 1467 509 - - - - - S. pectinata - - - 5490 2939 56584 41820 T. capucina 252 - - - - T. similis - - - 601 238 - - - 250 - 251 258 Average 380 252 558 362 1072 1544 656 761 1310 952 11940 7432
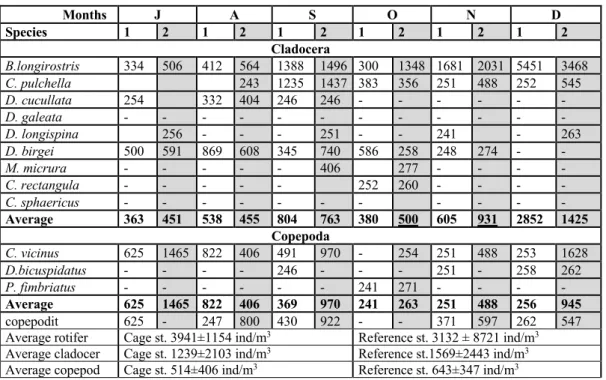
Table 4: continued Months J A S O N D Species 1 2 1 2 1 2 1 2 1 2 1 2 Cladocera B.longirostris 334 506 412 564 1388 1496 300 1348 1681 2031 5451 3468 C. pulchella 243 1235 1437 383 356 251 488 252 545 D. cucullata 254 332 404 246 246 - - - - D. galeata - - - - D. longispina 256 - - - 251 - - 241 - 263 D. birgei 500 591 869 608 345 740 586 258 248 274 - - M. micrura - - - 406 277 - - - - C. rectangula - - - 252 260 - - - - C. sphaericus - - - - Average 363 451 538 455 804 763 380 500 605 931 2852 1425 Copepoda C. vicinus 625 1465 822 406 491 970 - 254 251 488 253 1628 D.bicuspidatus - - - - 246 - - - 251 - 258 262 P. fimbriatus - - - 241 271 - - - - Average 625 1465 822 406 369 970 241 263 251 488 256 945 copepodit 625 - 247 800 430 922 - - 371 597 262 547 Average rotifer Cage st. 3941±1154 ind/m3 Reference st. 3132 ± 8721 ind/m3
Average cladocer Cage st. 1239±2103 ind/m3 Reference st.1569±2443 ind/m3
Average copepod Cage st. 514±406 ind/m3 Reference st. 643±347 ind/m3
The effects of cage fish farming have been analysed by various researchers and it was reported that nitrogen, phosphor and organic material load in sediment were significantly affected by these changes. Researches have shown that negative effects vary according to fish farm capacity, currents, change ratio and total volume of water and the technology used in fish farming [28-30].
It has been reported that the most common effect of fish farming in lakes leads to a decrease in dissolved oxygen, pH values and Secchi Disk depth and causes an increase in suspended solids, nutrients, electrical conductivity and chlorophyll-a [31-33, 28]. However, Cornel and Whoriskey [34] reported that pH did not change in the cage station and reference station, and that fish farming did not affect the pH value. In another study at rainbow trout farm, pH and dissolved oxygen did not change significantly between stations, while nutrients (N, P) (excluding nitrite nitrogen) were higher in cage stations similar to those above [35]. Similarly, some other researchers declared that there was no difference between the cage station and reference station in terms of nitrite nitrogen and nitrate nitrogen [29]. Interestingly, Cornel and Whoriskey [34] reported that N and P levels may be the same at the cage station and the reference station in the fish farm that produce below their capacity.
The difference between the two stations in terms of water quality parameters is very small and close to each other and our findings are consistent with the literature findings in the other studies given above.
Determined water quality parameters; temperature (16.78±6.3°C), pH (8.224±0.623), nitrite nitrogen (0,124±0,05 mg/l), nitrate nitrogen (6.37±1.94 mg/l), NH4-N (0.13±0.08 mg/l) and phosphate (0.035±0.01 mg/l) values were higher in cage station but dissolved oxygen (8.17±2.13 mg/l), conductivity (401.91 ±99.07 μS/cm), chlorophyll-a (8.86±2.81 mg/m3) and sechi depth (2.75±0,98 m) were higher in reference station.
In the study, dissolved oxygen was close to each other at both stations, but it was higher in cold months, especially in the January, November and December reference stations. On the other hand, the vertical distribution of dissolved oxygen was higher at the reference station at all depths. This shows that fish farming in cage is also in agreement with previous studies, which caused a decrease in dissolved oxygen and Secchi Depth and an increase in nitrogen and phosphate compounds, especially in the places where cages are located.
Some of previous researchers reported that primary productivity increase in cage station due to the nutrients coming from feed and metabolism wastes and this increased the abundance of zooplanktonic organisms [35-37, 6]. Matsumura-Tundisi and Tundisi [38, 39] reported that zooplankton diversity and abundance changed in cage stations due to increased nutrients, phytoplankton, conductivity, bacteria, food item and other factors.
In a study carried out in a tilapia farm, Santos et al., [40] reported only small changes in zooplankton levels. Guo and Li [6] reported that Rotifera was found in small quantity in cage station, however it was more abundant in the station that was outside of the cage. Cladocera was more abundant in the cage station and less abundant in the other station and finally Copepoda abundance was the same in both stations.
During the study, more species were found in the reference station for 9 months, while more species were found in the cage station for 2 months. In parallel to Guo and Li [6] this result shows that the fish farming in lakes has a negative impact on zooplankton species diversity because fewer species have been identified at the cage station in the vast majority of the year.
Contrary to the number of species, the abundance of zooplankton was higher in the cage station (3.118±3.927 ind/m3) than reference station (2.552±2.452 ind/m3).
It has been reported that most zooplankton species (except Lepadella ovalis, Trichocerca
capucina, Leptodora kindtii, Diacyclops bicuspidatus, Mesocyclops leuckarti, Paracyclops fimbriatus) found in the study can be found in water bodies of various productivity levels and
sizes in different geographic regions and are tolerant to changes in water quality [41-46]. All species in the study were widespread in Turkey and worldwide because they were found in almost
all regions of Turkey [47-59] and they were reported from lots of study inland waters of Turkey [60, 58].
In terms of monthly availability, in parallel with the above declarations, Ascomorpha ovalis, Asplanchna priodonta, Collotheca pelagica, C. mutabilis, Euchlanis dilatata, Hexarthra intermedia, Keratella cochlearis, K. quadrata, Notholca squamula, Polyarthra dolichoptera, Pompholyx sulcata, Rotaria rotatoria, Synchaeta pectinata, Trichocerca capucina, Bosmina longirostris, Ceriodaphnia pulchella, Daphnia cucullata, Daphnia galeata, Diaphanosoma birgei, Cyclops vicinus and Diacyclops bicuspidatus were found equal number or very close each other in both stations.
Abundance of the species (Asplanchna priodonta, Keratella quadrata, Polyarthra dolichoptera, Pompholyx sulcata, Trichocerca capucina, Ceriodaphnia pulchella, Daphnia cucullata, D. galeata, D. longispina, Diaphanosoma birgei, Coronatella rectangula, Cyclops vicinus, Diacyclops bicuspidatus, Paracyclops fimbriatus) were found close to each other in both stations as above. As they are resistant to environmental variables, it is seen that these species are not affected by low level changes in water quality parameters related to aquaculture activities.
In terms of abundance, the eutrophication indicator Ascomorpha ovalis, Colletheca
pelagica, Lecane lunaris, Synchaeta pectinata and Chydorus sphaericus are expected to
predominate in the cage station. It is interesting that Bosmina longirostris, which is an indicator of eutrophication, is dominant at the reference station. The reason why it is scarce in the cage station is thought to be over-consumed by the local fish around the cage. There is not enough data to explain that Trichocerca similis and Moina micrura are more dominant at the reference station. In terms of monthly availability, Cephalodella gibba, Filinia terminalis and Macrothrix
laticornis which are widespread and tolerant to environmental changes [61-63, 42, 43], have never
been found at the cage station during the study. On the other hand, Lecane bulla and Disparalona
rostrata, which have ecological characteristics similar to the above species, have never been
found at the reference station. This can be explained by the fact that these species are in the dam lake only in a very small part of the year (2-3 months).
Cosmopolitan widespread species, T. similis, Daphnia longispina, Moina micrura,
Macrocyclops albidus were more dominant at the reference station but widespread cosmopolitan Lecane lunaris was found dominant in cage station. Since the zooplankton found in the reference
station are generally large in size, we think that they are consumed by fish that feed on waste feed around the cage, and therefore they are less in the cage station.
5. Conclusions
Our study is about comparing the effect of fish farming in lakes on water quality and zooplankton in two stations. It was determined that fish farming caused little changes (degradation) in water quality, rotifers were found in the area where they were fish production area, more in terms of species diversity and abundance, and cladocerans and copepods were found more in the area outside the place of fish production area.
References
[1] Anonymous, Sekizinci beş yıllık kalkınma planı su ürünleri ve su ürünleri sanayii özel
ihtisas komisyonu raporu Ankara. DPT: 2275-ÖİK. 588, 2001.
[2] Boyd, C.A., McNevin, A., Aquaculture. Aquaculture, Resource Use, and the Environment, 1-337, 2015.
[3] Aşır, U., Kesikköprü Baraj Gölü’nde ağ kafeslerde gökkuşağı alabalığının
(Oncorhynchus mykiss Walbaum,1972) pelet ve ekstrude yemle besiciliğinden kaynaklanan azot-fosfor yükünün tahmini. Doktora Tezi, Ankara Üniversitesi, Fen Bilimleri Enstitüsü, 2007.
[4] Das, P.C., Ayyappan, S., Jena, J., Comparative changes in water quality and role of
pond soil after application of different levels of organic and inorganic inputs. Aquaculture
Research, 36(8), 785-798, 2005.
[5] Tavares, L., Sipaúba, H., Millan, R.N., Santeiro Magalhães, R., Characterization of a
plankton community in a fish farm. Acta Limnologica Brasiliensia, 22(1), 60-69, 2010.
[6] Guo, L., Li, Z., Effects of nitrogen and phosphorus from fish cage-culture on the
communities of a shallow lake in middle Yangtze River basin of China. Aquaculture 226,
201-212, 2003.
[7] Guo, L., Li, Z., Xie, P., Ni, L., Assessment effects of cage culture on nitrogen and
phosphorus dynamics in relation to fallowing in a shallow lake in China. Aquaculture
International, 17, 229-241, 2009.
[8] Buhungu, S., Donou, M., Ntakimazi, G., Bonou, C.A., Montchowui, E., Identification
of characteristic zooplankton species in the Kinyankonge River basin, Burundi. International
Journal of Aquatic Biologia, 7(2), 71-84, 2019.
[9] Dede, A.N., Study on Rotifers zooplankton and pollution indicators species in Bhima
River near Sangam Village, Dist. Solapur. (M.S). Asian Journal of Multidisciplinary Studies,
4(3), 13-15, 2016.
[10] Gutkowska, A., Paturej, E., Kowalska, E., Rotifer trophic state indices as ecosystem
indicators in brackish coastal waters. Oceanologia, 55(4), 887–899, 2013.
[11] Kutama, R.M., Abubakar, M.M., Balarabe, M.L., The plankton as indicators of water
quality in Kusalla Reservoir: A shallow manmade lake. IOSR Journal of Pharmacy and Biological
Sciences, 9(3), 12-15, 2014.
[12] Loria, K., Freshwater zooplankton communities as indicators of habitat quality:
testing responses to multiple disturbances. Undergraduate Honors Theses, University of
Colorado, Boulder, 35, 2017.
[13] Neto, A.J.G., Silva, L.C., da Saggio, A.A., Rocha, O., Zooplankton communities as
[14] Parmar, T.K., Rawtani, D., Agrawal, Y.K., Bioindicators: the natural indicator of
environmental pollution. Frontiers In Life Science, 9(2), 110-118, 2016.
[15] Anonymous, Adana tarımsal sulama altyapısının analizi, sulamanın sorunları ve
çözüm önerileri. T.C. Gıda Tarım ve Hayvancılık Bakanlığı Adana Zirai Üretim İşletmesi
Tarımsal Yayım ve Hizmetiçi Eğitim Merkezi Müdürlüğü. Adana, 2013.
[16] Edmondson, W.T., Methods and Equipment, in Fresh-Water Biology, Second Education, John Wiley and Sons, New-York. Inc 1194-1202, 1959.
[17] Scourfield, D.J., Harding, J.P., Fresh-Water Biology As. Sci. Publ. New York, 1966. [18] Dussart, B., Les Copepodes des Eaux Continentales dÕ Europe Occidentale, Tome I,
Calanoides et Harpacticoides., Editions N. Boubee; et cie, Paris, 499, 1967.
[19] Kiefer, F., Fryer, G., Das Zooplankton der Binnengewässer, 2, 1-380. (E. Schweizerbart’sche Verlagsbuchhandlung, Stuttgart), 1978.
[20] Koste, W., Die Radertiere Mitteleuropas Ein Bestimmungswerk, Begründet Von Max
Voigt. Überordnung Monogononta. 2 Auflage Neubearbeitet Von II. Tefelband Berlin Stutgart,
234, 1978.
[21] Negrea, S.T., Fauna Republicii Socialiste Romania Vol. 4, 12. Crustacea Cladocera. Academia Republicii Socialiste Romania, Bucaresti, 339, 1983.
[22] Segers, H., Rotifera. Volume 2: The Lecanidae (Monogonota). Guides to the identification of the microinvertebrates of the continental waters of the world 6. SPB Academic Publishing, The Hague, 1995.
[23] De Smet, W.H., The Prolidae (Monogononta). Vol. 4. SPB Academic Publishing, Amsterdam, 1996.
[24] De Smet, W.H., The Dicranophoridae (Monogononta). Vol. 5. SPB Academic, 1997. [25] Nogrady, T., Segers, H., Rotifera vol. 6: Asplanchnidae, Gastropodidae, Lindiidae,
Microcodidae, Synchaetidae, Trochosphaeridae and Filinia. Guide to the identification of the
microinvertebrates of to the continental waters of the world. (Guides to the identification of the microinvertebrates of the continenta waters of the world 12 (ed. H.J. Dumont), Backhuys Publishers, 264, 2002.
[26] Hołynska, M., Reid, J.W., Ueda, H., Copepoda: Cyclopoida genera Mesocyclops and
Thermocyclops. In: Ueda H, Reid JW, editors. Guides to the identification of the
microinvertebrates of the continental waters of the world. Leiden: Backhuys Publishers. 213, 2003.
[27] Benzie, J.A.H., The Genus Daphnia (including Daphniopsis) (Anomopoda:
Daphniidae). Backhuys Publishers, Leiden: 377, 2005.
[28] Phillips, M.J., Beveridge, M.C.M., Ross, L.G., The environmental impact of salmonid
cage culture on inland fisheries: present status and future trends. Journal of Fish Biology,
27(Suppl. A), 123-137, 1985.
[29] Stirling, H.P., Dey, T., Impact of intensive cage fish farming on the phytoplankton and
periphyton of a scottish freshwater loch. Hydrobiologia, 190, 193-214, 1990.
[30] Pitta, P., Karakassis, I., Tsapakis, M., Zivanovic, S., Natural vs. mariculture induce
variability in nutrients and plankton in the eastern Mediterranean. Hydrobiologia, 391, 181-194,
1999.
[31] Rast, W., Holland, M., Eutrophication of lakes and reservoirs: a framework for
[32] Weglenska, T., Bownik-Dylinska, L., Ejsmont Karabin, J., Spodniewska, I., Plankton
structure and dynamics, phosphorus and nitrogen regeneration by zooplankton in Lake Glebokie polluted by aquaculture. Ekologia Polska, 35(1), 173-208, 1987.
[33] Beveridge, M., Cage and pen fish farming carrying capacity models and
environmental impact. FAO Fisheries Technical Paper, 255, 131, 1984.
[34] Cornel, G.E., Whoriskey, F.G., The effects of rainbow trout (Oncorhynchus mykiss)
cage culture on the water quality, zooplankton, benthos and sediments of Lac du Passage, Quebec. Aquaculture, 109, 101-117, 1993.
[35] Demir, N., Kırkağac, M.U., Pulatsu, S., Bekcan, S., Influence of trout cage culture on
water quality, plankton and benthos in an anatolian dam lake. The Israeli Journal of Aquaculture
-Bamidgeh, 53 (3-4), 115-127, 2001.
[36] Atay, D., Demir N., The Effects of Chicken Manure on the Phytoplankton Primary
Production in Carp Ponds. Acta Hydrobiologica, 40(4), 215-225, 1998.
[37] Kırkağaç, M., Köksal, G., Sazan havuzlarında Piliç Gübresinin Zooplankton
Verimliliğine Etkisi, X. Ulusal Su Ürünleri Sempozyumu, Cilt II, 548-562, Adana, 1999.
[38] Matsumura-Tundisi, T., Tundisi, J.G., Calanoida (Copepoda) species composition
changes in the reservoirs of São Paulo State (Brazil in the last twenty years. Hydrobiologia 504,
215-222, 2003.
[39] Matsumura-Tundisi, T., Tundisi, J.G., Plankton richness in a eutrophic reservoir
(Barra Bonita Reservoir, SP, Brazil). Hydrobiologia, 542, 367-378, 2005.
[40] Santos, R.M., Rocha, G.S., Rocha, O., Santos Wisniewski, M.J., Influence of net cage
fish cultures on the diversity of the zooplankton community in the Furnas Hydroelectric Reservoir,
Areado, MG, Brazil. Aquaculture Research, 40, 753-776, 2009.
[41] Hutchinson, G.E., A treatise on limnology. Vol. 2: Introduction to lake biology and the limnoplankton. New York: Wiley 1115, 1967.
[42] Ruttner-Kolisko, A., Plankton rotifers, biology and taxonomy. Biological Station Lunz of the Austrian Academy of Science, Stutgart, 146, 1974.
[43] Braioni, M.G., Gelmini, D., Guide per il reconoscimento delle specie animali delle
acque interne Italiane: Rotiferi monogononti. Italy: Consiglio Nazionalie delle Ricerche, 181,
1983.
[44] Ryding, S.O., Rast, W., The control of eutrophication of lakes and reservoirs. Man and The Biosphere Series Volume I. The Parthenon Publishing Group, Lancaster, 1989.
[45] Ramdani, M., Flower, R.J., Elkhiati, N., Zooplankton (Cladocera, Ostracoda),
chironomidae and benthic fauna remains in sediment cores from nine North African wetland lakes: The CASSARINA Project. Aquatic Ecology, 35 (3-4), 389-403, 2001.
[46] Eldredge, L.G., Evenhuis, N.L., Hawaii's biodiversity: a detailed assessment of the numbers of species in the Hawaiian Islands. Bishop Museum Occasional Papers, 76, 1-28, 2003. [47] Güher, H., A fanustic study on the freshwater Cladocera (Crustacea) species in
Turkish Thrace (Edirne, Tekirdağ, Kırklareli). Turkish Journal of Zoology, 24, 237-244, 2000.
[48] Alper, A., Çelebi, E., Çam, H., Karaytuğ, S., Cladocera and Copepoda (Crustacea)
fauna of İkizcetepeler Dam Lake (Balıkesir, Turkey). Turkish Journal of Fisheries and aquatic
sciences, 7(1), 71-73. 2007.
[49] Dirican, S., Musul, H., Çamlıgöze Baraj Gölü (Sivas-Türkiye) zooplanktonu faunası
[50] Saler, S., İpek, N., Cladocer and Copepoda (Crustacea) fauna of Seli Stream (Elazığ
Turkey). Journal of FisheriesSciences.com, 3(4), 318-322, 2009.
[51] Yıldız, Ş., Özgökçe, M.S., Karaca, F., Polat, E., Zooplankton composition of Van Lake
Coastline in Turkey. African Journal of Biotechnology, 9 (48), 8248-8252, 2010.
[52] Günsel, S., Emir Akbulut, N., The investigation of the zooplanktonic organisms of
Delice River and its arms in Kızılırmak River Basin (Turkey). Hacettepe Journal of Biology and
Chemistry, Special Issue, 309-316, 2012.
[53] Apaydın Yağcı, M., Seasonal zooplankton community variation in Karataş Lake. Iranian Journal of Fisheries Sciences. 12(2), 265-276, 2013.
[54] Güher, H., A checklist for zooplankton (Rotifera, Copepoda, Cladocera) of European
Turkey inland waters. Ege Journal of Fisheries and Aquatic Sciences, 31(4), 221-225, 2014.
[55] Saler, S., İpek Alış, N., Zooplankton of Hancağız Dam Lake (Gaziantep-Turkey). Journal of Survey in Fisheries Sciences. 1(1), 45-54, 2014.
[56] Apaydın Yağcı, M., Yilmaz, S., Yazıcıoğlu, O., Polat, N., The zooplankton
composition of Lake Ladik (Samsun, Turkey). Turkish Journal of Zoology 39(4), 652-659, 2015.
[57] Güher, H., Çolak, Ş., Süloğlu Baraj Gölü’nün (Edirne) zooplankton (Rotifera,
Cladocera, Copepoda) faunası ve mevsimsel değişimi. Trakya University Journal of Natural
Sciences, 16(1), 17-24, 2015.
[58] Ustaoğlu, M.R., An updated zooplankton biodiversity of Turkish inland waters. LimnoFish, 1(3), 151-159, 2015.
[59] Gürel, Ö., Saler, S., Zooplankton of Orduzu Lake (Malatya). Fırat University Turkish Journal of Science & Technology, 27(1), 21-28, 2015.
[60] Ustaoğlu, M.R., Balık, S., Özdemir Mis, D., The rotifer fauna of Lake Sazlıgöl (Menemen-İzmir). Turkish Journal of Zoology, 28, 267-272, 2004.
[61] Einsle, U., Ökologische Studien an einer pelagisch lebenden Population von
Diacyclops bicuspidatus (Crust. Cop.). Gewäss Abwäss 39-40, 102-117, 1965 (in German).
[62] Monchenko, V.I., Cyclopidae. Fauna of Ukraine 27(3). Kyiv, Ukraine: Naukova Dumka Publisher. 1974.
[63] Dussart, B.N., Defaye, D., Repertoire mondial des Copepodes Cyclopoides. Paris, France, CNRC, 1985 (in French).