Removal of Chromium from Wastewater by Reverse Osmosis
1Aysel Çimen
Karamanoğlu Mehmetbey University, Faculty of Science, Department of Chemistry, 70200 Karaman, Turkey e-mail: [email protected]; [email protected]
Received June 10, 2014
Abstract–Removal of chromium from wastewaters has been studied and the optimal process conditions were determined. The reverse osmosis (RO) technique, the sea water high rejection (SWHR) and high rejection brackish water (AG, SE, and SG) membranes were used. The chromium rejection depended on membrane type, pH of the feed water and operating pressure. The removal of chromium was most effective when the feed water pH 3. The rejection efficiency of the membranes increased in the order AG > SWHR > SG > SE. RO method can be efficiently used (with >91% rejection) for the removal of chromium from wastewater of chro-mium coating processes.
Keywords: chromium removal, heavy metals, membrane, reverse osmosis. DOI: 10.1134/S0036024415070055
INTRODUCTION
Water pollution with heavy metals is an important economic and environmental issue in all over the world [1]. Chromium (Cr) is a common contaminant in surface and ground water due to industrialization and is commonly used in preservation of wood, textile dyeing, leather tanning, electroplating and metal fin-ishing [2]. The chromium element exists mainly in the form of Cr(III) and Cr(VI) valence states and also as Cr(0), Cr(II), and Cr(V), where common Cr(VI)
anions, chromate (Cr ) and dichromate (Cr2 ),
are strong oxidants. Chromate is also well known car-cinogen, a suspected mutagen and teratogen. On the other hand, Cr(III) toxicity is negligible because it often forms insoluble hydroxides at circum-neutral pH (5.5 and 7.5) [3]. Chromium containing wastewa-ter must be treated to lower Cr(VI) quantity to reach allowable limits before interfere with environment. However, the Cr(VI) removal rate depends signifi-cantly on pH of the solution due to its effect on solu-bility and precipitation [4].
Appropriate methods utilized to remove the Cr(VI) from industrial wastewaters include reduction fol-lowed by chemical precipitation [5], activated carbon adsorption [6], electrochemical precipitation [7], ion exchange [8], solvent extraction [9] and reverse osmo-sis (RO) [10].
In recent years, membrane manufactures have developed RO membranes with chromium rejection rate of 91–96% [11, 12]. However, most of the plants have to implement the additional treatment steps such
as pH adjustment of feed water, post-treatment of RO permeate using ion exchange, or several pass stage of permeate in order to improve chromium rejection. In this study, we aimed to determine the best conditions (pH, concentration, operating pressure and tempera-ture) of this process. In addition, several process con-figurations have been proposed to minimize the chro-mium concentration in the permeate [13].
The RO membranes have many advantages when they are compared with traditional cellulose acetate (CA) membranes. The most important advantages of RO are better rejection of dissolved solids and organ-ics, increased productivity at lower operating pres-sures, great structural stability, and the two or three times higher output per unit area. In addition, these membranes combine higher f lux efficiency with a larger area packaged in the same volume. In addition, they are formatted as conventional 8 inch elements to allow for a substantial reduction of investment costs as well as lower operating costs due to the reduced pres-sure and fouling tendency. The part of the operating costs related to energy consumption has been roughly reduced to 30 to 50% compared with conventional CA membranes [14]. The low-cost RO membrane units, the medium and low pressure, could be used econom-ically for separation and recovery of chromium from wastewater.
The removal of chromium with RO is affected by several factors, i.e., pH, pressure, feed water f low rate, initial concentration, etc. [15]. Many methods have been tried to remove chromium from waste water [2, 5, 8, 13, 15]. These methods were also used to remove boron [16], arsenate and arsenite [17]. Chromium
1The article is published in the original. 2 4 O − O27 −
PHYSICAL CHEMISTRY
OF SOLUTIONS
removal rate using RO technique and AG membrane is 91% [18].
The present study was designed to investigate and compare the chromium removal efficiencies of four different RO membranes using model solutions con-taining chromium as single solute.
The effect of pH, contaminant concentration and operating pressure on the chromium rejection rate was also investigated. The experimental parameters and membranes giving the best chromium removal are determined.
EXPERIMENTAL
Reverse osmosis pilot plant. The reverse osmosis
pilot plant (Prozesstechnick GmbH) used in this study consists of a diaphragm pump controlled with a fre-quency converter (f low range: 1.8–12 L/min, pressure range: max 40 bar), feed tank with heating/cooling jacket (5 L capacity), membrane housing for both spi-ral wound and f lat-sheet membranes, equipped with different emptying and pressure valves (Fig. 1).
Membranes. The membranes (AG, SWHR, SE,
SG) having 44 cm2 exposed area with a f lat-sheet
con-figuration were used. The most relevant characteristics of these membranes are summarized in Table 1. Experimental data obtained for these membranes are shown in Tables 2–5.
Instruments. The concentration of chromium and
cations in the water samples were determined using ContrAA 300 atomic absorption spectrometer (Con-trAA 300, Analytik Jena) at 357 nm wavelength. Linear-ity concentration range was 10–1000 mg/L. In addi-tion, coefficient of regression (R2) and limit of detection
(LOD) for chromium were 0.999 and 2.935 mg/L, respectively. pH of the samples were determined with an Orion ion meter equipped with combined pH elec-trode.
Reverse osmosis experiments. The potassium
dichro-mate solutions were prepared in distilled water with by diluting the prepared stock solution (1000 mg/L) to
desired concentrations. K2Cr2O7, NaOH, and HCl
were obtained from Merck Co. (Darmstad, Ger-many). All chemicals were of analytical grade. In spe-cific experiments, composition of the feed water and operating pressure were chosen as below:
(i) Feed solutions are a chromium solution with dif-ferent concentration (50, 100, 500, and 1000 mg/L).
(ii) Feed solutions (50, 100, 500, and 1000 mg/L) were treated with AG, SWHR, SE, and SG mem-branes at the different operating pressure ranging from 15 to 35 bars.
(iii) Feed solutions (50, 100, 500, and 1000 mg/L) were treated with AG, SWHR, SE, and SG mem-branes at pH 1-6 under operation pressure of 20 bar.
(iv) Samples were taken from feed solution and permeate solution after 20, 80, 140, and 200 min.
Table 1. Characteristics of the flat-sheet membranes
Characteristic Membrane
SWHR SG AG SE
Max. temperature (°C) 45 50 50 50 Max. pressure (psig) 1200 600 600 800 Salt rejection (%) 99.6 98.5 99 98 Chlorine tolerance (ppm) <0.1 500 1000 500 Table 2. Rejection values (%) corresponding to the Cr(VI) concentration (mg/L) in the feed (feed water pH 3, operat-ing pressure 20 bar, 20 ± 1°C)
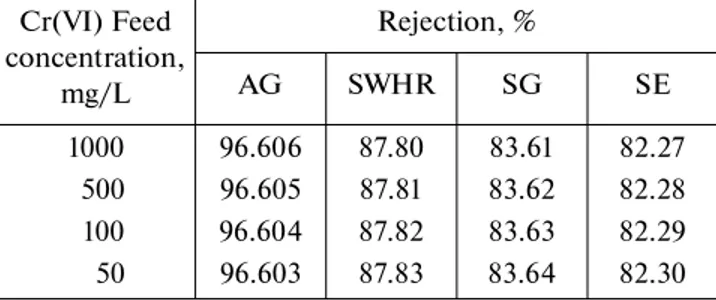
Cr(VI) Feed concentration, mg/L Rejection, % AG SWHR SG SE 1000 96.606 87.80 83.61 82.27 500 96.605 87.81 83.62 82.28 100 96.604 87.82 83.63 82.29 50 96.603 87.83 83.64 82.30 Table 3. Rejection values (%) vs. pH (100 mg/L Cr(VI), operating pressure 20 bar, 20 ± 1°C)
pH Rejection, % AG SWHR SE SG 1 83.611 69.606 72.752 70.286 2 92.359 85.171 89.905 85.402 3 96.525 95.388 93.259 90.609 4 96.083 89.623 82.504 87.192 5 93.885 88.578 88.965 90.102 6 95.134 90.146 87.992 81.394 Table 4. Rejection values (%) vs. operating pressure (bar) (100 mg/L Cr(VI), feed water pH 3, 20 ± 1°C)
Operation pressure, bar Rejection, % AG SG SE SWHR 15 85.701 78.023 72.752 65.596 20 86.611 79.286 80.160 69.605 25 87.906 80.797 83.977 74.838 30 89.845 84.199 87.936 80.545 35 90.968 86.194 88.000 86.004 Table 5. Rejection values (%) vs. operation time (min) (100 mg/L Cr(VI), feed water pH 3, operating pressure 20 bar, 20 ± 1°C) Operation time, min Rejection, % AG SWHR SE SG 20 91.678 86.401 81.274 74.724 80 94.603 86.701 82.125 78.181 140 96.662 87.152 83.604 80.491 200 97.851 87.854 84.256 82.749
At the beginning of each experiment, pH of the feed water (1 L load) was adjusted to the desired pH level by addition of 0.1 M NaOH or 0.1 M HCl, and it was placed in the feed water tank. The system was operated in the permeate recycle mode. In order to prevent a change in the chromium concentration in the feed tank, permeate and concentrate (retentate) phases were recycled in to the feed tank. A new mem-brane was used for each experiment after conditioning for at least 3 h under the experimental conditions. After that, the measuring sequence was started. Every hour, the permeate was sampled and the chromium concen-tration was determined. The experiments were
per-formed at 20 ± 1°C. The chromium rejection was
cal-culated according to the following equation [16, 17];
where Cpermeate and Cfeed are the chromium concentra-tions in the permeate and feed water, respectively.
Wastewater obtained from chromium-coating process.
Experiments were performed under following condi-tions (20 ± 1°C temperature, 15, 20, 25, 30, 35 bar pres-sure, 1–6 pH and 50, 100, 500, and 1000 mg/L chro-mium concentration) for each membrane (AG, SWHR, SE, and SG). It was found that the best con-dition for removal of chromium was pH 3, 100 mg/L concentration, 20 bar pressure, 20 ± 1°C temperature. The application of RO on waste water was obtained from chromium-coating plant from Konya, in Turkey.
RESULTS AND DISCUSSION
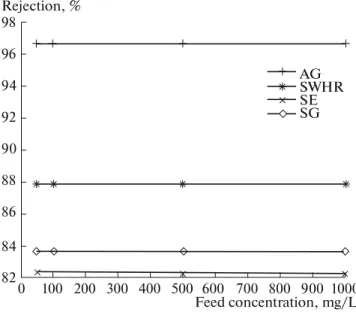
Effect of chromium concentration. The rejection of
Cr(VI) as a function of its concentration in the feed water is shown in Fig. 2. The concentration of feed water has no significant effect on the rejection. The
permeate feed Rejection(%) 1 C 100, C ⎡ ⎛ ⎞⎤ = ⎢ −⎜ ⎟⎥× ⎣ ⎝ ⎠⎦
contaminant concentration in the permeate water increases with increasing its concentration in the feed water. Figure 2 also shows that chromium rejection is mainly affected by membrane type.
Permeate f lux for membranes increases in the order AG > SWHR > SG > SE. These results showed the clear impact of membrane type and pH on chro-mium rejection. The rate of chrochro-mium rejection (%) for membranes was found in the order AG > SWHR > SG > SE. The mean rejection rates for AG, SWHR, SG, SE were found to be 96.60, 87.83, 83.61, and 82.27%, respectively, in line with findings in [19]. These results show clearly that chromium rejection evidently depends on membrane type, but not on the feed concentration. According to these results on rejection rate and f lux values, the AG membrane should be preferred for removal of chromium.
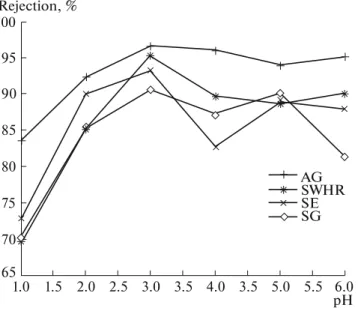
Effect of pH. The dependence of chromium
rejec-tion on pH of the feed water is presented in Fig. 3 for AG, SWHR, SE, and SG membranes. The highest chromium rejection was obtained at pH 3 for all mem-branes. The chromium rejection for the membranes was found in the order of AG > SWHR > SE > SG. The mean rejection values for these membranes were 92.93, 86.4, 85.89, 84.16, respectively. These results show that chromium rejection evidently depends on membrane type and pH of the feed water.
Effect of operating pressure. Figure 4 shows the
effect of the operating pressure on chromium rejec-tion. Chromium rejection rates for AG, SWHR, SE, and SG membranes increased with increasing operat-ing pressure, in line with findoperat-ings in [20]. Due to the pressure increase, we observed an increase in the f lux value. This situation results in higher adsorption of
Fig. 1. Flow diagram of the reverse osmosis pilot plant. Ml,
Membrane housing; Bl, feed tank with heating/cooling jacket; VI and V2, emptying valve; V3, pressure regulation valve; V4, spring loaded valve; PI01, pressure gauge; DPI, differential pressure indicator; LI01, level indicator on the feed tank; TI01, temperature indicator.
V4 V3 V1 V6 V2 M2 M1 B1 L1 01 T1 01 P1 P1 01 P1 02 DPI Cooling Heating Permeate Permeate V5
Fig. 2. Dependence of chromium rejection on the
chro-mium concentration in the feed water, (feed water pH 3, operating pressure 20 bar, 20 ± 1°C).
98 Rejection, % AG SWHR SE SG 96 94 92 90 88 86 84 82 1000 Feed concentration, mg/L 900 800 700 600 500 400 300 200 100 0
chromium in the membrane and decrease in chro-mium concentration in permeate [21]. It might be due to decreased pore size of the membrane surface as a result of salt accumulation over time [22]. Higher chromium rejection was observed when operating pressure was increased. Chromium rejection for mem-branes was found in the order of AG > SE > SG > SWHR. The mean rejections for AG, SE, SG, and SWHR membranes were 88.21, 82.51, 81.70, and 75.32, respectively. Permeate f lux for membranes was found to increase in the order AG > SE > SG > SWHR. According to obtained rejection and f lux val-ues, it has been seen that AG membrane could be pre-ferred to the other membrane in removal of chro-mium.
In addition, operating pressure also increased per-meate f lux and was found in the order AG > SE > SG > SWHR (Fig. 5). Higher operating pressure resulted in higher volume of permeate water in line with findings of [19]. Permeate f lux is important
because higher f lux gives the short operation time, which reduces the cost of RO system.
Wastewater from chromium-coating production. RO
technique was applied for purification of the wastewa-ter of chromium-coating process. The highest rejec-tion and permeate f lux were obtained using AG mem-brane. Wastewater was taken from Konya (Turkey) and have chromium concentration of 100 mg/L. Prior to RO application, pH of the wastewater sample was adjusted to 3 at which the highest chromium rejection was obtained. Figure 6 shows the time dependence of chromium rejection for this sample. The passage of ions through the membrane increases with time. Thereafter, the system reaches the dynamic equilib-rium. The mean chromium rejections for AG, SWHR, SE, and SG were found to be 95, 87, 83, and 79%, respectively. Permeate f lux for chromium-coating wastewater sample is shown in Fig. 7. It increases during initial 3 h, which may indicate that dynamic membrane conditions were not achieved during this time. Thereafter, the f lux of the permeate reached steady state value. Permeate f luxes for waste water sample were found to be 4.6–13.9 L m–2 h–1.
The chemical composition of the wastewater obtained from chromium-coating process was
deter-mined from analyses repeated three times (n = 3) and
is given in Table 6.
The chromium concentration versus the separation process time is shown in Fig. 8. Thus these membranes were tested with 100 mg/L to establish the optimum concentration. A good separation of Cr(VI) was
observed at 100 mg L–1 with AG membrane (AG >
SWHR > SG = SE).
Table 6. Composition of the wastewater from the chro-mium-coating process Metal Concentration, mg/L (n = 3) Cd 0.1946 Cr 7542 Cu 76 Fe 828.6 Ni 1.55 Pb 48.6 Zn 5.813
Fig. 3. Dependence of chromium rejection on pH of feed
water (100 mg/L Cr(VI), feed water pH 3, operating pres-sure 20 bar, 20 ± 1°C). Rejection, % AG SWHR SE SG 70 75 80 85 90 95 100 65 6.0 pH 5.5 5.0 3.5 4.0 3.5 3.0 2.5 2.0 1.5 1.0
Fig. 4. Dependence of chromium rejection on the
operat-ing pressure (100 mg/L Cr(VI), feed water pH 3, 20°C). Rejection, % AG SWHR SE SG 70 75 80 85 90 95 65 35 Operating pressure, bar
High chromium rejection (close to 91%) was obtained at pH 3, 100 mg/L concentration, 20 bar
pressure, 20 ± 1°C temperature by single stage RO
with AG membrane in this study.
CONCLUSIONS
In this study, removal of chromium from wastewa-ter using reverse osmosis with AG, SWHR, SG, and
SE membranes was investigated. The effects of pH and concentration of the feed water and operating pressure on the chromium rejection were also explored. Rejec-tion rates for AG, SWHR, SE, and SG membranes were determined from experimental data and com-pared with each other.
Good results were obtained at low Cr(VI)
concen-trations of 50–100 mg L–1. Removal of chromium by
RO depends greatly on the pH of the feed water. For all
Fig. 5. Dependence of permeate flux on the operating
pressure. (100 mg/L Cr(VI), feed water pH 3, 20 ± 1°C). Permeate flux, L/(m h) AG SWHR SE SG 5.0 4.5 4.0 3.5 3.0 2.5 2.0 1.5 1.0 0.5 35 Operating pressure, bar
15 20 25 30
Fig. 6. Dependence of chromium rejection on the
operat-ing time (100 mg/L Cr(VI), feed water pH 3, operatoperat-ing pressure 20 bar). Rejection, % AG SWHR SE SG 70 75 80 85 90 95 100 200 Operating time, min
180 160 140 120 100 80 60 40 20
Fig. 7. Dependence of permeate fluxes on the operating
time for wastewater sample from chromium-coating pro-cess with AG membrane (100 mg/L Cr(VI), feed water pH 3, operating pressure 20 bar, 20 ± 1°C).
Permeate flux, L/(m h) AG 9.0 8.5 8.0 7.5 7.0 6.5 6.0 5.5 5.0 4.5 20 40 60 80 100 120 140 160 180 200
Operating time, min
Fig. 8. Time dependence of the residual Cr(VI)
concentra-tion according to AAS data (100 mg/L Cr(IV), feed water pH 3, operating pressure 20 bar, 20 ± 1°C).
AG SWHR SE SG
Operating time, min Feed concentration, mg/L 22 20 18 16 14 12 10 8 0 20 40 60 80 100 120 140 160 180 200
studied membranes it was found that chromium can be effectively removed at pH 3. Removal of chromium is increased with increasing the operating pressure. The rejection of chromium does not depend on the feed water concentration. Removal efficiency also depends on membrane type. The highest rejection (91%) and permeate f lux were obtained with using the AG membrane.
It was found that the best conditions for removal of chromium from wastewater using AG membrane were pH 3, 100 mg/L concentration, 20 bar pressure, 20 ± 1°C temperature. Because of low-cost of RO membrane units, the medium and low pressure RO technique can be used economically for separation and recovery of chromium from wastewater.
ACKNOWLEDGMENTS
The authors thank the Scientific Research Project Commission of Karamanoğlu Mehmetbey University for financial support (BAP-grant no. 101-M-10).
REFERENCES
1. S. J. Kohler, P. Cubillas, J. D. Rodríguez-Blanco, C. Bauer, and M. Prieto, Environ. Sci. Technol. 41, 112 (2007)
2. G. Donmez and Z. Aksu, Process Biochem. 38, 751 (2002).
3. D. E. Cummings, S. Fendorf, N. Singh, B. M. Peyton, and T. S. Magnuson, Environ. Sci. Technol. 41, 146 (2007).
4. M. J. Alowitz and M. M. Scherer, Environ. Sci. Tech-nol. 363, 299 (2002).
5. A. Ozer, H. S. Altundogan, M. Erdem, and F. Tumen, Environ. Pollut. 97, 107 (1997).
6. Lofti Monser and Nafaa Adhoum, Separ. Purif. Tech-nol. 26, 137 (2002)
7. C. Namasivayam and R. T. Yamuna, Chemosphere 30, 561 (1995).
8. S. Rengaraj, C. K. Joo, Y. Kim, and J. Yi, J. Hazard. Mater. 102, 257 (2003).
9. R. Mauri, R. Shinnar, M. D. Amore, P. Giordano, and A. Volpe, AIChE J. 47, 509 (2001).
10. A. P. Padilla and E. L. Tavani, Desalination 129, 219 (1999).
11. M. Taniguchi, Y. Fusaoka, T. Nishikawa, and M. Kuri-hara, Desalination 167, 419 (2004).
12. P. P. Glueckstern and M. Priel, Desalination 156, 219 (2003).
13. A. I. Hafez, M. S. El-Manharawy, and M. A. Khedr, Desalination 144, 237 (2002).
14. J. A. Redondo, Desalination 108, 59 (1996).
15. X. S. Wang, Z. Z. Li, and S. R. Tao, J. Environ. Manag. 90, 721 (2009).
16. Y. Cengeloglu, A. Tor, G. Arslan, M. Ersoz, and S. Gezgin, J. Hazard. Mater. 142, 412 (2007).
17. I. Akin, G. Arslan, A. Tor, Y. Cengeloglu, and M. Ersoz, Desalination 281, 88 (2011).
18. Y. Kisoa, K. Muroshigea, T. Oguchia, M. Hiroseb, T. Oharab, and T. Shintanic, J. Membr. Sci. 369, 290 (2011).
19. P. Dydo, M. Turek, J. Ciba, J. Trojanowska, and J. Kluczka, Desalination 18, 131 (2005).
20. H. Koseoglu, N. Kabay, M. Yuksel, and M. Kitis, Desalination 223, 126 (2008).
21. I. Sutzkover, D. Hasson, and R. Semiat, Desalination 131, 117 (2000).
22. D. Prats, M. F. Chillon Arias, and R. M. Pastor, Desalination 128, 269 (2000).