LANDSLIDE SUSCEPTIBILITY MAPPING OF CANIK (SAMSUN) DISTRICT USING BAYESIAN PROBABILITY AND FREQUENCY RATIO MODELS
1Halil AKINCI, 2Sedat DOĞAN, 3Cem KILIÇOĞLU
1Artvin Çoruh University, Department of Geomatics Engineering, Seyitler, Artvin, TURKEY 2Ondokuz Mayıs University, Department of Geomatics Engineering, Kurupelit, Samsun, TURKEY
3Ondokuz Mayıs University, Kavak Vocational School, Kavak, Samsun, TURKEY 1[email protected], 2[email protected], 3[email protected] (Geliş/Received: 14.11.2016; Kabul/Accepted in Revised Form: 10.02.2017)
ABSTRACT: Landslides cause serious damage to infrastructure and property in many cities of Turkey, as well as the loss of life. Samsun is one of the cities where landslides are most frequently seen in Turkey. Most of the landslides occurred throughout the province, especially within the Atakum, Canik and İlkadım districts, have been described as natural disaster. In this study, the aim was to produce landslide susceptibility maps for one of these highly sensitive districts, Canik. For this purpose, the parameters of slope, aspect, altitude, topographic wetness index, profile and plan curvature, lithology, distance to drainage network and roads have been used in the landslide susceptibility analysis. Bayesian Probability (BP) and frequency ratio (FR) models have been used in the study. The areas in the produced susceptibility maps have been classified into five groups as “very low, low, moderate, high and very high susceptible”. The verification and control results revealed that the landslide susceptibility map generated using the BP model is more accurate than the FR model. At the same time, the very high and high susceptible areas in the landslide susceptibility map produced by BP model were compatible with the control landslides with a rate of 83.5%. These results indicated that the landslide susceptibility map generated using the BP model can be used for land use planning and landslide risk reduction studies.
Key Words: GIS, Landslide susceptibility, Bayesian probability model, Frequency ratio model, Canik, Samsun.
Bayes Olasılık ve Frekans Oranı Modelleri Kullanılarak Canik (Samsun) İlçesinin Heyelan Duyarlılığının Haritalanması
ÖZ: Heyelanlar, Türkiye'nin birçok şehrinde altyapı ve mülkiyete ciddi zarar vermenin yanı sıra can kaybına da neden olmaktadır. Samsun, Türkiye'de heyelanların en sık görüldüğü şehirlerden birisidir. İl genelinde doğal afet olarak nitelendirilen çok sayıda heyelan meydana gelmiştir. Bu çalışmada, Samsun ili Canik ilçesinin heyelan duyarlılık haritaları üretilmiştir. Heyelan duyarlılık analizinde eğim, bakı, yükseklik, topoğrafik nemlilik indeksi, profil ve plan eğriliği, litoloji, drenaj ağlarına ve yola uzaklık parametreleri kullanılmıştır. Çalışmada, bayes olasılık (BO) ve frekans oranı (FO) modelleri kullanılmıştır. Üretilen duyarlılık haritaları, “çok düşük, düşük, orta, yüksek ve çok yüksek derecede duyarlı” alanlar olmak üzere 5 grup altında sınıflandırılmıştır. Doğrulama ve kontrol sonuçları, BO modeli kullanılarak üretilen heyelan duyarlılık harita sının FO modelinden daha doğru olduğunu ortaya koymuştur. Aynı zamanda, BO modeli kullanılarak üretilen heyelan duyarlılık haritasın daki çok yüksek ve yüksek derecede heyelana duyarlı alanların kontrol heyelanları ile %83,5 oranında uyumlu olduğu Note: This paper has been presented at the S elcuk International S cientific Conference on Applied S ciences (IS CAS 2016) held in
Antalya (Turkey), S eptember 27-30, 2016.
tespit edilmiştir. Bu sonuçlar, BO modeli kullanılarak üretilen heyelan duyarlılık haritasının, arazi kullanım planlaması ve heyelan risk azaltma çalışmalarında kullanılabileceğini göstermiştir.
Anahtar Kelimeler: CBS, heyelan duyarlılığı, Bayes olasılık modeli, Frekans oranı modeli, Canik, Samsun.
INTRODUCTION
Disasters are the events that cause social, cultural and economic devastation. Vos et al. (2010) defines disaster as “a situation or an event which overwhelms local capacity, necessitating a request at a national or international level for external assistance; an unforeseen and often sudden event that causes great damage, destruction, and human suffering”. In 2015, 376 natural disasters were reported at a global level, resulting in death of 22,765 people, affecting more than 110.3 million victims, and causing an economic loss of more than US$ 70.3 billion (Guha-Sapir et al., 2016).
In 1988, the Centre for Research on the Epidemiology of Disasters (CRED) launched the “Emergency Events Database (EM-DAT) that contains essential core data on the occurrence and impact of over 13,800 natural and 8,200 technological disasters across the globe, dating from 1900 to the present day” (Guha-Sapir et al., 2016). EM-DAT handles disasters in two categories such as technological and natural disasters. The category of natural disasters is divided into six subgroups including 17 disaster types. On the basis of this classification, natural disasters can be defined as the “results of biological, meteorological, hydrological, climatological, and geophysical based events, which are unpredictable and cannot be prevented”.
Landslide is one of the most common natural hazards in the world. Varnes (1958) defines the landslide as “the downward and outward movement of the slopes composed of natural rock, soils, artificial fills, or combinations of these materials”. As in other natural disasters, landslides cause injuries, deaths, economic losses, and loss of natural and cultural heritage. For example, in April 2017, because of the massive landslide, 11 houses were devastated and 24 people were killed in the Uzgen district of southern Kyrgyzstan.
Landslides are known as the most dangerous and widespread natural hazards in Turkey. When natural hazards between 1950–2000 were examined in Turkey, it is seen that they are most common natural hazard with a rate of 45% (Gokce et al., 2008). In Turkey, the devastating effect of the landslides has been lastly seen in the Borçka district of the Artvin Province on 11 November 2015. 11 people were injured and 2 people lost their lives in this landslide, which was caused by heavy rains. In Turkey, Samsun is one of the foremost provinces, wherein landslides occur at a higher frequency. In the damage distribution and microzonation study performed by Doyuran et al. (1985) in Samsun, the city center including Atakum, İlkadım and Canik districts was divided into three regions; (a) inconvenient areas for construction (existing buildings must be evacuated), (b) areas where new construction is objectionable (existing structures will be freezed), and (c) the areas where new construction will be allowed under certain circumstances. However, urbanization rate is higher in the mentioned districts where landslides occur more frequently. Considering the fact that the landslides are the most important natural hazards that cause property and life losses in Turkey, there is a need for producing landslide susceptibility maps especially for cities with high landslide potential such as Samsun to prevent the possible loss of life and property.
The economic, cultural and social losses caused by landslides can be reduced by effective planning and management. For this purpose, different kinds of maps are prepared with different information by making land and laboratory studies for geological and geotechnical purposes in the selection of settlement areas, infrastructure wor ks and other engineering works. One of the most important geological based maps prepared in this framework is landslide susceptibility maps (Yalçın, 2007). These maps provide information about susceptive areas for landslides in the future and the inclination of an area towards possible landslides (Dağdelenler, 2013 ; Chalkias et al., 2014; Petschko et al., 2014). In the studies evaluating the methods and parameters used to prepare the such maps (Gökçeoğlu and
Ercanoğlu, 2001; Dağ et al., 2011; Jebur et al., 2014; Kayastha 2015; Kavzoglu et al., 2015), it has been stated that the lithology, slope, land cover and aspect are frequently used parameters, although the researchers have been using different parameters in landslide susceptibility analysis due to regional characteristics. However, in parameter selection, it is also important whether or not the data related to any parameter can be obtained easily. Moreover, the literature shows that there is not yet consensus among researchers about the parameters and methods used in the production of landslide susceptibility maps, leading a large number of methods and parameters to be used (Chen et al., 2017; Sezer et al., 2017; Colkesen et al., 2016; Barrile et al., 2016; Hong et al., 2016) because each researcher take into consideration the parameters related to field that they work (Gökçeoğlu and Ercanoğlu, 2001; Dağ et al., 2011). Dağ et al. (2011) stated that in the preparation of landslide susceptibility maps, statistical methods are used in rate of 64%.
The main objective of this research was to produce landslide susceptibility maps for Canik, one of the districts of Samsun province, known as highly sensitive to landslide occurrence. In this study, the parameters of altitude, aspect, slope, topographic wetness index (TWI), profile curvature, plan curvature, lithology, and distance to drainage network and roads were used. Bayesian probability and frequency ratio models were chosen for this study since they are widely used in the literature, consist of understandable and simple statistical models, provide accurate results, and can easily be applied. MATERIAL AND METHOD
Study Area
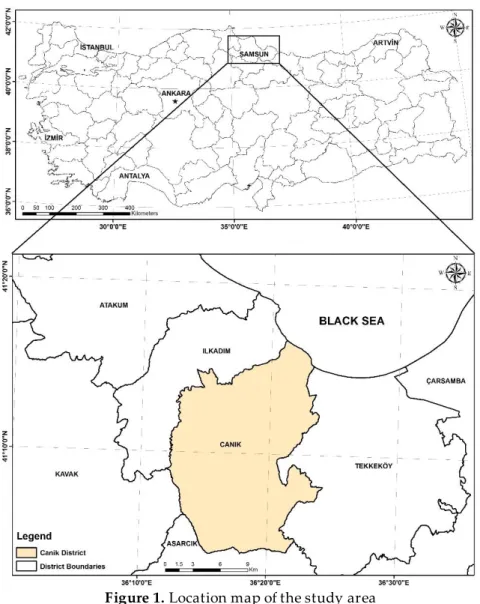
Canik district is located in Samsun Metropolitan Municipality boundaries. It neighbors Tekkeköy district on the east, İlkadım district and Mert River on the west, Black Sea on the north, Kavak and Asarcık district on the south (Figure 1).
Figure 1. Location map of the study area
According to the Address Based Population Registration System, population of Canik was 96.541 in 2015. The district is between 41o 4’ 4.59” – 41o 16’ 44.64” north latitude and 36o 12’ 2.89” – 36o 24’ 13.35” east longitude and has an area of 262 km2.
The slope ranges from 0o to 79.32o in the district. The average slope is about 18o. Approximately 19% of the study area, the slope is below 10o. The areas where the slope is between 10o and 20o cover 34% of the study area and the areas with the slope above 20o are about 47%. According to CORINE 2012 land cover data, 58% of the study area is composed of agricultural and 35% is forest area. In Samsun, the climate of the Black Sea is seen. This kind of climate is rainy every season, hot in summers and warm in winters. The long-term average annual rainfall in Samsun is 694mm. According to the average of 40 years between 1970 and 2010, the average annual temperature in Samsun is 14.4oC. The hottest months are July (23.3oC) and August (23.5oC), while the coldest months are January (7.0oC) and February (6.9oC) (Bahadır, 2013).
Lithology of the Study Area
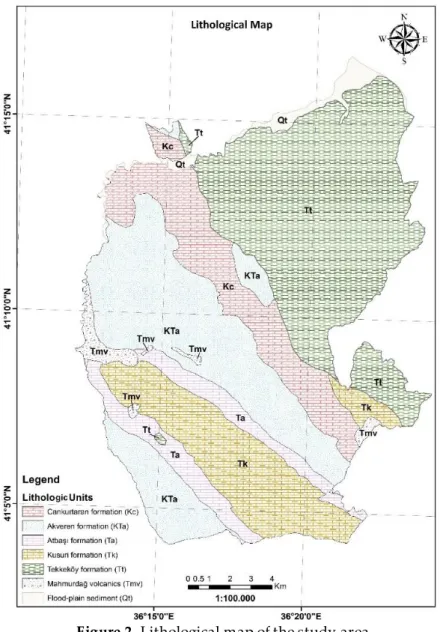
As shown in Figure 2, seven different formations are seen from older to younger in the Canik district (Öztekeşin, 2008; Keskin, 2011; Temizel et al., 2014).
Figure 2. Lithological map of the study area
Cankurtaran formation (Kc): Cankurtaran formation consists of tuff-tuffite, sandy limestone, and marl intercalated with sandstone and shale alternations (Temizel et al., 2014).
Akveren formation (Kta): Akveren formation consists of sandstone, sandy limestone, limestone, and marl with siltstone and shale intercalations (Temizel et al., 2014).
Atbaşı formation (Ta): Atbaşı formation consists of limestone, sandy limestone, sandstone, and marl intercalations (Temizel et al., 2014).
Kusuri formation (Tk): Kusuri formation consist of marl, sandstone, siltstone, limestone and calcareous sandstone alternations (Keskin, 2011).
Tekkeköy formation (Tt): Tekkeköy formation consist of sandstone, marl and tuffite alternations, basalt and anglomera (Keskin, 2011).
Mahmurdağ volcanics (Tmv): Mahmurdağ volcanics consist of basaltic lava, dike and sills (Keskin, 2011).
Current flood-plain deposits (Qt): These deposits consist of silt, clay and very fine sand and their thickness range from 10 to 15 m (Keskin, 2011).
Data Handling and Data Preparation
In this study, the parameters, such as altitude, aspect, slope, profile and plan curvatures, TWI, lithology, proximity to the drainage networks and roads were used. Descriptive statistical data of the environmental parameters used in the study was presented in Table 1. The basic data required to produce the landslide susceptibility maps of the study area were obtained from 1/25.000 scale Standard Topographic Maps. At first, the digital elevation model (DEM) of the study area was created by using contour lines in the topographic maps in ArcGIS 10.2. The DEM was converted into 10×10 m cell size raster format and then altitude, aspect, slope, TWI, profile and plan curvature maps of the study area were produced. 1/25.000 scale digital geology and landslide inventory maps of the study area were procured from the MREI (General Directorate of Mineral Research and Exploration Institute). These maps were also converted into 10×10 m cell size raster format. In order to produce the landslide susceptibility map, the produced parameters maps were compared one by one with the landslide inventory map, and thus the relations of each layer to landslides were found.
Table 1. Descriptive statistical data of the environmental parameters used in the study
Parameter Min. Max. Mean Std. Deviation Data Type Scale
Elevation (m) 0 1000 535.01 212.26 GRID 10x10 m
Slope (o) 0 79.32 18.30 9.58 GRID 10x10 m
Plan curvature -16.55 13.63 -0.06 0.82 GRID 10x10 m
Profile curvature -49.34 58.23 -0.20 1.08 GRID 10x10 m
TWI 2.51 28.24 7.04 2.13 GRID 10x10 m
Proximity to road 0 1933.42 298.41 264.38 GRID 10x10 m
Proximity to drainage 0 819.39 151.77 105.01 GRID 10x10 m
The first step in assessing landslide susceptibility is to learn about the past landslides occurred within the research area. This is based on the assumption that future landslides can occur under similar conditions, wherein the past landslides occurred (Lee and Talip, 2005; Kumtepe et al., 2009; Erener and Düzgün, 2010; Kavzoglu et al., 2015). Therefore, one of the most important datasets required for studying landslide susceptibility is “landslide inventory maps”, as these maps show the existing landslide areas on land (Çevik and Topal, 2003; Yalçın 2007). In this study, 1/25000 scale digital landslide inventory maps produced by MREI were used. There are 20 landslides (6 active and 14 inactive) with a total area of 232.52 ha on the landslide inventory map. In the 1/25.000 scale landslide inventory maps produced by the MREI, classification of landslides was based on Varnes (1978) classification (Çan et al., 2013). However, in the digital landslide inventory map provided from MREI within the scope of the study, landslides were classified as active and inactive according to their activities only. 46.8% of the landslides were in the Cankurtaran formation and 29.11% were in the Akveren formation. Approximately 77% of the landslide areas were analyzed and 23% were used as validation data sets.
Lithology is one of the most important parameters affecting the formation of landslides (Kumtepe et al., 2009) and is an important parameter considered in the susceptibility studies, owing to the fact that different lithological units have different levels of sensitivity to active geomorphological processes including landslides. Geomorphological processes are partly based on the lithology and the dissociation properties of the basic materials constituting to the lithology (Dai et al., 2001, Çevik and Topal, 2003). Lithological units in the study area were obtained from the 1/25 .000 scale geological maps produced by MREI (Figure 2).
Slope angle is considered as the most important parameter of the landslide susceptibility analysis (Lee and Min, 2001; Dai et al., 2001). In several studies, this parameter was given the first priority for producing landslide susceptibility maps (Yalçın, 2008; Yılmaz, 2009; Erener and Düzgün, 2010). Previous studies and field observations have indicated that susceptibility to landslide increa ses with the rising slope (Yalçın, 2007). Therefore, the DEM of the study area was produced by using the contour lines in
ArcGIS 10.2 GIS software. Generated DEM was converted into 10 m × 10 m cell size ESRI GRID format and the slope of the study area map was determined. The produced slope map was reclassified with 50 increments and the distribution of the landslides corresponding to each slope group was identified by comparing it to the landslide inventory maps (Table 2). The maximum slope in the study area was found to be 790 and the most of the landslides according to the slope map were in 15–200 slope group with 21.97% occurrence.
Like slope, aspect is also used as an important parameter in the generation of landslide susceptibility maps (Çevik and Topal, 2003; Ercanoğlu et al., 2004). An increase in the frequency of landslides in certain aspects can generally be associated with both the morphology of the study area and the meteorological conditions such as general rainfall direction or solar radiation intake. The soil infiltration capacity depends on many factors such as soil type, slope, permeability, porosity, soil moisture, organic matter contents, vegetation cover, and the season of precipitation. The slopes receiving more rainfall will reach saturation more quickly than the other slopes. Accordingly, this leads to the development of pore water pressure in such slopes (Gökçeoğlu and Ercanoğlu, 2001). In order to reveal the relationship between the aspect and landslides, aspect map of the study area was produced with DEM. The aspect map was divided into nine classes and the percentage presence of landslides in each group was calculated (Tables 2). The aspect map revealed that 21.65% of the landslides in the study area occur on the slopes with south aspect, and 20.33% on the slopes with southwest aspect.
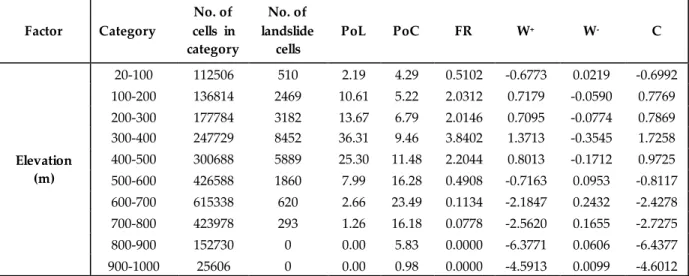
The altitude map of the area was produced using DEM to determine the landslide-altitude relations in the study area. The altitude of the study area varies between 20 and 1000 m. The values of elevation were divided into ten categories with 100 m increments, and landslide-altitude relationship was identified. Using this map, it was identified that the most of the landslides with 36.31% frequency occurred in areas at altitudes ranging from 300 to 400 m in th e study area (Tables 2).
Curvature shows the morphological structure of topography (Lee and Min, 2001; Erener and Düzgün, 2010). Curvature maps are obtained as second derivative of DEM, thus they show changes in the slope (Erener and Düzgün, 2010). A positive curvat ure indicates an upward convex surface, while a negative curvature is indicative of an upward concave surface, and zero represents a flat surface. Plan curvature refers to the tendency of the surface for the water flow to converge (where the flow is collected) or diverge (where the flow is dispersed). The plan curvature with negative value indicates that the flow is collected, and a positive value indicates that the flow is dispersed. Streams and ridges can be removed from these values. Profile curvature indicates flow speed of the water on the surface and convection of sediments along the slope of the curvature and erosion by expressing the slope change. Negative profile component shows concave (hollow) and positive values show convex (top) structure (Kılıç and Gökaşan, 2009). The plan and profile curvature maps of the study area were produced from DEM.
Table 2. Spatial relationship between elevation, slope, aspect, plan and profile curvature with landslides
Factor Category No. of cells in category No. of landslide cells PoL PoC FR W+ W- C Elevation (m) 20-100 112506 510 2.19 4.29 0.5102 -0.6773 0.0219 -0.6992 100-200 136814 2469 10.61 5.22 2.0312 0.7179 -0.0590 0.7769 200-300 177784 3182 13.67 6.79 2.0146 0.7095 -0.0774 0.7869 300-400 247729 8452 36.31 9.46 3.8402 1.3713 -0.3545 1.7258 400-500 300688 5889 25.30 11.48 2.2044 0.8013 -0.1712 0.9725 500-600 426588 1860 7.99 16.28 0.4908 -0.7163 0.0953 -0.8117 600-700 615338 620 2.66 23.49 0.1134 -2.1847 0.2432 -2.4278 700-800 423978 293 1.26 16.18 0.0778 -2.5620 0.1655 -2.7275 800-900 152730 0 0.00 5.83 0.0000 -6.3771 0.0606 -6.4377 900-1000 25606 0 0.00 0.98 0.0000 -4.5913 0.0099 -4.6012
Slope (o) 0-5o 317804 1579 6.78 12.13 0.5592 -0.5851 0.0596 -0.6447 5-10o 172537 2284 9.81 6.59 1.4900 0.4032 -0.0355 0.4386 10-15o 364151 4454 19.14 13.90 1.3767 0.3231 -0.0633 0.3864 15-20o 518619 5113 21.97 19.80 1.1097 0.1051 -0.0277 0.1327 20-25o 568313 4927 21.17 21.69 0.9758 -0.0247 0.0067 -0.0314 25-30o 416583 3047 13.09 15.90 0.8233 -0.1961 0.0332 -0.2292 30-35o 188781 1230 5.28 7.21 0.7334 -0.3125 0.0207 -0.3332 35-40o 58196 521 2.24 2.22 1.0077 0.0077 -0.0002 0.0079 40-45o 12833 106 0.46 0.49 0.9297 -0.0735 0.0003 -0.0739 > 45o 1944 14 0.06 0.07 0.8106 -0.2117 0.0001 -0.2118 Aspect Flat 212888 740 3.18 8.13 0.3912 -0.9439 0.0529 -0.9968 North 325497 2367 10.17 12.42 0.8185 -0.2019 0.0257 -0.2276 Northe ast 283137 2883 12.39 10.81 1.1461 0.1377 -0.0180 0.1557 East 319733 1901 8.17 12.20 0.6692 -0.4046 0.0454 -0.4500 Southe ast 301823 1567 6.73 11.52 0.5844 -0.5409 0.0532 -0.5941 South 251493 5038 21.65 9.60 2.2548 0.8244 -0.1442 0.9686 Southwe st 229258 4732 20.33 8.75 2.3232 0.8549 -0.1368 0.9917 We st 285199 2442 10.49 10.89 0.9638 -0.0372 0.0045 -0.0417 Northwe st 410733 1605 6.90 15.68 0.4398 -0.8264 0.1000 -0.9264 Plan Curvature Concave 1041698 10053 43.19 39.76 1.0862 0.0835 -0.0591 0.1426 Flat 352312 1716 7.37 13.45 0.5482 -0.6051 0.0685 -0.6736 Conve x 1225751 11506 49.44 46.79 1.0566 0.0555 -0.0515 0.1070 Profile Curvature Concave 1211429 11365 48.83 46.24 1.0560 0.0549 -0.0498 0.1047 Flat 285623 1232 5.29 10.90 0.4855 -0.7272 0.0616 -0.7888 Conve x 1122709 10678 45.88 42.86 1.0705 0.0688 -0.0548 0.1236
PoL: percentage of landslide occurrence in each subcategory, PoC: percentage of each subcategory, FR: Frequency Ratio, W+: positive weight, W-: negative weight, C: weights contrast
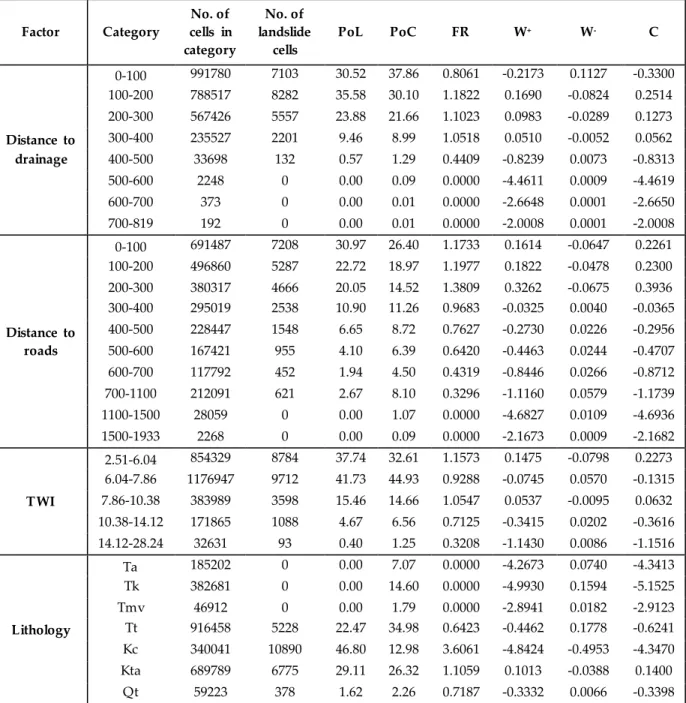
Another important variable controlling the stability of the slope is the degree of saturation of the material on the slopes. The proximity of slopes to drainage network is another important factor in terms of stability. Running waters such as rivers or creeks disrupt the stability by eroding the filling and toe of slopes or by saturating the material constituting the slope to the level of the stream or in both ways (Yalçın, 2008). The drainage network in the study area was produced from DEM and the proximity map of the drainage using related GIS analysis routines. The relationship between distance to drainage networks and landslides is shown in Table 3. Approximately 90% of the landslides in the study area were in the first 300 m distance to drainage networks.
Table 3. Spatial relationship between lithology, TWI, distance to roads and drainage with landslides Factor Category No. of cells in category No. of landslide cells PoL PoC FR W+ W- C Distance to drainage 0-100 991780 7103 30.52 37.86 0.8061 -0.2173 0.1127 -0.3300 100-200 788517 8282 35.58 30.10 1.1822 0.1690 -0.0824 0.2514 200-300 567426 5557 23.88 21.66 1.1023 0.0983 -0.0289 0.1273 300-400 235527 2201 9.46 8.99 1.0518 0.0510 -0.0052 0.0562 400-500 33698 132 0.57 1.29 0.4409 -0.8239 0.0073 -0.8313 500-600 2248 0 0.00 0.09 0.0000 -4.4611 0.0009 -4.4619 600-700 373 0 0.00 0.01 0.0000 -2.6648 0.0001 -2.6650 700-819 192 0 0.00 0.01 0.0000 -2.0008 0.0001 -2.0008 Distance to roads 0-100 691487 7208 30.97 26.40 1.1733 0.1614 -0.0647 0.2261 100-200 496860 5287 22.72 18.97 1.1977 0.1822 -0.0478 0.2300 200-300 380317 4666 20.05 14.52 1.3809 0.3262 -0.0675 0.3936 300-400 295019 2538 10.90 11.26 0.9683 -0.0325 0.0040 -0.0365 400-500 228447 1548 6.65 8.72 0.7627 -0.2730 0.0226 -0.2956 500-600 167421 955 4.10 6.39 0.6420 -0.4463 0.0244 -0.4707 600-700 117792 452 1.94 4.50 0.4319 -0.8446 0.0266 -0.8712 700-1100 212091 621 2.67 8.10 0.3296 -1.1160 0.0579 -1.1739 1100-1500 28059 0 0.00 1.07 0.0000 -4.6827 0.0109 -4.6936 1500-1933 2268 0 0.00 0.09 0.0000 -2.1673 0.0009 -2.1682 TWI 2.51-6.04 854329 8784 37.74 32.61 1.1573 0.1475 -0.0798 0.2273 6.04-7.86 1176947 9712 41.73 44.93 0.9288 -0.0745 0.0570 -0.1315 7.86-10.38 383989 3598 15.46 14.66 1.0547 0.0537 -0.0095 0.0632 10.38-14.12 171865 1088 4.67 6.56 0.7125 -0.3415 0.0202 -0.3616 14.12-28.24 32631 93 0.40 1.25 0.3208 -1.1430 0.0086 -1.1516 Lithology Ta 185202 0 0.00 7.07 0.0000 -4.2673 0.0740 -4.3413 Tk 382681 0 0.00 14.60 0.0000 -4.9930 0.1594 -5.1525 Tmv 46912 0 0.00 1.79 0.0000 -2.8941 0.0182 -2.9123 Tt 916458 5228 22.47 34.98 0.6423 -0.4462 0.1778 -0.6241 Kc 340041 10890 46.80 12.98 3.6061 -4.8424 -0.4953 -4.3470 Kta 689789 6775 29.11 26.32 1.1059 0.1013 -0.0388 0.1400 Qt 59223 378 1.62 2.26 0.7187 -0.3332 0.0066 -0.3398
PoL: percentage of landslide occurrence in each subcategory, PoC: percentage of each subcategory, FR: Frequency Ratio, W+: positive weight, W-: negative weight, C: weights contrast
The stability problems can also be seen in slopes that are affected by the construction of roads (Yalçın, 2008). The roads opened on the slopes cause load reduction both at the toe of slopes and in the topography, leading to an increase in the tension behind the slope and the development of ten sion cracks. Instability might be caused as the negative effects of road constructions, as water entering the roads from outside may disturb the equilibrium on slope. The road network in the study area was obtained digitally from Başarsoft Company. The map showing the proximity of the road was produced using the corresponding GIS analysis routines. In order to determine the relationship between the proximity to roads and the landslides, the road map and the landslide map were overlaid and it was found that 30.97% of the landslides in the study area were occurred within 100 m of the roads (Table 3). One of the indicators used while evaluating the saturation of geological material in a field is topographic wetness index (TWI). This index provides information about the aerial dimension of the
study area in respect to its water saturation. The infiltration of water into the material increases pore water pressure in the material as well as reduces the strength of the material (Gökçeoğlu et al., 2005). Therefore, the direction and density of flow in the study area were calculated using the DEM; and the relative TWI map of the area was prepared. The relationship between landslides with TWI is shown in Table 3.
METHODS USED IN THE STUDY Bayesian Probability Model
Bayesian probability model is a probability theorem, which can be used to obtain posteriori probability by updating the premise of probability expectations related to an event with new information obtained in case of the realization of the event (Akıncı et al., 2015). Accordingly, when an estimation of the risk of landslides in a region is desired, some of the possible situations must be determined. In such a case, there might be following conditions of landslide events. The selected area can be really a landslide area having two possibilities: there will be or will not be a landslide in the future. If the selected area is not actually a landslide area, even in this case, there would be the same two possibilities in the future about the prediction of a landslide. These instances can be expressed in the form of probability propositions.
What is the probability of future landslides P(A|L) for the selected area in case of being a landslide area according to the past experiences? What is probability of future landslides P (A|notL) for the selected area in case of not being a landslide area according to the experience? In case of the selected area being a landslide area, according to the past experience, it is clear that the probability of no landslide in the future P(notA|L) and similarly P(notA|notL) should be effective on the final decision. The posteriori probability values can be calculated with bayesian probability model by evaluating these possibilities together in accordance with probability axioms. The forecasts predicting that the selected area will face a landslide in the future are assigned positive weights, otherwise negative weights. This approach is also called “weights of evidence (WoE)” model (Doğan et al., 2012).
WoE model was mathematically expressed by van Westen et al. (2003) and Regmi et al. (2010). The equations, used in this study, were proposed by Regmi et al. (2010) and employed by Özdemir and Altural (2013) to calculate the weight of the sub -categories of factors affecting landslides:
[ ] [ ] (3) In these equations, A1 represents the number of cells of landslide in a selected subcategory, A2 represents the total number of landslide cells outside the selected category, A3 represents number of cells with no landslide in the selected category, and A4 represents the total number of cells with no landslide outside the selected category. Thus, (A1 + A2) represents the total number of cells in landslide work area and (A3 + A4) represents the total number of cells with no landslide in the studied area.
As stated by van Westen (2002) and Vijith et al. (2014), “the positive weight (W+) is used to indicate the importance of the presence of the factor for the occurrence of landslides. If W+ is positive the presence of the factor is favorable for the occurrence of landslides, and if W+ is negative it is not
favorable. Negative weight (W-) is used to evaluate the importance of the absence of the factor for the occurrence of landslides. When W- is positive the absence of the factor is favorable for the occurrence of landslides, and when it is negative, the factor is non-favorable”. The difference between the W+ and W− weights is called “weights contrast (C)”, and it reflects the overall spatial association of the predictor variable with the landslide. A contrast value equal to zero indicates that the sub -categories of the factors causing landslides are not significant for the analysis. Positive contrast refers to a positive spatial correlation, and negative contrast refers to the opposite (Özdemir and Altural, 2013). W+ and W− weights of the sub-category of the factors affecting landslide in study areas and C contrasts were calculated u sing the above formula (Tables 2 and Table 3) and the landslide susceptibility map shown on Figure 3 was generated using these weights.
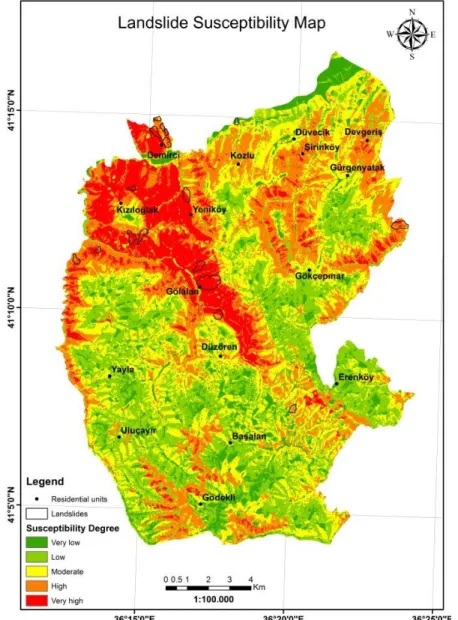
Figure 3. Landslide susceptibility map produced by bayesian probability model Frequency Ratio Model
The frequency ratio model was used to determine the correlation between past landslide locations and each factor affecting landslides (Lee and Min, 2001; Lee et al., 2004; Erener and Düzgün, 2010). As defined by the Lee and Talib (2005), the frequency ratio is the “ratio of the area where landslides occurred in the total study area, and also, is the ratio of the probabilities of a landslide occurrence to a
non-occurrence for a given attribute”. In order to find the frequency ratio of each factor that affects landslides in the study area, each factor was assigned to a subcategory and the number of cells where a landslide has occurred in each subcategory of each factor was determined. The following equation was used to calculate the frequency ratio.
Here, PoL is the percentage of landslide occurrence in each subcategory of a factor that affects landslide and PoC is the percentage of each subcategory of a factor that affects landslide. PoL is determined as A/B and PoC as C/D, where A refers to the number of landslide cells in each subcategory, B refers to the total number of landslide cells, C refers to the number of cells in each subcategory and D refers to the total number of cells in the study area (Erener and Lacasse, 2007).
Figure 4. Landslide susceptibility map produced by frequency ratio model
The frequency ratios greater than 1 indicate high correlations with the landslides, while smaller than 1 indicate low correlations (Lee and Pradhan, 2007). The frequency ratios computed for each category were assigned to the relevant layer in the ArcGIS 10.2 software and afterwards the Landslide
Susceptibility Index (LSI) were calculated by overlapping all layers over each other. The frequency ratios of each subcategory were summed to calculate the LSI, as shown in equation 5.
The LSI value varied between 3.18 and 17.13 in our case study. If the LSI value is high, it means a higher susceptibility to landslide; a lower value means a lower susceptibility to landslides (Lee and Evangelista, 2005). Subsequently, the LSI was divided into five classes with natural break classification, each representing “very low, low, moderate, high and very high susceptible” areas. The final susceptibility map with the five risk areas is shown in Figure 4.
RESULTS
In this study, we focused on two issues according to the findings. The first one is the prediction (estimation) capabilities of models used in the production of landslide susceptibility maps, and the second one is the determination of the principal factors causing landslides in the study area.
In the present study, two models were used in the production of landslide susceptibility maps. Correct classification approach was primarily used to test the reliability of the landslide susceptibility maps. The correct classification approach showed the estimated accuracy of the landslide area in the control dataset in landslide susceptibility maps . For this purpose, the landslides in the landslide inventory maps were not included in the analysis for controlling purpose; and the landslide susceptibility maps were compared and distribution of landslide areas was determined according to the susceptibility class.
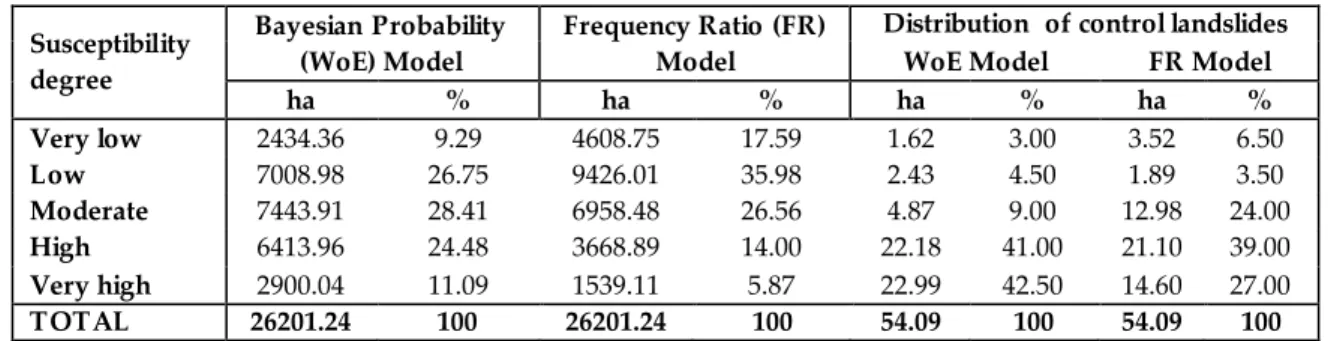
For the evaluation of the landslide susceptibility map produced by the frequency ratio model , as seen in Table 4, it was identified that 27% of the control landslides occurred in an area with a very high degree of susceptibility, 39% in an area with a high degree of susceptibility, 24% in an area with a moderate degree of susceptibility (90% in total).
On the other side, for the evaluation of the susceptibility map produced by the bayesian probability model, as seen in Table 4, it was identified that 42.5% of the control landslides occurred in an area with a very high degree of susceptibility, 41% in an area with a high degree of susceptibility, 9% in an area with a moderate degree of susceptibility (92.5% in total).
Table 4. Distribution of susceptibility degree and density of control landslides
Susceptibility degree Bayesian Probability (WoE) Model Frequency Ratio (FR) Model
Distribution of control landslides
WoE Model FR Model
ha % ha % ha % ha % Very low 2434.36 9.29 4608.75 17.59 1.62 3.00 3.52 6.50 Low 7008.98 26.75 9426.01 35.98 2.43 4.50 1.89 3.50 Moderate 7443.91 28.41 6958.48 26.56 4.87 9.00 12.98 24.00 High 6413.96 24.48 3668.89 14.00 22.18 41.00 21.10 39.00 Very high 2900.04 11.09 1539.11 5.87 22.99 42.50 14.60 27.00 TOTAL 26201.24 100 26201.24 100 54.09 100 54.09 100
By all accounts, it was concluded that the produced landslide susceptibility maps offer an acceptable level of accurate performance, whereas the best performance was obtained by bayesian probability model.
The factors that make up the mass movement are divided into four groups in general: ground conditions, geomorphological processes, physical processes, and the human effects. In the evaluations, it was determined that the mass movements in Canik district were caused by ground conditions. When the relationship between the factors used in landslide susceptibility analysis (and sub -categories) and the landslide areas found in the landslide inventory maps was considered, it is observed that landslides
occur at a frequency of 46.79% in the fields with Cankurtaran formation, 29.13% in the fields with Akveren formation, and 22.46% in the fields with Tekkeköy formation as per the characteristics of lithological unit (Table 2). The landslides in these three formations account a total of 98.38% of the landslides occurring in the study area.
CONCLUSION
In this study, the landslide susceptibility maps of the area of the Canik district of Samsun province were produced using bayesian probability and frequency ratio models. Nine different factors affecting landslides were used in the susceptibility analysis. The landslide susceptibility maps produced were classified into five types as “very low, low, moderate, high and very high susceptible” areas . In order to test the reliability of the landslide susceptibility maps, control landslides found in the landslide inventory maps, which were not included in the analysis for control purpose, were analyzed; and landslides susceptibility maps were compared and distribution of landslide areas was determined according to the susceptibility class. The verification results showed that the landslide susceptibility mapping using bayesian probability model is more accurate than frequency ratio model. Accordingly, it was identified that 42.5% of the control landslides occurred in an area with a very high degree of susceptibility and 41% in an area with a high degree of susceptibility, 9% in an area with a moderate degree of susceptibility. As a result, it can be ascertained that the landslide susceptibility map produced by using bayesian probability model is consistent with the control landslides occurring in very high and high susceptible areas with 83.5% frequency. This landslide susceptibility map can be used for preliminary land use planning and hazard mitigation purpose.
REFERENCES
Akıncı, H., Özalp, A. Y., Özalp, M., Kılıçer, S. T., Kılıçoğlu, C., Everan, E., 2015, “Production of Landslide Susceptibility Map using Bayesian Probability Model”, International Journal of 3 -D Information Modeling, Vol. 4(2), pp. 16-33.
Bahadır, M., 2013, “Samsun İli İklim Özelliklerinin Enterpolasyon Teknikleri ile Analizi”, A nadolu Doğa Bilimleri Dergisi, Vol. 4(1), pp. 28-46.
Hong, V., Cirianni, F., Leonardi, G., Palamara, R., 2016, “A Fuzzy -based Methodology for Landslide Susceptibility Mapping”, Procedia - Social and Behavioral Sciences, Vol. 223, pp. 896-902. Chalkias, C., Ferentinou, M., Polykretis, C., 2014, “GIS-Based Landslide Susceptibility Mapping on the
Peloponnese Peninsula, Greece”, Geosciences, Vol. 4, pp. 176-190.
Chen, W., Xie, X., Wang, J., Pradhan, B., Hong, H., Bui, D.T., Duan, Z., Ma, J., 2017, “A Comparative Study of Logistic Model Tree, Random Forest and Classification and Regression Tree Models for Spatial Prediction of Landslide Susceptibility”, Catena, Vol. 151, pp. 147-160.
Colkesen, I., Sahin, E.K., Kavzoglu, T., 2016, “Susceptibility Mapping of Shallow Landslides Using Kernel-Based Gaussian Process, Support Vector Machines and Logistic Regression”, Journal of African Earth Sciences, Vol. 118, pp. 53-64.
Çan, T., Duman, T.Y., Olgun, Ş., Çörekçioğlu, Ş., Gülmez, F.K., Elmacı, H., Hamzaçebi, S., Emre, Ö., 2013, “Türkiye Heyelan Veri Tabanı”, TMMOB Coğrafi Bilgi Sistemleri Kongresi 2013, Ankara, 11-13 Kasım 2013.
Çevik, E., Topal, T., 2003, “GIS-Based Landslide Susceptibility Mapping for a Problematic Segment of the Natural Gas Pipeline, Hendek (Turkey)”, Environmental Geology, Vol. 44, pp. 949–962.
Dağ, S., Bulut, F., Alemdağ, S., Kaya, A., 2011, “Heyelan Duyarlılık Haritalarının Üretilmesinde Kullanılan Yöntem ve Parametrelere İlişkin Genel Bir Değerlendirme”, Gümüşhane Üniversitesi Fen Bilimleri Enstitüsü Dergisi, Vol. 1(2), pp. 151–176.
Dağdelenler, G., 2013, Heyelan Duyarlılık Haritalarının Üretilmesinde Örneklem ve Doğrulama Stratejilerinin Değerlendirilmesi (Gelibolu Yarımadası’nın Doğu Kesimi), Doktora Tezi, Hacettepe Üniversitesi, Ankara.
Dai, F.C., Lee, C.F., Li, J., Xu, Z.W., 2001, “Assessment of Landslide Susceptibility on The Natural Terrain of Lantau Island, Hong Kong”, Environmental Geology, Vol. 40(3), pp. 381–391.
Doğan, S., Akıncı, H., Kılıçoğlu, C., 2012, “Bayes Olasılık Teoremi Kullanılarak Samsun İl Merkezinin Heyelan Duyarlılık Haritasının Üretilmesi”, 65. Türkiye Jeoloji Kurultayı, Ankara, 2-6 Nisan 2012.
Doyuran, V., Lünel, T., Altıner, D., Koçyiğit, A., 1985, “Samsun Yerleşim Sahası Mikrobölgelendirme Çalışmaları”, Türkiye Jeoloji Kurumu Bülteni, Vol.28, pp. 93-103.
Ercanoğlu, M., Gökçeoğlu, C., Van Asch, Th. W.J., 2004, “Landslide Susceptibility Zoning North of Yenice (NW Turkey) by Multivariate Statistical Techniques”, Natural Hazards, Vol. 32(1), pp. 1– 23.
Erener, A., Lacasse, S., 2007, “Landslide Susceptibility Mapping Using GIS”, The Union of Chambers of Turkish Engineers and Architects (UCTEA) Geographical Information Systems Congress, Trabzon, KTU, October 30 – November 02.
Erener, A., Düzgün, H.S.B., 2010, “Improvement of Statistical Landslide Susceptibility Mapping by Using Spatial and Global Regression Methods in the case of More and Romsdal (Norway)”, Landslides, Vol. 7(1), pp. 55–68.
Gokce, O., Ozden, S., Demir, A., 2008, “Türkiye’de Afetlerin Mekânsal ve İstatistiksel Dağılımı Afet Bilgileri Envanteri”, Bayındırlık ve İskân Bakanlığı Afet İşleri Genel Müdürlüğü, Afet Etüt ve Hasar Tespit Daire Başkanlığı, Ankara.
Gökçeoğlu, C., Duman, T. Y., Sönmez, H., Nefeslioğlu, H.A., 2005, “17 Mart 2005 Kuzulu (Koyulhisar, Sivas) Heyelanı”, Mühendislik Jeolojisi Bülteni, Vol. 20, pp. 17–28.
Gökçeoğlu, C., Ercanoğlu, M., 2001, “Heyelan Duyarlılık Haritalarının Hazırlanmasında Kullanılan Parametrelere Ilişkin Belirsizlikler”, Hacettepe Üniversitesi Yerbilimleri Uygulama ve Araştırma Merkezi Bülteni, Vol. 23, pp. 189–206.
Guha-Sapir, D., Hoyois, Ph., Below, R., 2016, “Annual Disaster Statistical Review 2015: The Numbers and Trends”, Centre for Research on the Epidemiology of Disasters (CRED), Université catholique de Louvain, Brussels, Belgium.
Hong, H., Pourghasemi, H.R., Pourtaghi, Z.S., 2016, “Landslide Susceptibility Assessment in Lianhua County (China): A Comparison between a Random Forest Data Mining Technique and Bivariate and Multivariate Statistical Models”, Geomorphology, Vol. 259, pp. 105-118.
Jebur, M.N., Pradhan, B., Tehrany, M.S., 2014, “Optimization of Landslide Conditioning Factors Using Very High-Resolution Airborne Laser Scanning (Lidar) Data at Catchment Scale”, Remote Sensing of Environment, Vol. 152 (2014), pp. 150-165.
Kavzoglu, T., Sahin, E.K., Colkesen, I., 2015, “Selecting Optimal Conditioning Factor s in Shallow Translational Landslide Susceptibility Mapping Using Genetic Algorithm”, Engineering Geology, Vol. 192 (2015), pp. 101-112.
Kayastha, P., 2015, “Landslide Susceptibility Mapping and Factor Effect Analysis Using Frequency Ratio in a Catchment Scale: A case study from Garuwa sub -basin, East Nepal”, Arabian Journal of Geosciences, Vol. 8(10), pp. 8601-8613.
Keskin, İ., 2011, “1:100.000 Ölçekli Türkiye Jeoloji Haritaları, SAMSUN E-36 ve F-36 Paftaları”, Maden Tetkik ve Arama Genel Müdürlüğü, No:149, Ankara.
Kılıç, F., Gökaşan, E., 2009, “Yeryüzü Şekillerinin SYM ile CBS Ortamında Değerlendirilmesi (Ders Notu)”, YTÜ Fen Bilimleri Enstitüsü, http://www.yildiz.edu.tr/~fkilic/CBSYeryuzuV4.pdf, visit date: August 6, 2014.
Kumtepe, P., Nurlu, Y., Cengiz, T., Sütçü, E., 2009, “Bolu Çevresinin Heyelan Duyarlılık Analizi”, TMMOB Coğrafi Bilgi Sistemleri Kongresi, 02-06 Kasım İzmir.
Lee, S., Min, K., 2001, “Statistical Analyses of Landslide Susceptibility at Yongin, Korea”, Environmental Geology, Vol. 40(9), pp. 1095–1113.
Lee, S., Choi, J., Min, K., 2004, “Probabilistic Landslide Hazard Mapping Using GIS and Remote Sensing Data at Boun, Korea”, Int. J. Remote Sensing, Vol. 25(11), pp. 2037-2052.
Lee, S., Evangelista, D.G., 2005, “Landslide Susceptibility Mapping using Probability and Statistics Models in Baguio City, Philippines”, ISPRS 31st International Symposium on Remote Sensing of Environment, Saint Petersburg, Russia, 20-24 May 2005.
Lee, S., Talip, J.A., 2005, “Probabilistic Landslide Susceptibility and Factor Effect Analysis ”, Environmental Geology, Vol. 47(7), pp. 982-990.
Lee, S., Pradhan, B., 2007, “Landslide hazard mapping at Selangor, Malaysia using frequency ratio and logistic regression models”, Landslides, Vol. 4, pp. 33-41.
Özdemir, A., Altural, T., 2013, “A Comparative Study of Frequency Ratio, Weights of Evidence and Logistic Regression Methods for Landslide Susceptibility Mapping: Sultan Mountains, SW Turkey”, Journal of Asian Earth Sciences, Vol. 64, pp. 180–197.
Öztekeşin, K., 2008, “Samsun Kenti (Büyükşehir Belediyesi) İçmesuyu Potansiyeli”, TMMOB Samsun Kent Sempozyumu, Samsun, 27-29 Kasım 2008.
Petschko, H., Brenning, A., Bell, R., Goetz, J., Glade, T., 2014, “Assessing The Quality of Landslide Susceptibility Maps – Case Study Lower Austria”, Nat. Hazards Earth Syst. Sci., Vol. 14, pp. 95–118.
Regmi, N.R., Giardino, J.R., Vitek, J.D., 2010, “Modeling Susceptibility to Landslides Using The Weight of Evidence Approach: Western Colorado, USA”, Geomorphology, Vol. 115(1-2), pp. 172–187. Sezer, E.A., Nefeslioglu, H.A., Osna, T., 2017, “An Expert-based Landslide Susceptibility Mapping (LSM)
Module Developed for Netcad Architect Software”, Computers & Geosciences, Vol. 98, pp. 26-37.
Temizel, İ., Arslan, M., Abdioğlu, E., Yücel, C., 2014, “Mineral Chemistry and Thermobarometry of Eocene Monzogabbroic Stocks from the Bafra (Samsun) area in Turkey: Implications for Disequilibrium Crystallization and Emplacement Conditions”, International Geology Review, Vol. 56 (10), pp. 1226-1245.
van Westen, C.J., 2002, “Use of Weights of Evidence Modeling for Landslide Susceptibility Mapping”, http://www.adpc.net/casita/Case_studies/Landslide hazard assessment/Statistical landslide susceptibility assessment Weights of evidence modeling CS C Colombia/Weights_of_evidence_modelling_for_landslide_susceptibility_mapping.pdf, visit date: 15 July 2016.
van Westen, C.J., Rengers, N., Soeters, R., 2003, “Use of Geomorphological Information in Indirect Landslide Assessment”, Natural Hazards, Vol. 30(3), pp. 399–419.
Varnes, D.J., 1958, Landslide Types and Processes, in Eckel E.B., ed., Landslides and Engineering Practice, Highway Research Board Special Report 29 (pp.20 -47). NAS‐NRC Publication 544, Washington, D.C.
Varnes, D.J., 1978, Slope Movement Types and Processes, in Schuster, R.L., and Krizek, R.J., eds., Landslides—Analysis and control: National Research Council, Washington, D.C., Transportation Research Board, Special Report 176, p. 11 –33.
Vijith, H., Krishnakumar, K.N., Pradeep, G.S., Ninu Krishnan, M.V., Madhu, G., 2014, “Shallow Landslide İnitiation Susceptibility Mapping by GIS-based Weights-of-Evidence Analysis of Multi-Class Spatial Data-Sets: A Case Study From The Natural Sloping Terrain of Western Ghats, India”, Georisk: Assessment and Management of Risk for Engineered Systems and Geohazards, Vol. 8(1), pp. 48-62.
Vos, F., Rodriguez, J., Below, R., Guha-Sapir D., 2010, “Annual Disaster Statistical Review 2009: The Numbers and Trends”, Centre for Research on the Epidemiology of Disasters (CRED), Université catholique de Louvain, Brussels, Belgium.
Yalçın, A., 2007, “Heyelan Duyarlılık Haritalarının Üretilmesinde Analitik Hiyerarşi Yönteminin ve CBS’nin Kullanımı”, Selçuk Üniversitesi Mühendislik-Mimarlık Fakültesi Dergisi, Vol. 22(3), pp. 1– 14.
Yalçın, A., 2008, “GIS-based Landslide Susceptibility Mapping Using Analytical Hierarchy Process and Bivariate Statistics in Ardesen (Turkey): Comparisons of Results and Confirmations”, Catena, Vol. 72(1), pp. 1–12.
Yılmaz, I., 2009, “Landslide Susceptibility Mapping Using Frequency Ratio, Logistic Regression, Artificial Neural Networks and Their Comparison: A Case Study from Kat landslides (Tokat-Turkey)”, Computers & Geosciences, Vol. 35(6), pp. 1125–1138.