EVALUATION OF POZZOLAN-LIME STABILIZATION ON PHYSICAL PROPERTIES OF FINE SANDY ENGINEERING FILLS
Babak JAMHIRI
Master of Geotechnical Engineering, Department of Civil Engineering, Shahid Chamran University, Ahvaz, IRAN
(Geliş/Received: 28.02.2019; Kabul/Accepted in Revised Form: 26.06.2019)
ABSTRACT: Loose sands are susceptible to the earthquake due to lack of strength and even saturated sands may experience liquefaction. To address problems in loose fine sands, in this article, hydrated lime and zeolite as one of the pozzolanic methods for soil improvement are instrumented together to improve fine sandy soils’ compaction properties. To provide aid for practical compaction of fine sandy soils, physical properties of treated soils with 3, 4 and 5 percent of lime and 8, 10 and 12 percent of zeolite are investigated. A series of Proctor tests, Specific Gravity of soil’s solids and Minimum Index Density was performed to obtain maximum dry density and index void ratios. Additionally, the hydration rate of zeolite is modeled by Arrhenius method to quantify the effective duration of hydration process. Results showed that application of zeolite led to a better compaction property while treated soils only with lime did not show any improvement.
Key Words: Soil improvement, Zeolite, Simulation of hydration, Arrhenius equation
İnce Kumlu Mühendislik Dolgularının Fiziksel Özellikleri Üzerine Pozzolan-Kireç Stabilizasyonunun Değerlendirilmesi
ÖZ: Gevşemiş kumlar, mukavemet eksikliğinden dolayı depreme karşı hassastır ve doymuş kumlar bile sıvılaştırılabilir. Gevşek ince kumlardaki sorunları ele almak için, bu makalede, zemin iyileştirme için pozzolanik yöntemlerden biri olan hidratlı kireç ve zeolit, ince kumlu zeminlerin sıkıştırma özelliklerini geliştirmek için birlikte kullanılmıştır. İnce kumlu zeminlerin pratik olarak sıkıştırılmasına yardımcı olmak için, işlenmiş zeminin yüzde 3,4 ve 5 oranında kireç ve yüzde 8,10 ve 12 oranında zeolitle birlikte fiziksel özellikleri incelenmiştir. Maksimum kuru yoğunluğu ve indeks boşluk oranlarını elde etmek için bir seri Proctor testi, zeminin Özgül ağırlığı ve asgari endeksi yoğunluk yapılmıştır. Ek olarak, zeolitinhidrasyon hızı, hidrasyon işleminin etkin süresini ölçmek için modellenmiştir. Sonuçlar, zeolit uygulamasının daha iyi bir sıkıştırma özelliğine yol açtığını, ancak yalnızca kireçle muamele edilmiş topraklarda herhangi bir gelişme olmadığını göstermiştir.
Anahtar Kelimeler: Zemin iyileştirme, Zeolit, Hidrasyon modeli, Arrhenius denklemi
INTRODUCTION
Application of natural pozzolans with lime to improve weak soils, dates back to thousands of years. Today zeolites as an eco-friendly pozzolan with alumina-silicate structure is being used in many environmental and industrial processes such as a cement replacement pozzolan in concrete technology. A zeolite-cement mixture generates less heat of hydration compared to other commonly used
supplementary cementitious materials (SCM) such as silica fume and metakaolin, which are extremely expensive or not fully investigated in terms of their suitability; this is likely due to the removal of cement from the system and shorter initial and final setting times than that of the plain mixture (Ahmadi and Shekarchi 2010; Najimi et al. 2012). Additionally, durability properties of concrete containing zeolite proved to have a considerable effect on water penetration, chloride ion penetration, corrosion rate and drying shrinkage of concrete. Furthermore, cements containing natural zeolite exhibit improved resistance to sulfate attack and reduced the ettringite formation (Karakurt and Topcu 2009; Valipour et al. 2013).
Snellings et al. (2009) studied early pozzolanic reactions in pastes of lime and natural zeolites; for pastes containing chabazite and Na-, K-, and Ca-exchanged clinoptilolite tuffs, they showed that alkali-exchanged clinoptilolites produced a higher pozzolanic reactivity, a more permeable reaction product layer and longer silicate chains in the calcium silicate hydrate phase compared to their Ca-exchanged counterpart. Additionally, they concluded that the exchangeable cation content of clinoptilolite influences the duration of the initial setting time and the beginning of hardening and hydration rate of zeolite lime blend. Varela et al. (2006) compared the pozzolanic activity of two zeolitic rocks from two Cuban deposits and found that Carolinas rocks containing sub automorphic and automorphic heulandite or clinoptilolite crystals had a lower reaction rate with portlandite (Ca(OH)2). This result was related not to the particle size distribution of the materials but to their soluble SiO2 content and mineralogy. Numerous studies on zeolite practical applications in concrete technology are indicating that use of zeolite in soil stabilization which follows a similar pattern could be a beneficial practice for soil and road practitioners specially due to quick initial hydration and setting time of pozzolanic reaction which will expedite compaction of fine to clean sandy soils.
Thus, as available data in literature regarding compacting soils with zeolite and lime as engineering fills for embankments or road paving material are deficient, and as fine saturated sands are prone to major disasters such as liquefaction (Jamhiri and Parsaeimaram 2019; Jamhiri et al. 2020), in this study to provide a practical knowledge of compaction properties of zeolite-lime stabilized fine sandy soils as a method of soil stabilization , a series of Standard Proctor tests, Specific Gravity of soil’s solids and Maximum and Minimum Index Density was performed on treated soils to demonstrate the effect of zeolite and lime with or without each other when using them in soil stabilization. To extend the comprehension of the data reported in this paper, different percentage amount of zeolite and lime were used and significant physical soil parameters such as maximum dry density, optimum moisture content, maximum and minimum-index void ratio were identified. In reference to the fact that practical compaction of soils with lime and pozzolan depends mainly on hydration rate rather than pozzolanic reaction at early ages of application, in this study an analytical simulation is performed on zeolite and lime hydration rate and X-ray Diffraction Analysis is utilized to trace the produced hydration products. MATERIALS
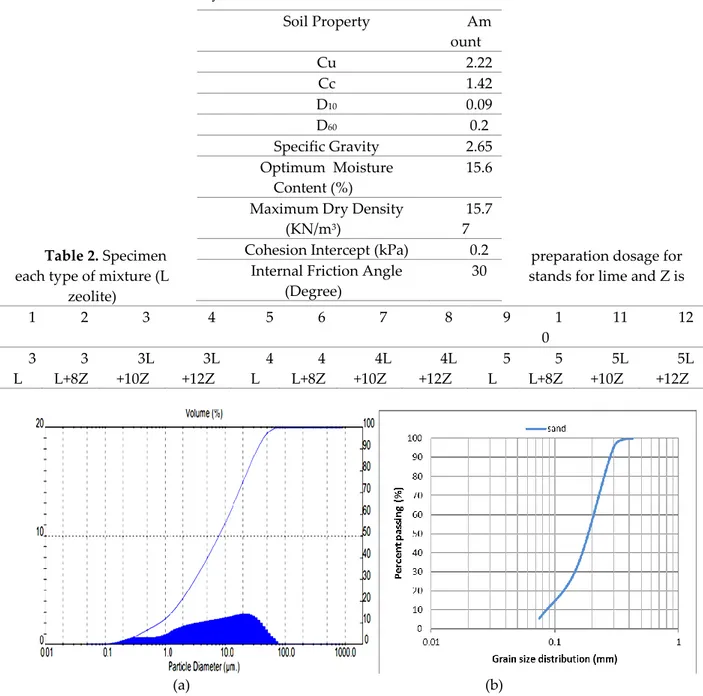
The results of the parent soil characterization tests including Direct Shear (DS) test and soil gradation using sieve analysis are shown in Table 1. Grain-size distribution curve of soil and laser particle analysis of zeolite are shown in Figure 1 (a and b), respectively. This soil is classified as poorly graded sand (SP) according to the Unified Soil Classification System and micronized zeolite is of clinoptilolite kind. Dry hydrated lime was used as the co-binding agent. The specific gravity of the lime grains is 2.49. For the characterization tests, distilled water was used, but for molding specimens the other tests, tap water was used. To establish logical conclusions, soil specimens were prepared in different percentages as shown in Table 2.
Table 1. Physical and mechanical characteristics of studied fine sand
Table 2. Specimen preparation dosage for
each type of mixture (L stands for lime and Z is
zeolite) 1 2 3 4 5 6 7 8 9 1 0 11 12 3 L 3 L+8Z 3L +10Z 3L +12Z 4 L 4 L+8Z 4L +10Z 4L +12Z 5 L 5 L+8Z 5L +10Z 5L +12Z (a) (b)
Figure 1. (a) Laser Particle Size Analysis distribution curve obtained by Malvern Mastesizer Instrument
(b) Grain size distribution and unified classification of plain sand
EXPERIMENTAL PROGRAM
To reach a uniform mixture, all additives including 3,4 and 5 percent of lime and 8, 10 and 12 percent of zeolite were properly mixed with the oven dried sandy soil for half an hour according to the preparation dosage shown in Table 2. Afterwards, compaction characteristics of the stabilized soil have been achieved by using standard proctor test according to ASTM D698. Additionally, specific gravity of soil’s solid is separately identified for each mixture as the ratio of dried mass of stabilized soil to the mass of water of the equal volume. Specific gravity of soil’ solid in this article is defined in accordance with ASTM D854. To investigate physical changes in the mixtures and to quantify the amount of void pore space, maximum and minimum index void ratios also were determined by replacing each
Soil Property Am ount Cu 2.22 Cc 1.42 D10 0.09 D60 0.2 Specific Gravity 2.65 Optimum Moisture Content (%) 15.6 Maximum Dry Density
(KN/m3)
15.7 7 Cohesion Intercept (kPa) 0.2
Internal Friction Angle (Degree)
corresponding maximum and minimum dry densities according to D 4254 – 00. Considering that during field compaction relative density of subjected soil (Dr %) should meet at least 90 percent of its counterpart in laboratory compaction, all remolded specimens were made to reach required relative density. With the aim of getting high accuracy of the results, each test was performed twice, and the average results were reported for further analysis.
RESULTS AND DISCUSSION
Maximum Dry Density and Zeolite Content
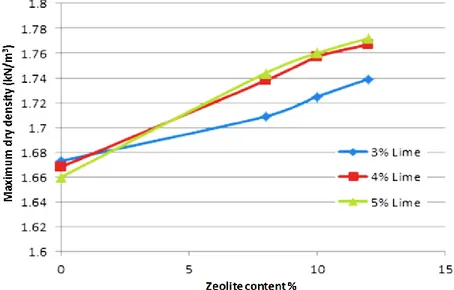
The results of standard proctor tests on mixed samples are shown in Figure 2. The aim of the test is to establish a graph including maximum dry density that may be obtained for a given soil with standard attempts of compaction effort. When a series of compaction efforts is gradually performing at different water contents resulted plot of compaction usually shows a distinct peak. Accordingly, the curve is drawn with axes of dry density and moisture content with the peak representing the maximum dry density at optimized moisture content. Figure 2, indicates that with the increase of zeolite content, maximum dry density increases. One of the reasons could be that as parent soil is a poorly granular soil, in general, addition of micronized zeolite will lead to a change in soil’s gradation and an increase of the fine fraction and consequently production of a well graded soil. Insertion of lime in conjunction with zeolite in the soil also showed a similar trend which is due to the fact that as zeolite carries a negative anion charge it tends to absorb positive cations in a mixture of water solution and this leads to the creation of diffused double layer water.
Figure 2. Variations of maximum dry density with variations of zeolite content
Double layer water predominantly is absorbed to the surface of clayey soils because clays are charged particles. While in the case of fine granular soils such a complex layer does not exist. But with the presence of solved zeolite in water and co-absorption of lime; hydration and pozzolanic reactions begin. Mertens et al. (2009) who investigated the pozzolanic reactions among different types of natural rich pozzolans, indicated that finer grain sizes or higher surface areas of pozzolans generally lead to a higher short-term pozzolanic activity, whereas hydration rate influences only the short-term reactivity, while pozzolanic reaction had an effect on both the long- and short-term reactivity. So as field compaction of soils is significantly dependent on early stages of mixing and a reliable design procedure is not accountable until it gets confirmation both in practice and also in simulated analysis and as it was addressed by Mertens et al. (2009) short-term reactivity of mixed soil is mainly controlled by degree of hydration. Thus, to certify the spread of hydration process with the implementation of the affinity
hydration model (Jendele et al. 2013; da Silva et al. 2015) the rate and extent of hydration is modeled to weight the share of influence of binder hydration on compaction parameters.
Simulation of Zeolite and Lime Hydration Process
It is believed that at early stages of zeolite lime reaction, pozzolanic reaction is prevailed considerably by hydration of calcium hydroxide with alkali exchanged clinoptilolite (Mertens et al. 2009). The first consequence of hydration is the presence of a new phase belonging to the AFm group (namely calcium carbolaluminate hydrate such as C3S) – which is based on pozzolanic reaction between calcium hydroxide and aluminates in the zeolite. The consumption of the C3S phase and crystallization of the CH phase and deceleration of the hydration rate is generally considered to be caused by the dormant inducing period of zeolite and thickening of following calcium silicate hydrate chains (C–S–H) barrier layer on the C3S surface. However, compare to cement systems, the mineral phases C3A, C3S will be lower than the detection limit in tested samples in regular detecting analyses; implying that these types of phases became fully hydrated during the early stage of curing and do not contribute to future strength developments. This observation was also simulated by affinity hydration model proposed by da Silva et al. 2013 and Jendele et al. 2013 with some minor adjustments, owing to the different nature of the binding agent in those studies. The affinity hydration model adjusts all stages of cement blends hydration under isothermal temperature. The used methods for simulating hydration progress mainly are based on amount of consumed Ca(OH)2, released heat of hydration, chemically bound water content and loss of volume due to drying shrinkage. The affinity hydration model incorporates chemical affinity, at any specific degree of hydration (DoH), but under varying temperature via Arrhenius equation as follows: 25
1
1
exp
298.15
a TE
A
A
R
T
(1)where R [Jmol−1K−1] is the universal gas constant and Ea [Jmol−1] is the apparent activation energy dependent of assumed binder fineness (da Silva et al. 2013 and Jendele et al. 2013). DoH is assumed as a function of Water-binder ratio and T is the average temperature of sealed samples which is scaled down to the correspond original chemical affinity assumption of isothermal curing temperature of 25°C in the model and 20°C in this study.
Table 3 represents adjusted parameters in simulation of degree of hydration in which all mineral phases such as C3A, C3S (3CaΟ.SiΟ2) and C4AF were set both to those reported in the literature (Vogiatzis et al. 2012) and XRF (X-ray fluorescence) of the binder in accordance with the minimum range of detection limit of XRD apparatus so that degree of hydration can be computed with higher precision. Some modification must be taken into account in model properties such as replacing cement to water ratio to cement to binder (zeolite-lime) ratio and real field condition equalized to isothermal curing in 20°C. Additionally, it is assumed logically that as samples were prepared using optimum moisture content varying about 12 to 14 percent, in simulated model the minimum value was used to account for worth case scenario where in reality samples lose water during preparation.
Table 3. XRF experimental binder properties and estimated parameters by simulated affinity model setting parameter 0.08 C3S [-] 0.02 C2S [-] 0.03 C3A [-] 0.03 C4AF [-] 7800 BLAINE [m2/kg]
0.12 Water to binder ratio [C]
1.165 B1 [1/h] 0.308 B2 [-] 0.086 ETA [-] 0.3 DoH_inf [-] 73967. 7
Activation Energy [J/mol] 83.78 Potential Heat [J/g]
0.1 Step size [days]
1 Sealed & Isothermal Curing 20°C
Figure 2. Simulated degree of hydration (DoH) of plain lime and zeolite binder in the extension of time
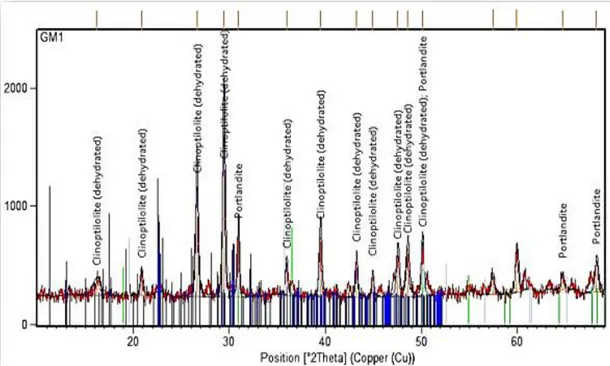
The simulated evolution of DoH is shown in Figure 2 and it can be seen as XRD analysis in Figure 3 also confirms that phases such as C3A, C3S (3CaΟ.SiΟ2) and C4AF were not even in the range of detection and did not influence the pace of hydration of zeolite and lime. Considering the fact that zeolite hydration occurs at early ages of curing, as shown in Figure 2, it only continues to develop up to roughly 10 days but after that it does not last longer and contributes to the final strength as a constant factor and the overall performance of stabilized soil will only lean on pozzolanic reactions.
As already mentioned, simulated hydration process in Figure 2 was confirmed by an XRD analysis of mixture containing zeolite and lime at early ages of setting. The result of X-ray analysis serves simultaneously as chemical identification (compare to recognized patterns) of the reaction products by
measuring the mass dimension of different elements participating in the process in the scanned array; while confirming the presence of dehydrated zeolite (clinoptilolite) content. This is the way that hydration process and its pozzolanic products (C-S-H) were identified as well as the hydrated lime particles (portlandite) of the stabilized soil.
Figure 3. X-ray diffraction analysis of samples containing zeolite and lime
It should be emphasized that, appropriate mixing in the laboratory causes less infiltration of air voids into mixture while later on during filed compaction or backfilling, insufficient compaction of mixed soil will lead to appearance of large pores especially after consumption of free water in the soil during hydration and also due to surface evaporation. Consequently, any simulated modeling confirmed by experimental results before employment in practice still should be accompanied by in field test subjects.
Specific Gravity Variations
The values of specific gravity of dry mixed samples by instrumentation of pycnometer procedure are summarized in table 4. It can be seen in Table 4 that in samples without zeolite as lime content increased specific gravity was also increased, but there is no such a trend in samples containing zeolite. Meanwhile, in sample with a constant lime content as zeolite content increased specific gravity is also increased which is expected to be due to more absorbed volume of water to the charged surface of zeolite.
Table 4. Variations of specific gravity of solid particle (Gs) With variation of lime and zeolite content
5% Lime 4% Lime 3% Lime Zeolite content 2.86 2.85 2.84 0% zeoite 2.72 2.793 2.832 8% zeoite 2.733 2.813 2.844 10% zeoite 2.752 2.822 2.861 12% zeoite
Index Density Dependent Void Ratios
The minimum index density represents the loosest condition of a granular soil which prevents dispersion and minimizes particle segregation. Any particular procedure opted to determine the relative density for a given compaction procedure should comprise determining the minimum and maximum void ratios correspond to the states when soil is absolutely cohesionless with no considerable strength. Also, when soil is properly compacted with acceptable bearing capacity in such a condition that prevents particle segregation and minimizes compaction efforts of the soil, its state is definable as maximum index density. According to ASTM D 4254 maximum and minimum-index void ratios can be calculated by substituting maximum and minimum (loose state) index dry densities in the following equation:
1
w s dG
e
(2)where e is driven void ratio by substituting equivalent index dry densities,
d is maximum or minimum dry density of the specimen and
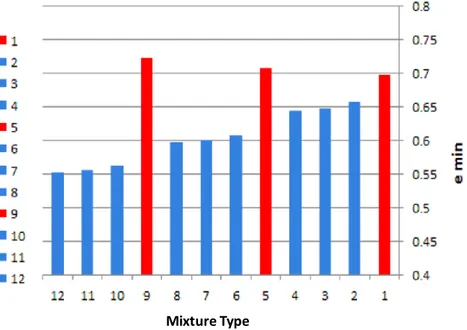
w is density of water at 20°C and Gs is specific gravity of soil. Incorporating the data provided in Figure 2 and Table 4 enables equation 2 to compute maximum and minimum void ratios in accordance with minimum and maximum dry densities as shown in Figure 4.Figure 4. Variations of maximum index void ratios for each mixture of tested specimens Figure 4, depicts the variation of minimum index void ratio of each mixture after specified terminology in Table 2. Accordingly, as can be seen in figure 4, In samples without zeolite (red columns) with the increase of lime content, minimum index void ratio is increasing and this trend only is prevailing in samples without zeolite. The reason for such a behavior is that adding lime separately without an adequate pozzolan in the mixture in the presence of water leads to flocculation of lime particles adjacent to water without proper adhering bonds and this consequently will influence the gradation and particle size distribution of parent soil. Whereas, lime in conjunction with zeolite shows promising performance as long as zeolite content is increasing minimum index void ratio decreases (blue columns) which it then leads to a higher maximum dry density while required moisture content for a better compaction is reduced because of concurrent less heat of hydration of zeolite and its subsequent constant rate of influence in extension of curing periods.
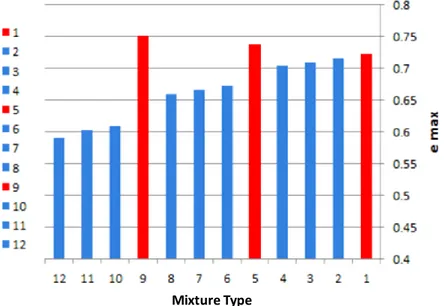
The results of maximum index void ratios of each mixture after specified terminology in Table 2 are shown in Figure 5, as it is demonstrated in Figure 5 in samples containing only lime with the increase of lime content, maximum index void ratio increases and minimum dry density decreases. But as the amount of zeolite content increases while lime content was kept constant, maximum index void ratio decreases and minimum dry density increases. The reason for this behavior is that without mature pozzolanic reactions and during early ages of mixing when the hydration process is predominantly undergone (Figure 2) zeolite particles do not participate in reactions as pozzolanic reactions are mainly time dependent reactions and they require a certain period of curing or setting time. Instead, zeolite acts as a fine filler and fills the void spaces among larger size aggregates during the early stages of backfilling and contributes to the artificial cementation due to pozzolanic reactions which occur in the following days of setting.
Figure 5. Variations of maximum index void ratios for each type of mixture of tested specimens
CONCLUSIONS
Addition of zeolite combined with lime to the engineering fills comprising of fine sands provides a unique means of modifying poorly graded soils’ grain size distribution by providing fine filler content, while zeolite as a natural pozzolan in conjunction with calcium hydroxide has the ability to induce artificial cementation too. In reference to the results obtained in this study, the following conclusions can be made on zeolite-lime stabilized fine sands:
1. Increase of zeolite content while lime content was kept constant led to increase by specific gravity of soil’s solid and consequently during proctor compaction, maximum dry density of each mixture increased. But with the increase of lime percentage, while zeolite content was kept constant, specific gravity of soil’s solid related to each mixture decreased. Which this is due to absorption of free water and subsequent flocculation of lime particles and creation of larger pores in the extent of mixing procedure and also setting period.
2. Simulation of hydration process indicated that at early stages of interaction between zeolite and lime particles, pozzolanic reaction was prevailed considerably by hydration of calcium hydroxide with alkali exchanged clinoptilolite and preliminary product of hydration is presence of new phases such as carbolaluminate hydrate groups.
3. When lime content was kept content while zeolite content increased, compacted soil showed higher maximum dry density while required compaction water decreased. In other words, zeolite has
the most influence deciding the compaction performance where addition of more zeolite is equal to a better compaction effort.
4. Result obtained in this study have shown that appropriate percentage of zeolite content is fixated at 12 percent and optimum lime content is 5 percent. Furthermore, with the increase of zeolite and lime content, maximum index void ratio decreased while minimum dry density decreased. Additionally, maximum dry density increases in result of reduction of minimum index void ratio.
5. In addition, Increase of lime content in mixtures containing lime only led to decrease of maximum dry density following by an increase in maximum and minimum index void ratios. The reason lies in flocculation of lime particles in contact with water which this then will create large pore voids. Results demonstrated that samples containing lime without zeolite showed higher maximum dry density while being mixed with 3 percent of lime.
ACKNOWLEDGMENTS
The author would like to thank Dr. M.S Pakbaz for his valuable comments and A.N.S. consulting engineers for providing testing equipment.
REFERENCES
Ahmadi, B., &Shekarchi, M. (2010). Use of natural Zeolite as a supplementary cementitious material. Cement and Concrete Composites, 32(2), 134-141.
da Silva, W. R. L., Šmilauer, V., &Štemberk, P. (2015). Upscaling semi-adiabatic measurements for simulating temperature evolution of mass concrete structures. Materials and Structures, 48(4), 1031-1041.
Jamhiri, B., &Parsaeimaram, M. (2019). Study on Integrated Liquefaction Hazard Mapping Developed by SPT, CPT, Downhole and LPI Index. Geological Behavior (GBR), 3(2), 6-14.
Jamhiri, B., Ebrahimi Fahadani, A., X, Yongfu.(2020). Investigating uncertainties in the source-site and the model-input within reliability-based deterministic and probabilistic liquefaction initiation analyses. Disaster Advances, 13(2), 55-62.
Jendele, L., Šmilauer, V., &Červenka, J. (2014). Multiscale hydro-thermo-mechanical model for early-age and mature concrete structures. Advances in Engineering Software, 72, 134-146.
Karakurt, C., &Topçu, İ. B. (2011). Effect of blended cements produced with natural Zeolite and industrial by-products on alkali-silica reaction and sulfate resistance of concrete. Construction and Building Materials, 25(4), 1789-1795.
Krolo, P. E. T. A. R., Krstulovic, R., Dabic, P., &Bubic, A. (2005). Hydration and leaching of the cement-zeolite composite. Ceramics- Silikaty, 49(3), 213-219.
Mertens, G., Snellings, R., Van Balen, K., Bicer-Simsir, B., Verlooy, P., &Elsen, J. (2009). Pozzolanic reactions of common natural Zeolites with lime and parameters affecting their reactivity. Cement and Concrete Research, 39(3), 233-240.
Najimi, M., Sobhani, J., Ahmadi, B., &Shekarchi, M. (2012). An experimental study on durability properties of concrete containing Zeolite as a highly reactive natural Pozzolan. Construction and Building Materials, 35, 1023-1033.
Snellings, R., Mertens, G., Cizer, Ö., &Elsen, J. (2010). Early age hydration and pozzolanic reaction in natural zeolite blended cements: Reaction kinetics and products by in situ synchrotron X-ray powder diffraction. Cement and Concrete Research, 40(12), 1704-1713
Snellings, R., Mertens, G., Hertsens, S., &Elsen, J. (2009). The Zeolite–lime Pozzolanic reaction: Reaction kinetics and products by in situ synchrotron X-ray powder diffraction. Microporous and mesoporous Materials, 126(1), 40-49.
Valipour, M., Pargar, F., Shekarchi, M., &Khani, S. (2013). Comparing a natural Pozzolan, Zeolite, to metakaolin and silica fume in terms of their effect on the durability characteristics of concrete: A laboratory study. Construction and Building Materials, 41, 879-888.
Varela, M. B., Ramírez, S. M., Ereña, I., Gener, M., & Carmona, P. (2006). Characterization and Pozzolanicity of zeolitic rocks from two Cuban deposits. Applied Clay Science, 33(2), 149-159.
Vogiatzis, D., Kantiranis, N., Filippidis, A., Tzamos, E., &Sikalidis, C. (2012). Hellenic Natural Zeolite as a replacement of sand in mortar: Mineralogy monitoring and evaluation of its influence on mechanical properties. Geosciences, 2(4), 298-307.
![Table 3. XRF experimental binder properties and estimated parameters by simulated affinity model setting parameter 0.08 C 3 S [-] 0.02 C 2 S [-] 0.03 C 3 A [-] 0.03 C 4 AF [-] 7800 BLAINE [m 2 /kg]](https://thumb-eu.123doks.com/thumbv2/9libnet/4970657.100585/6.892.279.740.149.937/experimental-properties-estimated-parameters-simulated-affinity-setting-parameter.webp)