DIGITALIZED YOUTH, KNOWLEDGE GAP, AND DIGITAL DIVIDE:
A STUDY ON YOUNGSTERS’ MEDIA USE FOR OBTAINING
DAILY NEWS
Serra İnci Çelebi* ABSTRACTSurvey was conducted to collect information on university students’ media consumption and habits. The result shows that the ones who use digital and broadcast media for col-lecting news and information have more experience of using the Internet. There is a sig-nificant difference between males and females both for media use and content consump-tion. Females more than males both tended to consume more more media and news con-tent of media. The age difference between the participants was another important factor played role in whether or not Internet users got information and news about entertain-ment. The results were discussed and interpreted within the framework of digital divide, knowledge gap, and the theory of uses and gratifications.
Keywords: Internet, digitalization, news, knowledge gap, digital divide, uses & gratifica-tions.
DİJİTAL GENÇLİK, BİLGİ AÇIĞI VE DİJİTAL UÇURUM:
GENÇLERİN GÜNDELİK HABER EDİNMELERİNDE MEDYA
KULLANIMI ÜZERİNE BİR ÇALIŞMA
ÖZET
Üniversite öğrencilerinin medya kullanım alışkanlıkları üzerine anket araştırması yapılmıştır. Araştırma sonucunda, bilgi ve haber edinmek için internet ve televizyonu sık kullananların internet kullanımında daha fazla deneyime sahip oldukları bulunmuştur. Medya kullanımında ve içeriğinin tüketiminde, kız ve erkek öğrenciler arasında fark olduğu ortaya çıkmıştır. Kızların erkeklere oranla, hem medyadan gündelik haber edin-mede çeşitli medyaları daha fazla kullandıkları ve hem de medyanın sunduğu çeşitli haber kategorilerini daha fazla tükettikleri görülmüştür. Katılımcılar arasındaki yaş farkı, onların internetten edindikleri haber ve enformasyonun eğlence alanında olup olmay-acağını etkileyen diğer önemli bir faktör olduğu görülmüştür. Sonuçlar, dijital uçurum, bilgi açığı ve kullanımlar ve doyumlar teorisi çerçevesinde tartışılmış ve yorumlanmıştır. Anahtar Kelimeler: İnternet, dijitalleşme, haber, bilgi açığı, dijital uçurum, kullanımlar & doyumlar.
INTRODUCTION
The free flow of information is very important for the public. First the newspa-per, then the radio came, which were followed by television, and now the
net has became the major source of information (Thorson 2008). It has been long ago, print and broadcast media questioned the future of news industries; the New York Times, for example, asked whether or not a print version will exist in ten years’ time (Ahlers 2006). “The tremendous growth of the Internet has at-tracted the attention of many scholars. They worry about the demise of tradi-tional mass media news under the threat of the Internet” (Ha and Fang 2012: 177).
“For the media to inform people, a prerequisite is that people pay attention to the news. Hence, the question of who the consumers of news has always been of in-terest to media scholars” (Shehata and Strömback 2011: 110). Callejo (2013) for example, examined the media consumption of young adults and adolescents in Spain and found that television viewing was the dominant form of media con-sumption. Shehata and Strömback’s (2011) research results displayed that news consumption is positively related with education, age, socioeconomic status, po-litical interest, knowledge, and involvement; the current study extends Shehata and Strömback’s research from the fact that it is also related to gender. Peng and Zhu (2010) compared individuals’ Internet and traditional media use in their studies and they found that Internet users’ time spent with traditional media is less compared to nonusers, while both groups’ social activities remain as the same.
Because of a need to understand the nature of the Internet better in the context of all available media according to news and information gathering, this study fo-cused on youngsters’ media preference. So, the aim of this study is to fill this gap by comparing five leading mass media in addition to family and friends. In order to accomplish this aim, media comparison questions of this study were employed from Parker and Plank’s (2000) article entitled as A Uses and Gratifications Per-spective on the Internet As a New Information Source. Parker and Plank asked a student sample to indicate their sources of consumer and community informa-tion on a check list. In the study, students were queried to indicate their sources of news and information by using a 5-point Likert scale, ranging from “Strongly Disagree” to “Strongly Agree” for using certain types of media in their daily lives. They were asked to evaluate certain types of media (e.g, family & friends, television, Internet) for different news purposes (e.g., news, weather, finance, health) and their levels for those reasons to use them.
Parker and Plank compared 7 sources of information (print, television, fam-ily/others, radio, online service, agency/organization, and phone) for 8 different reasons (news/weather, politics, health, entertainment, shopping, campus infor-mation, job inforinfor-mation, and consumer information) in their studies. This study extends Parker and Plank’s study and six sources of information (five leading media and family & friends) for fourteen different news purposes (e.g., news, health, weather, shopping information) were compared to learn participants’ media preferences.
CONCEPTUAL RATIONALE AND HYPOTHESES
THE THEORY OF USES AND GRATIFICATIONS (U&G)
Oxford dictionary defines gratification as “pleasure, especially when gained from the satisfaction of a desire” (“Gratification”, n.d.). Gaining gratification depends on what kind of activities a person prefers. It ranges from watching television, surfing on the Net, reading book to conversations with family members (Katz et al. 1973).
With the establishment of the U&G theory, the consideration of audiences shifted from passive audiences to active audiences. According to the U&G theory, peo-ple are not passive readers, listerners, or viewers; but, they do chooce certain media, its channel, content, or section in order to satisfy their needs (Lee and Ma 2012; Wang et al. 2012). The main questions asked in the U&G theory are “What people do with the media?, Why do they use certain media instead of others? Why do they view certain TV channels/contents?, Why do they read certain sec-tions of the magazines/newspapers? What gratificasec-tions do they gain by expos-ing themselves to certain media content?” (Wang et al. 2012).
Internet as a new technology has offered the U&G researchers a new medium to investigate. Soon after its entrance into peoples’ lives, the questions that have been asked for old media, started to be asked for Internet too: Why do people use Internet?, What do people do with it? and What gratifications do they obtain from it? (Kaye and Johnson 2004).
For the investigation of media choices, the U&G has been the most popular and therefore frequently applied theory (Yuan 2011). But, until 1980s, media studies were limited and “most gratifications research has focused on specific media con-tent or on the more general uses of a specific medium” (Elliot and Quattlebaum 1979: 61). Therefore, in the previous U&G studies in which several media (e.g., book, friends, magazines, and movies) compared to each other are rare (e.g., El-liot and Quattlebaum 1979). Based on the U&G theory, Internet as a new comer, offers its users many gratifications that are not supplied by the other media. One of these gratifications that is supplied by connecting to the Internet is ‘news and information gathering’. Dimmick, Chen, and Li, (2004) examined daily news do-main a decade ago and found that Internet has a competitive advantage and dis-placement effect for traditional media and in their study it largely displaced tele-vision and newspapers. Especially young adults (who are the sample of this study) may give emphasis to use both digital media (Internet) and broadcast me-dia (TV) to get daily news and information more than other types of meme-dia. Based on this reasoning the following hypothesis was proposed:
H1: Young adults use digital and broadcast media for collecting news and infor-mation more than other types of media.
People who tend to use television and Internet when compared to the general population, are also the heavy users of mobile media and social media (Chan-Olmsted et al. 2012). Similarly, people who are the early adopters and users of Internet may use Internet and television (digital and broadcast media) for news and information gathering more than other individuals. Based on this expecta-tion, the second hypothesis was formulated as below:
H2: Young adults who have more experience of using the Internet use digital & broadcast media to collect news and information more than other individuals. DIGITAL DIVIDE AND KNOWLEDGE GAP
Wei and Hindman (2011) write about digital divide in their article and recom-mend a new definition for it: digital divide is inequalities in the use of communi-cation and information technologies. In other words, digital divide is based on a difference between technological haves and have-nots. Inequities in the access to and use of digital technologies were focused and researched in the previous stud-ies; however, with the widespread use of the Internet and its popularity for in-formation and news gathering, some digital divide researchers have started to reconsider the notion of the digital divide and their focus shifted from material access to actual use (e.g., use of smartphones) (as cited in Wei and Hindman 2011).
Mobile news adoption is spread especially among young adults due to the per-ception of its relative advantage and ease of use (Chan-Olmsted et al. 2012). Yet, there are few studies that compared new and old media use in terms of digital divide and knowledge gain (e.g., gathering daily news and information on dif-ferent subject categories). One of those few studies comparing new and old me-dia is based on the comparison of MP3 players to traditional radio for music lis-tening habits. Because new technologies are the greatest threat to traditional use of radio, uses and gratifications of MP3 players of undergraduate students ages between 18-24 were examined. In their studies, the majority of participants pre-ferred MP3 players over traditional radio as a listening source and traditional use of radio is particularly preferred while driving cars as a source of news and in-formation (Albarran et al. 2006).
Although, it is a debate among scholars, it is common sense that there is a usage and knowledge gap between people who use digital technologies for information and news gathering and those who do not. These do-not ones belong to the group using technology largely for entertainment. So, using the Internet as a toy or as a tool makes a big difference on the the user’s way of living (Wei and Hindman 2011). The same communication tool (e.g., smartphones) may be per-ceived by males and females in different ways and used for different purposes (e.g., collecting different types of news). Finding gender nuances for media us-age, information consumption, and technology use helps organizations to create suitable communications environments (Gefen and Straub 1997). Similarly,
find-ing the popularity of news subjects conveyed by the media helps the purpose of the media organizations for cooperating with the right advertisers on finding the right commercial context. For the exception of radio in Hypotehsis 4, see Albarran et al (2006) for the reasoning.
H3: There is a significant difference between young females and males about using their smartphones for Internet connection.
H4: There is a significant difference between young females and males for media consumption (except radio) to get daily information and news.
H5: There is a significant difference between young females and males to get in-formation and news from different subject categories.
METHODOLOGY Instrumentation
Closed-ended questions were used to gather demographic information. Media comparison questions consisted of a 5-point Likert scale questions “Strongly Dis-agree” to “Strongly Agree” and asked participants to indicate their agreement levels of using certain media in their daily lives to access information and news about many subjects. If the participants didn’t use the specific medium in their daily activities, they were asked to indicate “0” for that medium.
Population, Sample and Contact method
Cluster sampling was employed to draw the sample from the population. The survey was conducted in 13 different UFND course classes at a private university in Western Turkey. UFND (Univeristy Foundation) Courses are compulsory courses that every single student has to take in order to graduate from the Uni-versity. From the pool of 57 UFND classes, 13 UFND classes were randomly picked and visited one by one. During 3 weeks’ time, 184 questionnaires were collected. The final sample size of this research is 166, as 18 questionnaires were not in usable format.
Dependent and Independent Variables
Independent variables: Using five leading media and family & friends for four-teen different reasons to get information and news.
Dependent variables: The year of using the Internet, the frequency of using the Internet, and the hours of using the Internet.
APPLIED STATISTICS
Frequencies, one-way ANOVA, and factor analysis were used for interpreting the results of study-1. The findings were significant at p≤ 0.05 level. For data analysis, SPSS statistical package was employed.
Validity
The validity of six types of media were assessed by maximum likelihood in factor analysis and four factors (radio, family & friends, television & Internet, maga-zine, and newspaper) were valid.
Reliability
Cronbach alpha of this study can be seen on the Table 1. Table 1. Reliability Results for Items
Items Cronbach alpha
Radio .943
Family & friends .906
Digital & Boradcast .902 Newspaper & Magazine .922 RESULTS
Descriptive Results
Demographic Background
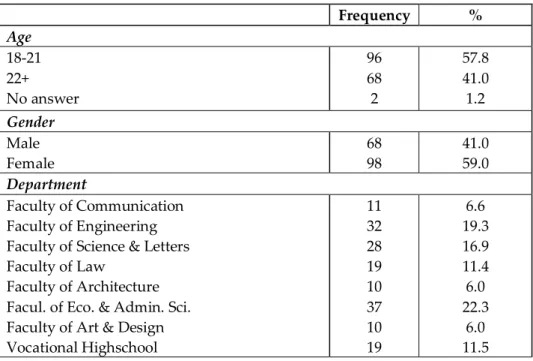
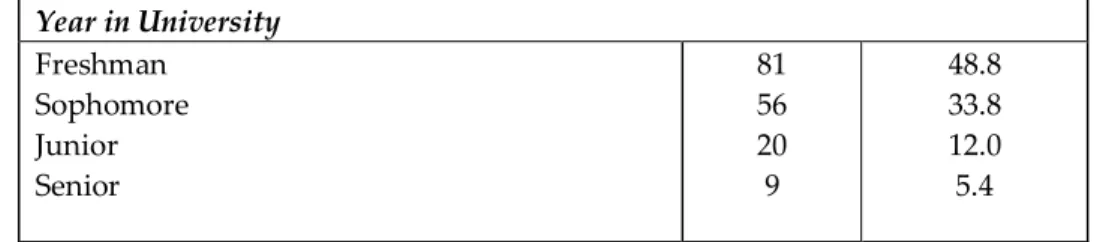
More than half of the respondents were between 18 to 21 years old (57.8%). Fe-males (59%) were more than Fe-males (41%). Since the probability sampling was used, the students were representing all the departments (seven faculties and one vocational high school) of Yasar University. The participation was higher from the Faculty of Economics and Administartive Science (22.3%) and less from the Faculty of Architecture (6%) and Faculty of Art and Design (6%). Freshmen were almost half of the respondents (48.8%).
Table 2. Demographic Profile of Respondents
Frequency % Age 18-21 22+ No answer 96 68 2 57.8 41.0 1.2 Gender Male Female 68 98 41.0 59.0 Department Faculty of Communication Faculty of Engineering Faculty of Science & Letters Faculty of Law Faculty of Architecture Facul. of Eco. & Admin. Sci. Faculty of Art & Design
Vocational Highschool 11 32 28 19 10 37 10 19 6.6 19.3 16.9 11.4 6.0 22.3 6.0 11.5
Year in University Freshman Sophomore Junior Senior 81 56 20 9 48.8 33.8 12.0 5.4 Note: N=166 Internet Background
The majority of the participants were using the Internet for more than 6 years (83.7%). Daily Internet users were 91.6%. The majority (35.6%) spent between 1 to 5 hours a day and almost a quarter of them (23.6%) use it more than 5 hours a day. More than three quarters (83.7%) use Internet at home and almost three quarters (71.7%) connect to the Internet by using their laptops or computers.
Table 3. Internet Use of Respondents
Frequency % Experience of Internet Use
0-1 year 2-3 year 4-5 year 6+ year 1 1 25 139 0.6 0.6 15.1 83.7 Frequency of Internet Use
Daily 3-4 times a week 2 times a week 152 12 2 91.6 7.2 1.2 Hours of Internet Use
5+ hours a day 3-5 hours a day 1-3 hours a day 1 hour a day 1-2 hours a week 39 56 53 15 3 23.6 33.7 31.9 9.0 1.8 Place for Internet Connection
Home University Hostel Other 139 2 2 23 83.7 1.2 1.2 13.9 Media for Internet Connection
Laptop/computer Tablet computer Smartphone Other 119 2 27 18 71.7 1.2 16.3 10.8 Note: N=166
FACTOR ANALYSIS RESULTS
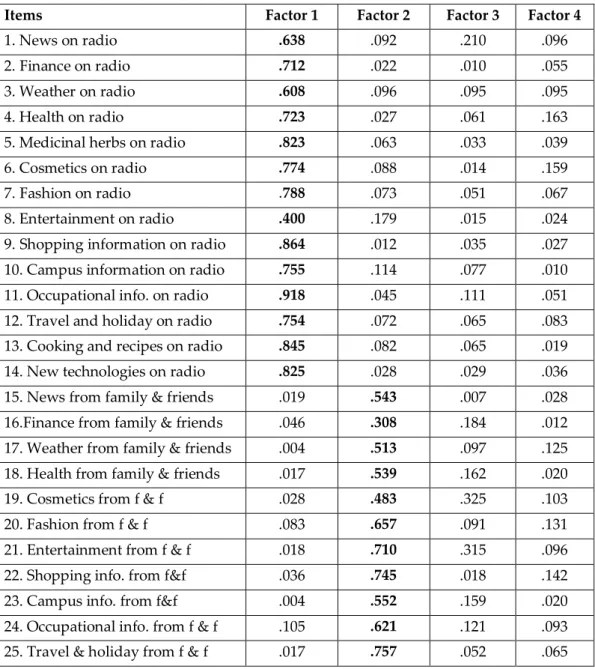
Maximum likelihood was conducted and instead of 6 types of media, 4 types of media was found. TV and Internet merged together which showed that the par-ticipants percieved them together as ‘digital and broadcast media’. In addition to this, participants merged newspapers and magazines which also showed that they percieved them together as the ‘written media’. Therefore, in this study, the terminology of ‘written media’ will be used instead of newspapers and maga-zines; and ‘digital & broadcast media’ will be used to refer television and Inter-net. Radio had factor loadings of forteen items, family & friends had thirteen, digital & broadcast media had twenty, and finally the written media had twenty three items for factor loading which can be seen in Table 4.
Table 4. Media Use Factor Analysis
Items Factor 1 Factor 2 Factor 3 Factor 4
1. News on radio .638 .092 .210 .096
2. Finance on radio .712 .022 .010 .055
3. Weather on radio .608 .096 .095 .095
4. Health on radio .723 .027 .061 .163
5. Medicinal herbs on radio .823 .063 .033 .039
6. Cosmetics on radio .774 .088 .014 .159
7. Fashion on radio .788 .073 .051 .067
8. Entertainment on radio .400 .179 .015 .024
9. Shopping information on radio .864 .012 .035 .027 10. Campus information on radio .755 .114 .077 .010 11. Occupational info. on radio .918 .045 .111 .051 12. Travel and holiday on radio .754 .072 .065 .083 13. Cooking and recipes on radio .845 .082 .065 .019 14. New technologies on radio .825 .028 .029 .036 15. News from family & friends .019 .543 .007 .028 16.Finance from family & friends .046 .308 .184 .012 17. Weather from family & friends .004 .513 .097 .125 18. Health from family & friends .017 .539 .162 .020 19. Cosmetics from f & f .028 .483 .325 .103
20. Fashion from f & f .083 .657 .091 .131
21. Entertainment from f & f .018 .710 .315 .096 22. Shopping info. from f&f .036 .745 .018 .142 23. Campus info. from f&f .004 .552 .159 .020 24. Occupational info. from f & f .105 .621 .121 .093 25. Travel & holiday from f & f .017 .757 .052 .065
26. Cooking & recipes from f & f .004 .538 .157 .162 27. New technologies from f & f .124 .652 .015 .005
28. Finance on TV .212 .072 .372 .070 29. Health on TV .115 .016 .459 .216 30. Medicinal herbs on TV .216 .099 .604 .132 31. Cosmetics on TV .215 .001 .594 .162 32. Fashion on TV .035 .076 .501 .282 33. Shopping information on TV .150 .100 .399 .285 34. Travel and holiday on TV .245 .119 .356 .147 35. Cooking and recipes on TV .146 .050 .377 .296
36. Finance on Internet .021 .034 .406 .034
37. Weather on Internet .049 .093 .314 .096
38. Health on Internet .009 .012 .551 .004
39. Medicinal herbs on Internet .032 .047 .691 .024
40. Cosmetics on Internet .019 .122 .671 .018
41. Fashion on Internet .101 .019 .692 .085
42. Shopping info. on Internet .096 .064 .572 .044 43. Campus info. on Internet .048 .087 .589 .064 44. Occupational info. on Internet .005 .055 .612 .010 45. Travel & holiday on Internet .082 .114 .581 .090 46. Cooking & recipes on Internet .069 .040 .662 .131 47. New Technologies on Internet .030 .191 .373 .102
48. News in newspaper .010 .076 .039 .390 49. Weather in newspaper .225 .116 .161 .421 50. Health in newspaper .035 .051 .225 .559 51. Cosmetics in newspaper .153 .083 .212 .556 52. Fashion in newspaper .128 .002 .162 .601 53. Entertainment in newspaper .145 .116 .175 .524 54. Shopping info. in newspaper .051 .003 .033 .713 55. Occupational info. in newsp. .203 .020 .195 .320 56. Travel & holiday in newspaper .112 .022 .249 .374 57. New Technologies in newsp. .133 .041 .042 .539
58. News in magazine .123 .185 .004 .378
59. Finance in magazine .246 .063 .066 .342
60. Health in magazine .199 .115 .068 .459
61. Medicinal herbs in magazine .235 .003 .211 .326
62. Cosmetics in magazine .140 .274 .005 .623
63. Fashion in magazine .204 .258 .072 .616
64. Entertainment in magazine .070 .367 .214 .623 65. Shopping info. in magazine .068 .166 .070 .522 66. Campus info. in magazine .072 .054 .271 .489 67. Occupational info. in magaz. .124 .289 .073 .359 68. Travel & holiday in magaz. .145 .337 .084 .452 69. Cooking & recipes in magaz. .066 .245 .003 .536
Bold indicates a significant factor loading identifying the item and factor associ-ated with it. All items shared a common prompt: “Indicate how much you agree with each option by marking the appropriate response, If you use the medium for the specified purpose” and were measured with a 5-point Likert-scale ranging from ‘Strongly Disagree’ to ‘Strongly Agree’. If you don’t use the medium for the specified purpose, please mark 0”.
RESULTS FOR HYPOTHESES
H1 proposes that young adults use digital and broadcast media for collecting news and information more than other types of media. ANOVA results revealed that digital and broadcast media (M=3.56, SD=.97) was found to be the most used medium to get daily news and information than radio (M=1.09, SD=1.08), family & friends (M=2.86, SD=1.19), and newspapers & magazines (M=2.27, SD=1.05); confirming the first hypothesis.
H2 states that young adults who have more experience of using the Internet use digital & broadcast media to collect news and information more than other indi-viduals. ANOVA result was significant between experience of using digital and broadcast media and Internet usage for gathering information and news F (3, 158)=4.349, p=.006. It was not significant for radio F (3, 160)=.642, p=.589, family and friends F (3, 154)=1.157, p=.328, and newspapers and magazines F (3, 158)=1.125, p=.341. The participants who had more experience using the Internet (for 6+ years of Internet experience: M=3.61; SD=.96) used digital and broadcast media to gather news and information more than other participants (for 4-5 years of Internet experience M=3.46; SD=.78). H2 was confirmed.
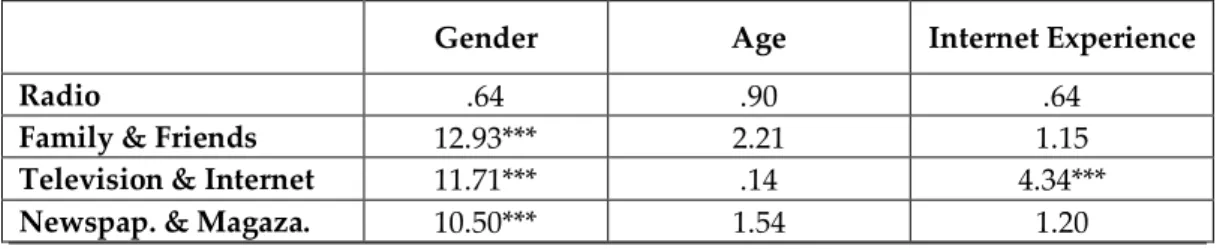
Table 5. One-way ANOVA Results for Hypotheses
Gender Age Internet Experience
Radio .64 .90 .64
Family & Friends 12.93*** 2.21 1.15
Television & Internet 11.71*** .14 4.34***
Newspap. & Magaza. 10.50*** 1.54 1.20
* p≤0.05; ** p≤0.01; *** p≤0.001
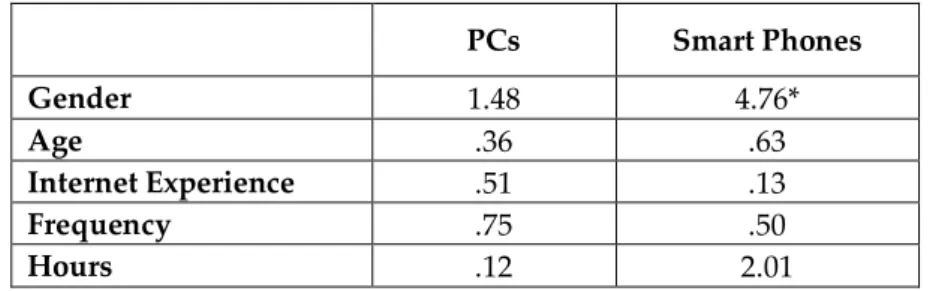
H3 proposes that there is a significant difference between young females and males about using their smartphones for Internet connection. For connecting to the Internet, smartphone usage was significant with gender F(1, 164)=4.76, p=.031. Females (55.4%) more than males (44.6%) used Internet on their smart-phones, confirming the third hypothesis.
Table 6. One-way ANOVA Results for Using the Internet on PCs and Smart Phones PCs Smart Phones Gender 1.48 4.76* Age .36 .63 Internet Experience .51 .13 Frequency .75 .50 Hours .12 2.01 *p≤0.05;** p≤0.01; *** p≤0.001
H4 proposes that there is a significant difference between young females and males for media consumption (except radio) to get daily information and news. ANOVA results were significant between gender and getting information from family & friends, TV & Internet, and newspapers & magazines (see Table 5 for significance); and as it was expected, it was not significant for radio (see Albarran et al, 2006). Females more than males tended to get daily news and information from family & friends [(Females: M=3.13, SD=1.01) vs. (Males: M=2.47, SD=1.32)], digital and broadcast media [(Females: M=3.78, SD=.71) vs. (Males: M=3.26, SD=1.18)], and written media [(Females: M=2.49, SD=.97) vs. (Males: M=1.97, SD=1.08)]. H4 was confirmed.
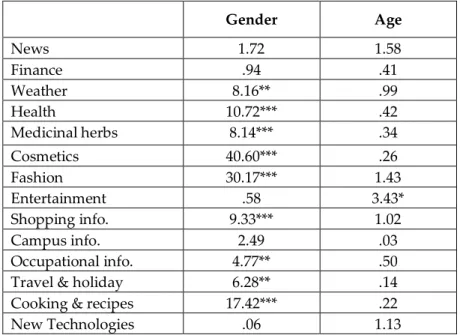
H5 proposes that there is a significant difference between young females and males to get information and news from different subject categories. ANOVA results showed that nine subject categories for getting news were significant in terms of gender; and females were getting more information and news than males about all of those categories which are weather [(Females: M=2.92, SD=.87) vs. (Males: M=2.50, SD=1.00)], health [(Females: M=2.76, SD=.90) vs. (Males: M=2.24, SD=1.11)], medicinal herbs [(Females: M=2.16, SD=1.13) vs. (Males: M=1.62, SD=1.29)], cosmetics [(Females: M=2.85, SD=.88) vs. (Males: M=1.79, SD=1.24)], fashion [(Females: M=2.95, SD=.83) vs. (Males: M=2.07, SD=1.24)], shopping information [(Females: M=2.81, SD=.85) vs. (Males: M=2.33, SD=1.17)], occupation information [(Females: M=2.72, SD=.94) vs. (Males: M=2.35, SD=1.19)], travel & holiday [(Females: M=2.95, SD=.91) vs. (Males: M=2.55, SD=1.11)], and cooking & recipes [(Females: M=2.77, SD=.97) vs. (Males: M=2.03, SD=1.28)], con-firming the last hypothesis.
Slight age difference of the participants was significant for getting information about the subject of entertainment [F (2, 163)=3.43, p=.034]. 18-21 years old par-ticipants (M=2.82, SD=1.20) were interested in and tended to get more informa-tion and news about entertainment from media than 22+ years old participants (M=2.34, SD=1.08).
Table 7. One-way ANOVA Results for the Popularity of News & Information According to Gender and Age
Gender Age News 1.72 1.58 Finance .94 .41 Weather 8.16** .99 Health 10.72*** .42 Medicinal herbs 8.14*** .34 Cosmetics 40.60*** .26 Fashion 30.17*** 1.43 Entertainment .58 3.43* Shopping info. 9.33*** 1.02 Campus info. 2.49 .03 Occupational info. 4.77** .50
Travel & holiday 6.28** .14
Cooking & recipes 17.42*** .22
New Technologies .06 1.13
p≤0.05; ** p≤0.01; *** p≤0.001
CONCLUSIONS, DISCUSSIONS AND RECOMMENDATIONS
For the technological haves and have-nots, the investigation of digital divide is one of the subjects of this study and an inequality was found between male and female consumers. As, Wei and Hindman (2011) suggest that examining users’ actual use is important; therefore, in the current study, actual new and old media use were compared to each other and gender difference was foud. It is seen that although, youngsters in general connect to the Internet on their PCs more than smartphones, when males and females compared within smartphone usage, fe-males tended to connect to the Internet via smartphones more than fe-males which is a prominent result of this study. The Web sites of both Turkish and global en-terprizes that sell to young females at certain ages should be more compatible with smartphones. Many companies have realized this and created mobile ver-sions of their Web sites, however, in addition to the mobile verver-sions of these Web sites, the creation of the full version of their sites, which respond better to the needs of the younger females, will make a change and put the company ahead of the rest in this competition. The result supports Gefen and Straub’s (1997) sug-gestion on the creation of such communication environments which is not lim-ited with the deployment of communication media, but also includes organiza-tional training on communication media.
Use and knowledge gap between people who use digital technologies for infor-mation and news gathering and those who use it for mainly entertainment pur-poses is another discussed area in digital divide literature. Slight age difference of the participants was found to be curical whether or not they get news and
in-formation about entertainment. 18-21 years old participants tended to get more information and news about entertainment from both new and old media when they were compared to their peers whose ages were 22+ years old. This finding supports what is written on digital technology and using the Internet as a toy or as a tool (Wei & Hindman, 2011). For younger generations, the use of new media (in addition to old media) may be as if they play with a toy (e.g., playing atari in a game center); while for older generations its use means more than that. Older individuals’ primary use of new media may be based on personal development (e.g., finding information on Net), while corporations’ main usage is strategic communication with its target public.
In the context of the new media, U&G theory was included to explore the media habits of university students. Parker and Plank’s (2000) study revealed the rise of the Internet for source of information, while showing still the reliance on print media. In this study, however, students were seemed to abandon traditional me-dia (except TV) for the sake of digitalization. The participants may be using tele-vision and computer simultaneously or watching TV programs on their PCs and smarphones, and therefore as a result of factor analysis, Internet and television fell into one category which is called as ‘digital and broadcast media’. It is men-tioned by Dimmick, Chen, and Li, (2004), in light of the U&G, digital media (with broadcast media for this study) develop, compete, and are successful to provide utility or gratification to consumers, especially for young consumers. The results confirm Dimmick, Chen, and Li’s results (with the exception that Internet re-places television) in a way that Internet has a competitive advantage over old media namely radio, newspaper, and magazines for news and information gath-ering.
Diverse area of news subjects which would be of interest to both males and fe-males were included in this study; however, fefe-males more than fe-males tended to consume media and more news content of media. This result should be taken into consideration by advertisers while placing their advertisements. The result of this study is the extension of Shehata and Strömback’s (2011) research with regard to gender; while their study results showed that media consumption was highly correlated with other variables including age, education, political interest, and involvement.
The main limitation of the current study is that although Internet usage (e.g., year, duration, frequency) of participants was asked by using close-ended ques-tions, it is lacking in asking the usage of other types of media (e.g., television, newspapers and so on).
REFERENCES
Ahlers D (2006) News consumption and the new electronic media. Press/Politics, 11 (1), 29-52.
Albarran A B, Anderson T, Bejar L G, Busart A L, Daggett E, Gibson S, Gorman M., Greer D, Guo M., Horst J L, Khalaf T, Lay J P, McCracken M, Mott B and Way H. (2006, September 28-29). What Happened to our Audience? Radio and new technology Uses and Gratifications Among Young Adult User, Consuming Au-diences Conference, Denmark, Copenhagen.
Callejo J (2013) Media time use Among Adolescents And Young Adults: Analysis Of Differences, Communication & Society/ Comunicación y Sociedad, 26 (2), 1-26. Chan-Olmsted S, Rim H and Zerba A (2012) Mobile News Adoption Among Young Adults: Examining The Roles Of Perceptions, News Consumption, and Media Usage, Journalism & Mass Communication Quarterly, 90 (1), 126-147. DOI: 10.1177/1077699 012468742
Dimmick J, Chen Y and Li Z (2004) Competition Between The Internet And Tra-ditional News Media: The Gratification-Opportunities Niche Dimension, Journal of Media Economics, 17 (1), 19-33, DOI: 10.1207/s15327736me1701_2
Eliot W R and Quattlebaum C P (1979) Similarities In Patterns Of Media Use: A Cluster Analysis of Media Gratifications, The Western Journal of Speech Com-munication, 43, 61-72.
Gefen D and Straub D (1997) Gender Difference In The Perception and Use Of E-Mail: An Extension to the Technology Acceptance Model, MIS Quarterly, 21 (4), 389-400.
Gratification (n.d.) Retrieved January 8, 2013, from
http://oxforddictionar-ies.com/ definition/ english/gratification ?q= gratification
Ha L and Fang L (2012) Internet Experience and Time Displacement of Tradi-tional News Media Use: An Application of The Theory of The Niche, Telematics and Informatics, 29, 177–186.
Katz E, Blumer J G and Gurevitch M (1973) Uses and Gratifications Research, Public Opinion Quarterly, 37 (4), 509-523.
Kaye B K and Johnson T J (2004) A Web for all reasons: Uses and Gratifications of Internet Components For Political Information, Telematics and Informatics, 21, 197-223.
Lee C S and Ma L (2012) News Sharing In Social Media: The Effect of Gratifica-tions And Prior Experience, Computers in Human Behavior, 28, 331-339.
Parker B J and Plank E E (2000) A Uses and Gratifications Perspective on the Internet as a New Information Source. American Business Review, 18 (2), 43-49. Peng T-Q and Zhu J J H (2010). A Game of Win–Win or Win– Lose? Revisiting The Internet’s Influence On Sociability and Use of Traditional Media, New Media and Society, 1-19, DOI: 10.1177/1461444810375976
Shehata A and Strömback J (2011) A Amtter of Context: A Comparative Study Of Media Environments and News Consumption Gaps In Europe, Political Com-munication, 28, 110–134, DOI: 10.1080/10584609.2010.543006
Thorson E (2008) Changing Patterns of News Consumption and Participation, Information, Communication & Society, 11 (4), 473-489.
Wang Z, Tchernev J M and Solloway T (2012) A Dynamic Longitudinal Examina-tion of Social Media Use, Needs, and GratificaExamina-tions Among College Students, Computers in Human Behavior, 28, 1829-1839.
Wei L and Hindman D B (2011) Does the Digital Divide Matter More? Compar-ing The Effects of New Media and Old Media Use On The Education-Based Knowledge Gap, Mass Communication & Society, 14, 2, 216-235, DOI: 10.1080/15205431003642707
Yuan E (2011) News Consumption Across Multiple Media Platforms, Informa-tion, Communication & Society, 14 (7), 998-1016.