ISSN: 2146-4138 www.econjournals.com
457
Co-movement of Foreign Direct and Portfolio Investments in Central and
Eastern Europe
Yaman O. ErzurumluDepartment of Engineering Management, Bahcesehir University, Besiktas, Istanbul 34349, Turkey.
Email: [email protected]
Giray Gozgor (Corresponding Author)
Department of Economics & Finance, Dogus University Kadikoy, Istanbul 34722, Turkey.
Phone: +90-216-444-79-97 Fax: +90-216-544-55-24 Email: [email protected]
ABSTRACT: This paper empirically examines short- and long-run relationships between foreign direct investments (FDI) and volatility of foreign portfolio investments (FPI) in 12 Central and Eastern European (CEE) countries. We use the Generalized Autoregressive Conditional Heteroskedasticity models to calculate volatility of the FPIs. We utilize the second generation panel unit root test, panel-Wald causality test procedure and panel cointegration analysis allowing for structural breaks, and cross-sectional dependence. The results strongly suggest that a decrease in FPI volatility is followed by an increase in FDI in the long-run, and this indicates economies that advance in capital liberalization benefit from increases in FDI. However, the relationship in opposite direction in the long-run is valid in only half of the countries studied. In short-run, we observe that the former relationship is valid only in Turkey, the Czech Republic, and Lithuania; where the latter is valid only in Latvia.
Keywords: Central and Eastern European economies; foreign direct investment; foreign portfolio investment; volatility models; panel data estimation techniques
JEL Classifications: C50; F21; F32
1. Introduction
Capital inflows to developing economies present a pro-cyclical nature and sustainable fund inflows to a developing economy could generate positive effects on the welfare. In general, there are three major types of capital inflows to a developing economy: Borrowing from surplus units, foreign direct investment (henceforth FDI), and foreign portfolio investment (henceforth FPI) inflows. These three types of inflows are interconnected and among them, borrowing is considered to be “the least preferred” by policy-makers (Reinhardt and Rogoff, 2009: 31).
This paper investigates the interrelationship between other two types of fund inflows: FDI and FPI in 12 Central and Eastern European (CEE) economies in unbalanced panel data framework. Growing FDI and FPI inflows to the region has been one of the main economic factors during transition process over the last two decades. Therefore, CEE economies provide valuable environment to study interrelation between FDI and FPI during financial liberalization, due to their geographical, political, and economic similarities. There are two different views in literature on the potential bi-directional relationship between FDI and FPI inflows to a developing economy. The “classical view” suggests that FPI is followed by FDI and the “alternative view” indicates the opposite. Hence, the literature is still inconclusive on the direction of the relationship. This study empirically examines which of the two hypotheses dominates the relationship between FDI and FPI volatility in CEE countries. We intend to test the validity of these two different views and provide empirical evidence that could be valuable for the policy-makers and studies on covered countries’ economies.
458 Our results should be read as a preliminary research of the magnitude and nature of the relationship between FDI and FPI accounting for the differences in their structures using an econometric model that allows the cross-sectional dependence of these potentially integrated economies and the introduction of structural breaks. The contributions of the study are as follows. First, considering well-documented permanent nature of FDI and temporary nature of FPI, comparative studies that take both variables at level values could be potentially misleading. Rather, we focus on FDI at level and volatility of FPI. By doing so, we attempt to capture whether change in FDI is related to the magnitude of FPI. Second, this study attempts to overcome econometric shortcomings implementing contemporary developments in panel data modeling. This is the first study that uses both the second generation panel unit root (PUR) test allowing for cross-sectional dependence among CEE economies and the panel cointegration setting allowing for structural breaks which are crucial for studying these economies under financial liberalization. This is utmost important in overcoming shortcomings of the first generation PUR test that is used in previous studies by default. Finally, to the best of our knowledge, this is the first studies that attempt to systematically examine the order of FDI and FPI in CEE countries both in the short and long-run.
The remainder of the paper is organized as follows. Section 2 briefly reviews the literature on the permanent structure of FDI and the temporary structure of FPI. Section 3 explains the data, the econometric methodology, and the empirical model. Section 4 represents the results of preliminary tests and panel data estimations, and discusses the empirical findings. Section 5 concludes.
2. Literature Review
There are two alternative scenarios in the literature: “classical view”, where FPI leads FDI; and “alternative approach”, where FDI leads FPI. The literature is still inconclusive on the direction of the relation. The “classical view” suggests that FPI enters economy at former stage and if it maintains certain level of consistency (the volatility of FPI remains relatively low), it contributes to the stabilization of the host economy. Improvement in stabilization attracts FDI at latter stage. Thus, a developing economy with certain level of economic and financial openness will attract stable (less volatile) FPI and will later attract FDI with its “stabilized” nature (Reinhart and Rogoff, 2009: 32). The “alternative approach” suggests that FDI enters an economy at first and contributes to the stability of the economic environment, enhancing more suitable economic environment for the entry of FPI. Moreover, since stability provided by FDI at the former stage is considered relatively more concrete, compared to the case where FPI followed by FDI, the volatility of FPI at the latter stage is expected to be less. In other words, entering FPI would have more permanent nature and exiting funds could be (Goldstein and Razin, 2006).
It is widely argued that the information based trade-off between FDI and FPI lies at the heart of the relationship and information based trade-off theory rather supports the “classical approach”. For instance, Van Nieuwerburgh and Veldkamp (2009) model that foreign portfolio investors tend to allocate their funds to markets which they have initial informational advantage and information differences would produce large and long-lasting cross-country differences in portfolio allocations. Size and uncertainty of the destination country’s capital market contribute to this behavior. FDI investment contributes to this informational advantage. Foreign direct investor obtains both the ownership and the control of the domestic firm; whereas foreign portfolio investor’s gain is limited to the ownership (Goldstein and Razin, 2006). This enables foreign direct investors to obtain refined information about the firm. They become more informed about the prospects and fundamentals of their projects, compared to the portfolio investors. As a result, foreign direct investors gain an informational advantage, compared to the foreign portfolio investors (Goldstein and Razin, 2006). Foreign portfolio investors are particularly more susceptible to these kind of informational problems (Sula and Willett, 2009), and open to cause irrational herding behavior in financial markets (Calvo and Mendoza, 2000). For instance, mutual fund managers show similar patterns in their trading behavior and tend to invest or leave a market at the same time (Haley, 2001). In similar, Andrade and Chhaochharia (2010) document that the United States (US) portfolio investors increase their holdings in G6 (G7 except Italy) countries in which there was more US originated FDI. The relationship remains unchanged after controlling for recent stock market performance.
This asymmetric information also affects the signals given in case of an exit. For instance, Albuquerque (2003) suggests that FDI overcomes imperfect enforcement mechanism providing a risk
459 sharing form of investment. However, if a foreign direct investor chooses to liquidate his/her firm for a reason potential buyer would undervalue the firm assuming that foreign direct investor has an informational advantage (Goldstein and Razin, 2006). Due to asymmetric information between the owner and potential buyers, foreign direct investor could have a low resale price (higher exit cost) and difficulty of reselling the firm since it signals potential problem to the potential investors.
3. Data, Model, and Econometric Methodology
3.1. Data
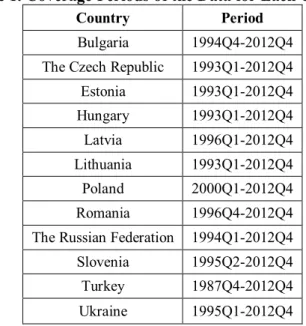
We obtain FDI and FPI data for CEE countries from the International Financial Statistics (IFS) database of the International Monetary Fund (IMF). FDI is the amount of the “foreign direct investment in reporting country” and FPI is the “portfolio investment liabilities in home country” in USD. We focus on 12 CEE countries: Bulgaria, the Czech Republic, Estonia, Hungary, Latvia, Lithuania, Poland, Romania, the Russian Federation, Slovenia, Turkey, and Ukraine. We could not include Croatia, Serbia, and Slovakia, due to large gaps in their data. The coverage periods of data for each country are presented in Table 1.
Table 1. Coverage Periods of the Data for Each Country
Country Period
Bulgaria 1994Q4-2012Q4 The Czech Republic 1993Q1-2012Q4 Estonia 1993Q1-2012Q4 Hungary 1993Q1-2012Q4 Latvia 1996Q1-2012Q4 Lithuania 1993Q1-2012Q4 Poland 2000Q1-2012Q4 Romania 1996Q4-2012Q4 The Russian Federation 1994Q1-2012Q4 Slovenia 1995Q2-2012Q4 Turkey 1987Q4-2012Q4 Ukraine 1995Q1-2012Q4
3.2. Volatility Model and Preliminary Tests
We calculate volatility values of FPI using the Generalized Autoregressive Conditional Heteroskedasticity (GARCH) (p,q) models. Main reason for using GARCH (p,q) model is that it responds more quickly to the shocks than alternative volatility models (Bollerslev, 1986). Moreover, theory documents that volatility of FPI is not subject to leverage or threshold effect. Therefore, implying GARCH (p,q) models to obtain volatility values of FPI would be adequate. Before GARCH (p,q) estimations, we investigate ARCH effects and determine appropriate AR(p) and MA(q) specifications based on the Akaike Information Criteria (AIC). We find that ARCH effects exist for all FPI series.
Next, we analyze possible presence of autocorrelation in GARCH (p,q) models for the FPI series. We select the maximum number of lag as 15 for the autocorrelation analysis; as suggested by Engle (2001). We also apply the appropriate ARCH test statistics to investigate remaining ARCH effect in selected lag of the variance equation. The results indicate that variance equations for all FPI series are correctly specified. Finally, we determine the best fitting GARCH (p,q) models using the AIC. 1
3.3. Cross-sectional Dependence and Second Generation Panel Unit Root Tests
We conduct panel unit root (PUR) tests to examine whether the series are stationary or not. However, the literature has recently criticized the reliability of the “first generation” PUR tests that
1
The results for the parameters of GARCH (p,q) models, the required assumptions in the GARCH estimations, and the GARCH (p,q) models for volatility values of FPI are available upon request.
460 assume cross-sectional independence of both heterogeneous and homogenous unit roots by default. Therefore, first generation homogeneous PUR tests are subject to suffer from bias and relative low power, and they are not completely reliable. In order to avoid shortcomings of the first generation PUR tests, we initially perform a formal test of cross-sectional dependence of Pesaran (2004) to determine whether the second generation PUR tests are necessary. Pesaran (2004) proposes the test statistic, known as the CD as an alternative of the LM statistic. This test also offers robust procedure for small samples and presence of structural-break(s), which is crucial for the size and structure of the data set we work.
Following the results of the CD test of Pesaran (2004), we use Pesaran (2007)’s second generation PUR test. He proposes the PUR test for panel with N cross-section and T time series data and suggests that the cross-sectionally Augment test equation as the cross-sectional averages of the first differences and the lagged levels of variable. Thus he accounts for the cross-sectional dependence in the common factor.
3.4 Empirical Model and Panel Data Estimation Techniques
Our empirical models are defined as follows:
1 1
m m
it jt it j jt it j it
j j
FDI c
FDI
FPIVOL u
(1) 1 1m m it jt it j jt it j it j j
FPIVOL
c
FPIVOL
FDI
u
(2)where FDIit is foreign direct investment and FPIVOLit is volatility values of foreign portfolio
investment. Model in equation (1) represents the classical view and model in equation (2) represents the alternative view.
Following the results of PUR tests, we use panel cointegration tests in order to determine whether the long-run relationship exists between FDI and volatility of FPI in 12 CEE economies. Common cointegration tests do not allow structural breaks in series. In order to alleviate this problem, we apply panel cointegration test of Westerlund (2007) that allows for multiple structural shifts in series. Following the results of the Westerlund’s test, we employ the Panel-Wald causality analysis.
In addition, we examine possible short-run dynamics for each country. There are different efficient and robust methods available for this purpose. The panel fully modified ordinary least square (PFMOLS) and the Panel Dynamic Ordinary Least Square (PDOLS) estimation techniques allow only for estimating long-run parameters. However, the Pooled Mean Group Estimation (PMGE) of Pesaran et al. (1999) and the Mean Group Estimation (MGE) methods allow estimating both short- and long-run parameters. Therefore, we initially determine the homogeneity of long-long-run parameters using the Hausman test, and then run the PMGE estimation technique of Pesaran et al. (1999). All results of the Westerlund's cointegration analysis, the Panel-Wald causality tests, and the PMGE estimations are reported and discussed in the empirical findings.
4. Empirical Findings
First, we report results of the CD test in Table 2.
Table 2. Results of the CD test of Pesaran (2004) for FDI and FPIVOL
The CD test of Pesaran (2004) FDI FPIVOL
Pesaran (2004)’s the CD-stat 11.129 (0.000) 5.760 (0.000) Average Absolute Value of the Off-diagonal Elements 0.204 0.206
Notes: The CD test of Pesaran (2004) is defined under the null hypothesis of cross-sectional independence in FDI and FPIVOL series in 12 CEE countries. The p-values are in parentheses.
The results of the CD test of Pesaran (2004) in Table 2 strongly reject the null hypothesis of no cross-sectional independence in 12 CEE economies. Cross-sectional dependence requires the use of “second-generation” PUR tests. Following the results of the CD test of Pesaran (2004), we apply the
461 second generation cross-sectional dependence PUR test of Pesaran (2007). We report the results of the PUR tests of Pesaran (2007) in Table 3.
Table 3. Results of the PUR Tests in Cross-sectional Dependence
Heterogeneous Unit Root (The CIPS) Constant (FDI) Constant and Trend (FDI)
Zt-bar Statistic -1.017 (0.155) 0.536 (0.704)
Heterogeneous Unit Root (The CIPS) Constant
(FPIVOL) Constant and Trend (FPIVOL)
Zt-bar Statistic 2.583 (0.995) 1.942 (0.974)
Notes: The CIPS test of Pesaran (2007) assumes cross-sectional dependence as in form of a single unobserved common factor. The test is defined under the null hypothesis of non-stationary series. The optimal number of lag is selected by the AIC. The p-values are in parentheses.
As seen in Table 3, PUR tests of Pesaran (2007) do not reject the null hypothesis of FDI and FPIVOL series are non-stationary. Thus, we can advance to the panel cointegration analysis. We report the results of the Westerlund’s panel cointegration analysis in Table 4.
Table 4. Results of the Panel Cointegration Analysis for FDI and FPIVOL
Westerlund (2007) Value Z-value P-value Robust P-value
Gt -4.259 -8.208 0.000 0.000 Ga -20.738 -4.604 0.000 0.048 Pt -14.373 -8.261 0.000 0.000 Pa -26.666 -10.272 0.000 0.000
Notes: The null hypothesis is that there is no cointegration between the series. Lag intervals are selected by the AIC.
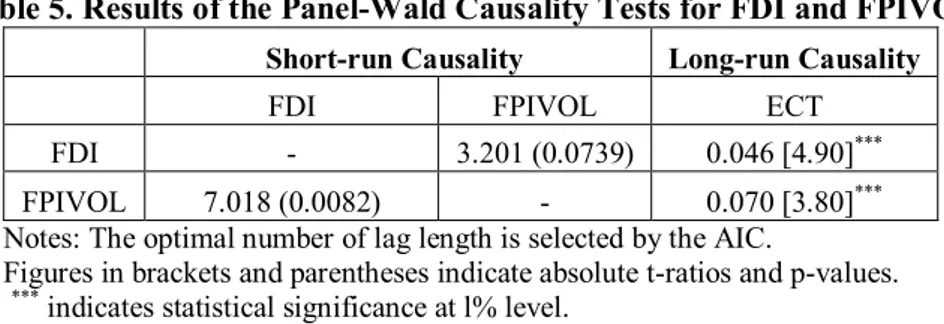
The four test statistics of the Westerlund (2007) panel cointegration test in Table 4 suggest that there is a significant cointegration between FDI and FPIVOL. Furthermore, we report the results of the Panel- Wald causality tests in Table 5. The results in Table 5 indicate that there is a bi-directional causality relationship between FDI and FPIVOL in the short-run. The empirical results also indicate that significant long-run causality exits.
Table 5. Results of the Panel-Wald Causality Tests for FDI and FPIVOL
Short-run Causality Long-run Causality
FDI FPIVOL ECT
FDI - 3.201 (0.0739) 0.046 [4.90]*** FPIVOL 7.018 (0.0082) - 0.070 [3.80]*** Notes: The optimal number of lag length is selected by the AIC.
Figures in brackets and parentheses indicate absolute t-ratios and p-values. ***
indicates statistical significance at l% level.
Next, we report the results of the PMGE estimations of Pesaran et al. (1999) which allow estimating both short and long-run parameters on country base. We report the results in Tables 6 and 7. The results for equation (1) are given in Table 6, and they indicate that the volatility of FPIs significantly affect FDIs in all countries in the long-run. The negative coefficients of FPIVOL indicate that a decrease in the volatility of FPI is followed by an increase in FDI. These findings are consistent with the classical view. FPI flow lays the groundwork for FDI providers and the steadier it gets the more FDI flows. In the long-run, volatility of FPIs affect FDIs in all countries, and the effect is at the most in the Czech Republic (-0.80) and Bulgaria (-0.22) at the least. However, similar pattern does not exist in short-run. The results suggest that volatility of FPIs significantly affect the amount of FDIs only in the Czech Republic (-0.50) and Turkey (-2.84), and also marginally in Lithuania. A joint
462 implication of the short and long-run results would be emphasized that these three countries are more vulnerable to sudden-stops and shocks in financial markets than other economies in the region.
Table 6. Results of the PMGE for the Foreign Direct Investments
Country FPIVOL ECT
Bulgaria -0.929 (10.17) -0.219 [2.90]*** The Czech Republic -0.504 (0.257)** -0.806 [7.29]*** Estonia -0.008 (0.050) -0.800 [7.00]*** Hungary -0.317 (0.961) -0.678 [6.02]*** Latvia -0.387 (0.251) -0.344 [3.62]*** Lithuania -0.443 (0.236)* -0.506 [5.26]*** Poland -0.496 (0.362) -0.633 [4.75]*** Romania 0.272 (0.807) -0.289 [3.21]*** Russia Federation -0.910 (0.936) -0.190 [2.59]** Slovenia 0.069 (0.281) -0.487 [4.57]*** Turkey -2.841 (1.023)*** -0.392 [4.64]*** Ukraine -0.328 (0.452) -0.487 [4.66]***
Notes: Dependent variable is the foreign direct investment (FDI). The constant term is estimated but not reported. The ECT is the error correction term. The optimal number of lag length is selected by the AIC. Figures in brackets and parentheses indicate absolute t-ratios and standard errors, respectively. ***,**and * indicate statistical significance at the l%, 5%, and 10% levels, respectively.
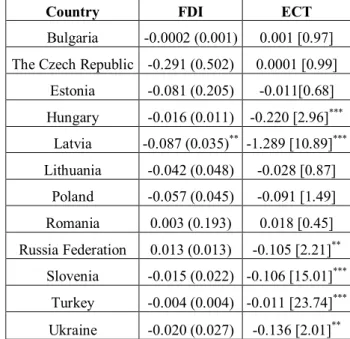
Table 7. Results of the PMGE for the Volatility of Foreign Portfolio Investments
Country FDI ECT
Bulgaria -0.0002 (0.001) 0.001 [0.97] The Czech Republic -0.291 (0.502) 0.0001 [0.99]
Estonia -0.081 (0.205) -0.011[0.68] Hungary -0.016 (0.011) -0.220 [2.96]*** Latvia -0.087 (0.035)** -1.289 [10.89]*** Lithuania -0.042 (0.048) -0.028 [0.87] Poland -0.057 (0.045) -0.091 [1.49] Romania 0.003 (0.193) 0.018 [0.45] Russia Federation 0.013 (0.013) -0.105 [2.21]** Slovenia -0.015 (0.022) -0.106 [15.01]*** Turkey -0.004 (0.004) -0.011 [23.74]*** Ukraine -0.020 (0.027) -0.136 [2.01]**
Notes: Dependent variable is the volatility of foreign portfolio investment (FDI). The constant term is estimated but not reported. The ECT is the error correction term. The optimal number of lag length is selected by the AIC. Figures in brackets and parentheses indicate absolute t-ratios and standard errors, respectively. ***,**and * indicate statistical significance at the l%, 5%, and 10% levels, respectively.
The results in Table 7 show the results of equation (2) which tests the hypothesis of “FDI affects the volatility of FPI”. The findings indicate that FDI have significant impacts on the volatility of FPI only in six countries in the long-run: Hungary, Latvia, Russia, Slovenia, Turkey, and Ukraine. The negative coefficients show that increase in FDI decreases the volatility of FPI. In the long-run, FDI
463 affects the volatility of FPI in Latvia (-1.29) the most; and in Turkey (-0.01) the least. The relationship as suggested by “alternative approach” is also marginal in the short-run and degree of FDI significantly affects the volatility of FPI only in Latvia. These findings suggest that the Latvian economy has an interesting advantage in the region to attract steadier FPI by increasing amount of FDI. Our results suggest that FPI volatility is a strong indicator of FDI in CEE economies. Therefore, the main policy implication is that in order to reduce the volatility of FPI, these countries should be cautious in taking actions against possible sudden-stops and should increase their soundness of financial sectors and institutions, i.e. banking systems and deepen their financial markets.
5. Conclusion
This paper attempts to examine the validity of two major approaches regarding the relationship between FDI and FPI in 12 CEE countries taking into account the structures of FDI and FPI, existing structural break and cross-sectional dependency. The “classical view” suggests that FPI is followed by FDI and the “alternative view” suggests that FDI is followed by FPI. Although, the permanent structure of FDI and the temporary structure of FPI are well-documented in the literature, some studies fail to account that FDI and FPI are significantly different both in size and nature. Therefore, we focus on FDI measured in level due to its permanent nature and the volatility of FPI, due to its temporary structure; whereas change in both FDI and FPI is dynamic and salient. Regarding to the “classical view”, our empirical findings strongly indicate that volatility of FPI has a significant effect on the lagging FDI in the long-run in all CEE countries. In the short-run, this relation is observed only in Turkey, the Czech Republic, and Lithuania. The results reveal that volatility of FPI is a significant determinant of FDI, and these three countries are relatively sensitive to external shocks.
On the other hand, the bi-directional relationship is not valid in all countries. FDI flows have significant effects on volatility of FPI in six countries in long-run, and only in Latvia in short-run. The findings imply that Latvia has an interesting advantage to attract steadier FPI by increasing amount of FDI. Therefore, sustainability of FDI inflows is relatively more important in Latvia, compared to other countries in the region. Hence, our findings are in line with the previous empirical findings of Albuquerque (2003) and the theoretical background of Goldstein and Razin (2006).
We believe that there could be two possible explanations of our results. First, countries that have reached a critical level of capital liberalization in the region benefit from the pull effect of lower FPI volatility to attract FDI. Second, if certain direction of relationship is relatively dominant in an economy, reverse relationship does not likely to exist. Nevertheless, this study does not attempt to examine the impact of the degree of capital liberalization and informational asymmetry on the relationship between FPI and FDI. Finally, the results of this study deserve further examination on the relationship using a more complex model.
References
Albuquerque, R. (2003), The Composition of International Capital Flows: Risk Sharing through Foreign Direct Investment. Journal of International Economics, 61(2), 353–383.
Andrade, S.C., Chhaochharia, V. (2010), Information Immobility and Foreign Portfolio Investment. Review of Financial Studies, 23(6), 2429–2463.
Bollerslev, T. (1986), Generalized Autoregressive Conditional Heteroskedasticity. Journal of Econometrics, 31(3), 307–328.
Calvo, G. A., Mendoza, E.G. (2000), Rational Contagion and the Globalization of Securities Markets. Journal of International Economics, 51(1), 79–113. .
Engle, R.F. (2001), GARCH 101: The Use of ARCH/GARCH Models in Applied Econometrics. Journal of Economic Perspective, 15(4), 157–168.
Goldstein, I., Razin, A. (2006), An Information Based Trade-off between Foreign Direct Investment and Foreign Portfolio Investment. Journal of International Economics, 70(1), 271–295.
Haley, M.A. (2001), Emerging market makers: The power of institutional investors, in: L.E. Armijo (Ed.), Financial Globalization and Democracy in Emerging Markets. London, Palgrave Macmillan, pp. 74–90.
Pesaran, M.H. (2004), General Diagnostic Tests for Cross Section Dependence in Panels. IZA Discussion Paper Series, No. 1240.
464 Pesaran, M.H. (2007), A Simple Panel Unit Root Test in the Presence of Cross-section
Dependence. Journal of Applied Econometrics, 22(2), 265–312.
Pesaran, M.H., Shin, Y., Smith, R.P. (1999), Pooled Mean Group Estimation of Dynamic Heterogeneous Panels. Journal of the American Statistical Association, 94(446), 621–634.
Reinhart, C.M., Rogoff, K.S. (2009), This Time is Different: Eight Centuries of Financial Folly. New Jersey, Princeton University Press.
Sula, O., Willett, T.D. (2009), The Reversibility of Different Types of Capital Flows to Emerging Markets. Emerging Markets Review, 10(4), 296–310.
Uctum, M., Uctum, R. (2011), Crises, Portfolio Flows, and Foreign Direct Investment: An Application to Turkey. Economic Systems, 35(4), 462–480.
Van Nieuwerburgh, S., Veldkamp, L. (2009), Information Immobility and the Home Bias Puzzle. Journal of Finance, 64(3), 1187–1215.
Westerlund, J. (2007), Testing for Error Correction in Panel Data. Oxford Bulletin of Economics and Statistics, 69(6), 709–748.