RISK PREMIUM IN MOTOR VEHICLE INSURANCE Banu ÖZGÜREL *
ABSTRACT
The pure premium or risk premium is the premium that would exactly meet the expected cost of the risk covered ignoring management expenses, commissions, contingency loading, etc. Claim frequency rate and mean claim size are required for estimation in calculating risk premiums.
In this study, we discussed to estimate claim frequency rate and mean claim size with several methods and calculated risk premiums. Data, which supported our study, is provided by insurance company involving with motor vehicle insurance.
Key words: Number of Claims, Claim Sizes, Claim Frequency Rate, Risk Premium.
1. Introduction
Insurance is an important part of risk management programs for organisations and individuals. Insurance is a risk financing transfer under which an insurer agrees to accept financial burdens arising from loss. More formally, insurance can be defined as a contractual agreement between two parties: the insurer and the insured.
Insurance may be classified into three groups – insurance of person, insurance of property and pecuniary interest, and insurance of liability. General insurance, or Non-Life insurance or Property/Casualty insurance as it is sometimes called, normally relates to the insurance of property and liability.
In this study, we are interested in motor vehicle insurance. Motor
vehicle insurance contracts are schedule contracts that the permit the
insured to purchase both property and liability insurance under one
policy. The contract can be divided, however, in two separate contracts –
one providing insurance against physical damage to automobiles, and the
other protecting against potential liability arising out of the ownership,
maintenance, or use of an automobile. Some automobile insurance
• Öğr. Gör. , Dokuz Eylül Üniversitesi Fen Edebiyat Fakültesi, İstatistik Bölümü, Tınaztepe Kampüsü, Buca-İZMİR,
contracts, notably those issued by insurers associated with automobile
finance companies, cover only physical damage insurance.
2. The Risk Premium
The pure premium or risk premium is the premium that would exactly meet the expected cost of the risk covered ignoring management expenses, commissions, contingency loading, etc. To compute it, we need to estimate the claim frequency rate and mean claim size. Multiplying claim frequency rate by mean claim size yields the risk premium.
A claim is an assertion of a right to payment, as when a customer notifies a manufacturer of an injury from a defective product and expenses a belief that the injury justifies compensation. Usually, the payment is to occur at some future point in time. It should not be assumed that all accidents become claims, nor that the amount of the claim will always be the same as the amount of the damage.
The claim size is the sum, which the insurer has to pay on the occurrence of a fire, an accident, death or some other insured event. The sum of the individual claims constitutes the aggregate claim amount, which is one of the key concerns, both in the practical management of an insurance company and in theoretical consideration.
The claim frequency rate is a rate which can be estimated as the number of claims divided by the number of units of exposure.
It is important that the two components, claim frequency rate and claim size be considered separately. Only in exceptional circumstances can the use of ‘rate of payment of claims’ be considered satisfactory for the assessment of a risk premium.
3. Method of Study
Analysis is based on simple formulations as follows (Hossack, 1989: 123-125):
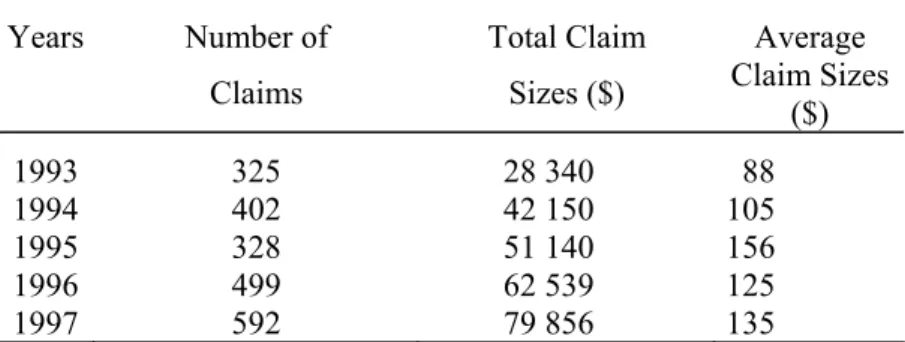
(1) Depending on yearly total claim sizes and number of claims, mean claim sizes for each year can be calculated by the formula
i i i c TCS MCS = (1)
where the notation is
MCSi : mean claim size for year i TCSi : total claim size for year i Ci : number of claims in year i
(2) Depending on yearly total amount of premiums and number of policies, average office premium per policy for each year can be calculated by the formula i i i N TOP AOP = (2) where the notation is
AOPi : average office premium per policies for year i. TOPi : total amount of premiums for year i.
Ni : number of policies in year i.
(3) Depending on yearly total claim sizes and number of policies, risk premium for each year can be calculated by the formula
i i i N TCS RP = (3) where RPi denotes risk premium for year i.
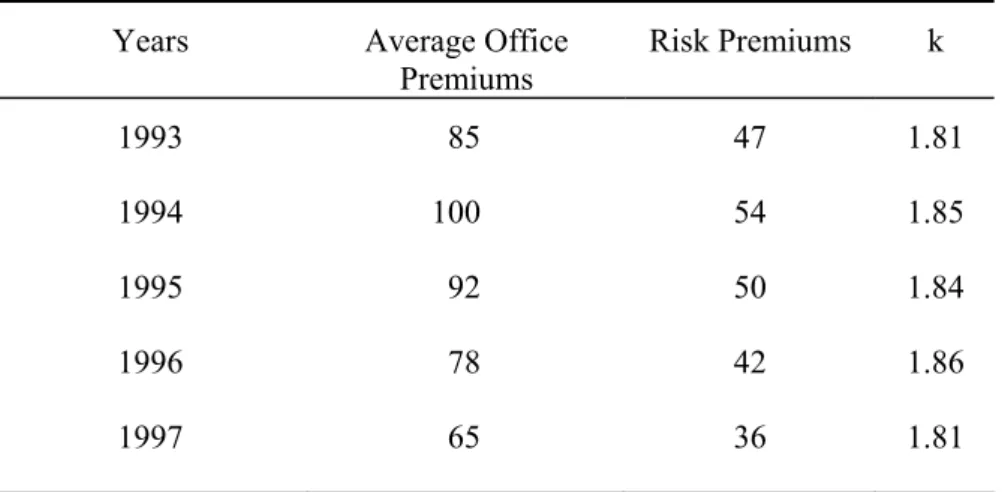
(4) Depending on yearly office premium and risk premium, the ratio can be calculated by the formula
i i i RP AOP k = (4) where ki denotes the ratio of office premium to risk premium for year i.
(5) A fixed claim frequency rate can be calculated depending on the total number of policies and the total number of claims.
In fact, claim frequency rate is the ratio of the number of claims in a period to the exposure to risk for this period. The main problem in calculating claim frequency rate is to find the exposure to risk can be calculated by various methods. One of them is the Census Method.
Let N(t) denote the number of policies booked by the insurance company at time t. During the short interval of time
δ
t
immediately following time t, the change in the number of policyholders a premium will be negligible. Each of the N(t) premium policyholders currently on the books will contributet
δ
years of exposure during that small time interval so that the total number of years’ exposure during the interval of timeδ
t
following time t will be N(t)δ
t
. The total exposure during 1997-1998 will,therefore, be approximately
∑
= t of steps in to tt
t
N
δδ
1 0)
(
the calculation becomes more and more accurate the smaller
δ
t
becomes, and exact whenδ
t
becomes too small. Then in mathematical terms dt is written instead ofδ
t
, and becomes∫
10
)
( dt
t
N
i.e. the area under the N(t) curve between t=0 and t=1.
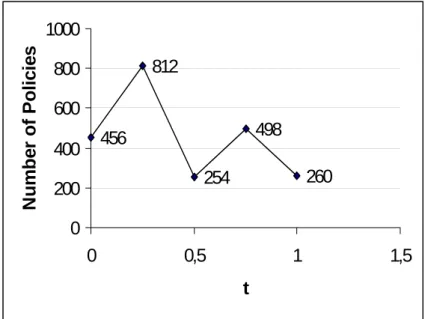
For example, when data given in Table 4.2 is considered Figure 4.1 is the approximate graph of N(t).
Figure 1. Available number of policies during October 1,1997 to October 1,1998
456
254
498
260
812
0
200
400
600
800
1000
0
0,5
1
1
t
N
u
m
b
e
r of
P
o
lic
ie
s
,5
The area under N(t) curve is
4 1 4 1 4 2 1 3 0
∑
= ⎥⎦ ⎤ ⎢ ⎣ ⎡ ⎟ ⎠ ⎞ ⎜ ⎝ ⎛ + + ⎟ ⎠ ⎞ ⎜ ⎝ ⎛ t t N t Nand is calculated to be 481, since the number of claims during this period is reported to be 183, the claim frequency rate is said to be 183/481 and equals 0.38.
When the period is extended to k years and total number of claims booked each year are assumed to be exposure to risk for that year, then total exposure to risk becomes N1+N2+…+Nk.. The total number of claims given by
C1+C2+…+Ck. therefore yields the claim frequency rate to be calculated by the formula
∑
∑
= ==
k i i k i iN
C
m
1 1 (5) where m is the claim frequency rate which is assumed to be constant during k years.(6) On the implications of the mean claim sizes and total number of claims booked by the company the growth rate can be calculated. In the growth rates geometric progression can be assumed or both geometric and arithmetic progressions can be assumed.
4. Application
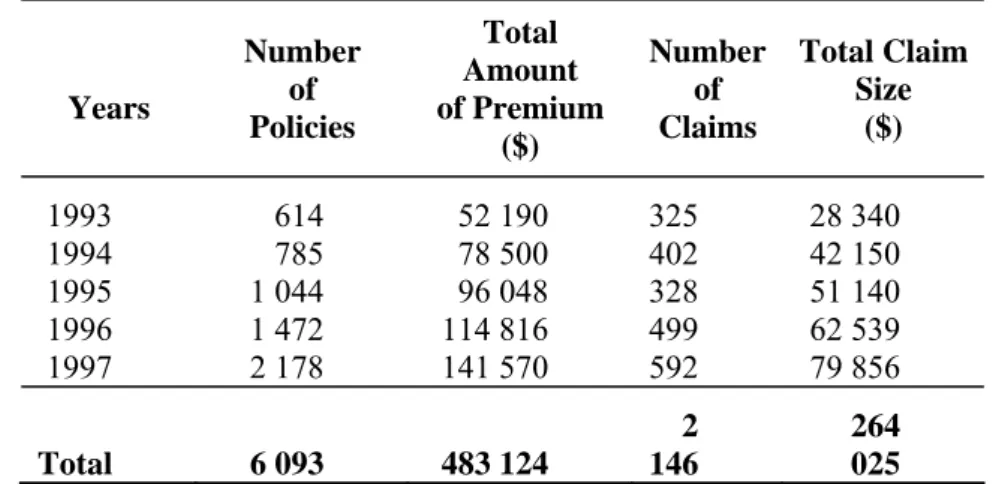
The insurance company is established in 1992 and the available data comprises of
• the number of policies booked each year
• total amount of the premiums collected for each year • yearly number of claims
• total claim size for each year
Table 1. Yearly Income and Outgo Years Number of Policies Total Amount of Premium ($) Number of Claims Total Claim Size ($) 1993 614 52 190 325 28 340 1994 785 78 500 402 42 150 1995 1 044 96 048 328 51 140 1996 1 472 114 816 499 62 539 1997 2 178 141 570 592 79 856 Total 6 093 483 124 2 146 264 025
Besides, the numbers of policies booked by the company October 1, 1997 to October 1, 1998 are also available. This data is presented in Table 2. Table 2. Available number of policies during October 1, 1997 to October 1, 1998
Dates Number of Policies
October 1, 1997 456 January 1, 1998 812 April 1, 1998 254
July 1, 1998 498
October 1, 1998 260
Number of claims during the time between October 1, 1997 to October 1, 1998 is 183.
In this section the results will be obtained by applying each step explained in section are presented.
Table 3. Mean Claim Sizes Years Number of Claims Total Claim Sizes ($) Average Claim Sizes ($) 1993 325 28 340 88 1994 402 42 150 105 1995 328 51 140 156 1996 499 62 539 125 1997 592 79 856 135
(2) Average office premium for each year are presented in Table 4. Table 4. Average Office Premiums
Years Total Office Premiums Number of Policies Average Office Premiums 1993 52 190 614 85 1994 78 500 785 100 1995 96 048 1 044 92 1996 114 816 1 472 78 1997 141 570 2 178 65
(3) Risk premium for each year are presented in Table 5. Table 5. Risk Premiums
Years Total Claim Sizes ($) Number of Policies Risk Premiums 1993 28 340 614 47 1994 42 150 785 54 1995 51 140 1 044 50 1996 62 539 1 472 42 1997 79 856 2 178 36
(4) k for each year are presented in Table 6.
Table 6. Yearly ratios of office premiums to risk premiums
Years Average Office
Premiums Risk Premiums k 1993 85 47 1.81 1994 100 54 1.85 1995 92 50 1.84 1996 78 42 1.86 1997 65 36 1.81
(5) Claim frequency rate depending on data given Table 1 and calculated by formula (5) is 35 , 0 6093 2146 = = m and this can be assumed to be a crude estimate.
(6) The most reasonable yearly mean claim size figures constitute a geometric progression. The first mean claim size in Table 3 is $88 and four year after it becomes $135.
Let r denote the growth rate in mean claim size and with the assumption of geometric growth
i i
r
MCS
MCS
+1=
(
1
+
)
Therefore, r can be calculated from88
)
1
(
135
=
+
r
4 and is found to be 11.29%.The number of policies booked by the insurance company which are given in Table 1 on yearly basis implies not only a geometric growth but also an arithmetic growth.
The relation between the successive number of total policies is found to be as follows by trial and error.
n2=1.2785n1
n3=(1.2785+0.063)n2 n4=(1.2785+2×0.063)n3 n5=(1.2785+3×0.063)n4 or expressed by a general formula as follows
[
]
ii
i
n
n
+1=
1
.
2785
+
(
−
1
)
×
0
.
063
We begin the work with the following assumptions:
(1) In 1993, 614 policyholders are to be booked, and mean claim size is to be $88.
(2) Claim frequency rate during the following 5 years is to be constant and equal to 35%.
(3) Mean claim size increases by a constant rate which is equal to 11.29%.
(4) Number of policyholders increases by the relation
[
]
ii
i
n
n
+1=
1
.
2785
+
(
−
1
)
×
0
.
063
(5) Only half of the claims reported in a year are paid in that year, and the other half of the claims are paid in the succeeding year.
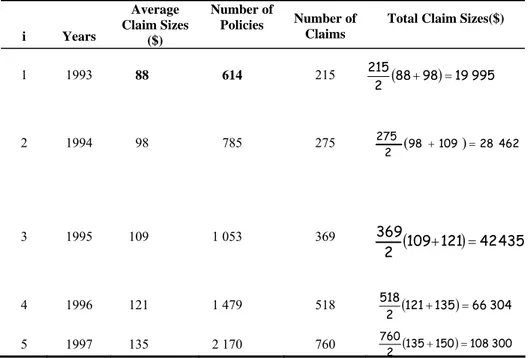
With respect to the above assumptions mean claim sizes, number of policies, number of claims and total claim size paid each year can be calculated. The calculated values are showed in Table 7.
Table 7. Number of policies and claim amount under the assumptions i Years Average Claim Sizes ($) Number of Policies Number of Claims
Total Claim Sizes($)
1 1993 88 614 215 2 1994 98 785 275 (98 109) 28462 2 275 + = 3 1995 109 1 053 369
(
109 121)
42435 2 369 + = 4 1996 121 1 479 518 (121 135) 66304 2 518 + = 5 1997 135 2 170 760 (135 150) 108300 2 760 + = (88 98) 19995 2 215 + =Calculation of claim frequency rate as a ratio of number of claims to the exposure to risk yields a relation which is very useful to estimate the number of claims for each year. The number of claims which are denoted by ci in Table 7 are calculated by
i i i
m
n
c
=
×
(6)Total claim size for each year is to be calculated by considering the number of claims produced that year and half of them to be paid mean claim size of that year, and the other half to be paid mean claim size of the succeeding year with respect to assumption (5) stated above:
(
1)
2 + + = i i i i MCS MCS c TCS (7)The numerical figures presented in Table 7 can be used in order to calculate the expected mean claim sizes by applying formula (1), and risk premiums by formula (3).
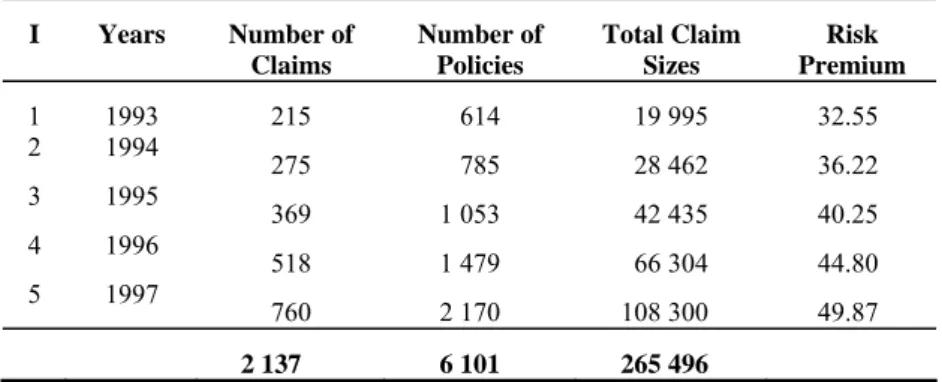
The risk premiums obtained by these calculations are presented in Table 8.
Table 8. Risk premiums under the assumptions
I Years Number of Claims Number of Policies Total Claim Sizes Risk Premium 1 1993 215 614 19 995 32.55 2 1994 275 785 28 462 36.22 3 1995 369 1 053 42 435 40.25 4 1996 518 1 479 66 304 44.80 5 1997 760 2 170 108 300 49.87 2 137 6 101 265 496
The total row in Table 8 contains the most important numerical figures in our analysis. As a result of the analysis total number of policies booked in 5 years is to be 6101, total number of claims in this period is to be 2137, and the total amount of claim sizes to be paid in this period is $ 265 496.
If the calculated risk premiums in Table 8 are to be applied during the years 1993-1997, the number of policies realized (data given in Table 1) would give rise to collection of total amount of net premiums as presented in Table 9. Table 9. Total amount of net premiums
i Years Realized Number of
Policies Planned Risk Premium Total amount of premium 1 1993 614 32.55 19 985.70 2 1994 785 36.22 28 436.62 3 1995 1 044 40.25 42 021.00 4 1996 1 472 44.80 65 945.60 5 1997 2 178 49.87 108 627.75 Total 6 093 265 016.67
The total rows both in Table 1 and 9 show that 6093 policy are booked in five years, total number of claims in this period in 2146 (Table 1) and the total amount of risk premiums to be collected by the proposed plan is $265 016.67 (Table 9).
We see that the realized values of the five years totals of number of claims and number of policies are very close to the values obtained under the planning assumptions. Besides, the total amount of risk premiums which would be collected under the proposed plan would cover the realized total amount of claim sizes.
In this paper, we studied the data provided by an insurance company involving with motor vehicle insurance in the light of theory of insurance risk model and risk premiums.
First of all, available data is analysed. After words, reasonable assumptions on the growth of number of policies, increase of claim frequency rate, increase of mean claim size by a constant rate, a risk premium payment plan for five years is proposed. In conclusion, the proposed plan is found to give rise to very close values the realized ones, and be capable to cover the realized expenses.
Özet
Risk primi, bir sigorta şirketinde yönetim masrafları, komisyonlar göz önüne alınmadan riskin beklenen maliyetini karşılayan primlerdir. Risk primlerinin hesaplanabilmesi için hasar sıklık oranı ve ortalama hasar büyüklüğünün tahmin edilmesi gerekir.
Bu çalışmada, hasar sıklık oranı ve ortalama hasar büyüklüğünün çeşitli yöntemlerle tahmin edilmesi tartışılmış ve risk primleri hesaplanmıştır. Çalışmamızı destekleyen veriler kasko sigortalarını içeren sigorta şirketi tarafından elde edilmiştir.
Anahtar Kelimeler: hasar sayısı, hasar büyüklüğü, hasar sıklık oranı, risk
primi.
REFERENCES
BOWERS, N.L., H.U. GERBER, J.C. HICKMAN, D.A. JONES ve C.J. NESBITT, (1986), Actuarial Mathematics, USA: Society of Actuaries.
BÜHLMAN, H. (1996), Mathematical Methods in Risk Theory, New York: Springer–Verlag.
DAYKIN, C. D., T.PENTIKAINEN T. and M. PEASONEN (1994), Practical Risk Theory for Actuaries, London: Chapman – Hall.
DEGROOT, M.H. (1975), Probability and Statistics, Canada: Addison – Wesley.
FREUND, J.E. (1973), Introduction to Probability, New York: Dover Publication.
GERBER, H.U. (1979), An Introduction to Mathematical Risk Theory, Philadelphia: University of Pennsylvania.
GRANDELL, J. (1991), Aspects of Risk Theory, New York: Springer – Verlag. HART, D.G., R.A BUCHANAN and B.A. HOWE (1996), The Actuarial
Practice of General Insurance, Sydney: Institute of Actuaries of Australia.
HOGG, R.V. and A.T. CRAIG (1995), Introduction to Mathematical Statistics, New Jersey: Prentice – Hall.
HOSSAK I.B., POLLARD J.H. and ZEHNWIRTH (1989), Introductory Statistics with Applications in General Insurance, Cambridge University Press.
LARSON H.J. (1982), Introduction to Probability Theory and Statistical Inference, Singapore: John Wiley & Sons.
LEMAIRE, J. (1985), Automobile Insurance Actuarial Models, USA: Kluwer – Nijhoff.
PANJER, H.H. and G.E. WILMOTT (1992), Insurance Risk Models, USA:Society of Actuaries.
REJDA, G.E. (1994), Social Insurance and Economic Security, New Jersey: Prentince- Hall.
ROSS, S. (1998), A First Course in Probability, USA: Prentice – Hall.
SCHEAFFER, R. L. and W. MENDENHALL (1975), Introduction to Probability: Theory and Applications, Massachusetts: Duxbury Press. SKIPPER, H.D. Jr. (1998), International Risk and Insurance: An
Environmental–Managerial Approach, Singapore: Irwin/McGraw-Hill.
STRAUB, E. (1980), Non-Life Insurance Mathematics, New York: Springer-Verlag.
Webster’s New Colligate Dictionary (1991).
WILLIAM, C.A. JR., SMITH, M.L. and YOUNG, P.C. (1998), Risk Management and Insurance, Singapore: Irwin/McGraw-Hill.