ORIGINAL RESEARCH
The Topography and Sources of Multidimensional Poverty
in Turkey
Burhan Can Karahasan1 · Fırat Bilgel2
Accepted: 13 November 2020 © Springer Nature B.V. 2021
Abstract
Economic inequality and poverty have been extensively analyzed in monetary terms. However, other aspects of poverty, such as education, health, environment and standards of living are important factors, essential for human well-being and capabilities. Using a host of non-monetary aspects of poverty, this paper sheds light on the geographical dis-tribution of multidimensional poverty in Turkey. Results from survey data highlight that the regional distribution non-monetary dimensions of poverty is conspicuously different than that of relative monetary poverty in Turkey. Unlike the relative monetary poverty rate, multidimensional poverty measurement reflects the regional underdevelopment problem of Turkey. On the contrary, once monetary poverty is considered in absolute terms, multidi-mensional and absolute monetary poverty have a similar geographical pattern. Moreover, the decomposition analyses point out that females, old disabled and socially excluded indi-viduals suffer the most from multidimensional poverty. Our combined results show that the isolated eastern regions realize the highest poverty and deprivation at each decomposition level.
Keywords Alkire-Foster framework · mpi · Poverty · Turkey
JEL Classification I3 · I32 · D63 · O1
Earlier versions of the manuscript is presented at the ERF Workshop on Non-Monetary Dimensions of Inequality and Poverty Among Youth in the ERF Region, Cairo (2019), 20th National Economic Congress of Turkish Economic Association, Adana (2019).
Electronic supplementary material The online version of this article (https ://doi.org/10.1007/s1120 5-020-02557 -8) contains supplementary material, which is available to authorized users.
* Burhan Can Karahasan [email protected]
1 Department of Economics and Finance, Piri Reis University, Faculty of Economics and Administrative Sciences, 34940 Istanbul, Tuzla, Turkey
1 Introduction
Identifying the poor and challenging different approaches for poverty measurement is a long-standing phenomenon (Sen 1976). Different approaches gain insight as monetary and non-monetary ways of measuring poverty are discussed among scholars and policy makers. One strand of literature uses monetary indicators such as income or consumption expendi-tures to measure poverty (Townsend 1954). Alternatively, poverty can be better explained by examining the deprivation level of individuals using a host of non-monetary items (Sen
1982; Ravallion 1996). These discussions recently enter to the realm of Bourguignon and Chakravarty (2003) and Atkinson (2003), where non-monetary dimensions (i.e. education, health, living conditions etc.) are used to capture the multidimensional nature of poverty.
While the measurement of unidimensional monetary poverty using income is straight-forward, the use of non-monetary indicators yields a more accurate and realistic identifi-cation of the poor. Moreover, considering more than one dimension to measure poverty makes things even more complicated because determining the individual poverty thresh-olds for and assigning importance (weights) to different dimensions is subjective. Alkire and Foster (2011a, 2011b) offer a comprehensive method similar to the approach offered by Klasen (2000) and propose a multidimensional poverty index (MPI), which combines different dimensions of poverty in a single and decomposable measure.1
Motivated by different ways of measuring poverty, this research uses individual-level, non-monetary factors to measure multidimensional poverty for Turkey at the regional level. We follow the MPI approach offered in Alkire and Foster (2011b) as it enables us to focus more on the sources of poverty both at the dimension and also at the regional level. Moreo-ver, given the discussion on the policy front (OPHI 2013; UNDP 2020) the use of MPI to assess the extent of multidimensional poverty contributes to the evaluation and determina-tion of the right policy-mix to combat poverty. Even though poverty reducdetermina-tion began to receive more interest on policy side, heavy reliance on monetary social transfers poten-tially hides the extent of deprivation for the disadvantageous. While policies motivated by monetary aspects influence the daily needs of the poor, access to better education, health, public services and standard of living are mostly neglected throughout poverty reduction. Besides, policy implementations are shaped by the centralized nature of Turkey, leaving very little room for considering local priorities to combat poverty.
A careful review of the Turkish literature suggests that poverty is linked with both mon-etary factors such as income but also with other non-monmon-etary aspects such as gender, age and education (Morçöl 1997). Similarly, there is a necessity to consider other dimensions that are supposed to influence poverty in Turkey (i.e. health) (Saatci and Akpinar 2007). Poverty is a socioeconomic problem in Turkey, creating various channels across an array of social and economic fundamentals of the society (Buğra and Keyder 2003; Kalaycio-glu 2006; Betti et al. 2013). Recently, a number of studies followed the Alkire and Foster (2011a) approach to understand multidimensional poverty in Turkey (Acar 2014; Karadağ and Saraçoğlu 2015; Uğur 2015; Limanli 2016). Moreover, Acar et al. (2017) compare the monetary and non-monetary dimensions of poverty by examining how individuals overlap in certain aspects of poverty (monetary and material deprivation); findings show a mis-match between these two different forms of poverty measurements. However, none of these
1 See Alkire and Foster (2011a) for technical details and a brief comparison with other approaches. Also see Sect. 2 for a brief overview of alternative approaches to measure multidimensional poverty.
studies focus on the sources of poverty by carrying out a detailed regional decomposition analysis by demographics (i.e. age, gender) or dimensions (i.e. education, health etc.) or more generally aim at the spatial dimension of poverty. Clearly, there is a lack of knowl-edge on the regional distribution of multidimensional poverty in Turkey. Therefore, we approach poverty from a non-monetary and multidimensional way by taking into account spatial variability.
Turkish economy is characterized by a significant amount of duality in the form of developed west and underdeveloped east. While Dogruel and Dogruel (2003) highlight the historical origins of regional disparities in Turkey, Karahasan (2020) recently identifies the local variation in regional convergence by underlining the continuum of the duality during the post-2000 period. Regional duality in Turkey and the importance of social policies for developing countries with sizable regional disparities are two important lines of contribu-tion for investigating multidimensional poverty in a developing country like Turkey. Addi-tionally, a decomposition analysis is carried out to evaluate the contribution of different factors to multidimensional poverty and certain demographic characteristics of the popula-tion are considered (i.e. age, gender, employment status). Once again, this gives hints on the sources of poverty in Turkey and helps shape local policies aimed at reducing poverty. Finally, a sensitivity analysis is conducted to check the sensitivity of poverty measurement to the essential parameters of the MPI measurement.
In recent policy discussions, it has been documented that multidimensional poverty is an important aspect of poverty in Turkey (Alkire et al. 2011; OPHI 2013). Based on the 2003 data, education and health dominated the individual deprivation and aggregate poverty in Turkey. Besides, a careful inspection of the poverty figures highlights that rural areas and specifically, eastern remote regions suffer the most from multidimensional poverty. To our knowledge, it is one of the first attempts to identify and underline the importance of non-monetary factors that influence poverty and inequality in Turkey. However, the snapshot is only limited with the 2003 figures (Alkire et al. 2011; OPHI 2013). This stands as an important motivation to examine the post-2000s during which Turkey realized a massive transformation in health, education, social transfers etc. Although the report highlights the importance of the regional dimension of poverty and deprivation, it does not explain the local sources of variation as only the broad geographical regions are highlighted in the report.
Section 2 reviews the related literature; Sect. 3 lays out our data source, the sampling design, the nature of our data and introduces the methodological aspects of the Alkire-Fos-ter (AF) framework; Sect. 4 tabulates and maps the MPI estimates; conducts a sensitivity and a decomposition analysis at the regional level; Sect. 5 discusses the results and Sect. 6
concludes.
2 Literature Review
Poverty is a multidimensional concept that embeds not only monetary indicators but also non-monetary factors that are supposed to influence the capabilities and deprivation of individuals (Atkinson 2003). Monetary indicators such as income or consumption have been liberally used in applied studies. Identifying the poor and constructing a poverty index is a two-step unidimensional method once a monetary indicator is chosen to measure poverty (Sen 1976). After having identified the poor, basic indices such as headcount index or poverty gap can be calculated in order to calculate poverty at the country level. Since a
unidimensional monetary poverty measure will have a single indicator and a cutoff level to identify the poor, it is relatively less complex compared to a multidimensional perspec-tive (Alkire and Foster 2011b). Moreover, monetary indicators are also preferable in cross-country studies due to the availability of comparable income data across countries. A draw-back is that poverty measures that rely solely on monetary indicators fail in controlling for non-monetary characteristics of individuals that are likely to influence the deprivation level and thus poverty (Sen 1982). Both deprivation in certain dimensions as well as the inabil-ity to meet certain capabilities are crucial elements of poverty. Failure to control for these factors can be waived by following a multidimensional perspective (Sen 1982, 1985).
The ability of individuals to meet certain achievement levels, known as the individual capabilities approach (Sen 1992, 2005), led the pathway to a number of studies that exam-ined the multidimensional nature of poverty in which individuals’ characteristics are not limited to income-based monetary factors (Tsui 2002; Atkinson 2003; Bourguignon and Chakravarty 2003; Ravallion 2011). Therefore, additional characteristics of individuals are considered (health, education, living conditions etc.). This paradigm shift has brought additional measurement issues due to the multiplicity of dimensions that are of non-mone-tary nature and has matured the identification of the poor.
These discussions motivate scholars to focus on measurement methods of multidimen-sional poverty.2 For instance Maasoumi (1986); Maasoumi and Lugo (2008) incorporate
the information theory to the determination of multidimensional poverty in a two-step framework: the first step determines the right indicators to measure welfare, the second step is to choose an inequality index to assess the degree of multidimensional poverty. Recently, Betti et al. (2006, 2013) follow the approach offered in Cerioli and Zani (1990) and measure multidimensional poverty by using the fuzzy set approach, which underlines the importance of observing the deprivation level of individuals within the whole distri-bution of income and other living conditions. Cerioli and Zani (1990), Martinetti (1994), Deutsch and Silber (2006), Chakravarty (2019) also follow the fuzzy set approach to meas-ure multidimensional poverty and highlight the positive gateways of multidimensional pov-erty calculations.
A recent line of methodological discussion owes to Anand and Sen (1997), Klasen (2000) that offer the use of a method to combine different dimensions of poverty in a composite indicator. Based on Foster et al. (1984) and Atkinson (2003), Alkire and Foster (2011a, 2011b) propose this new approach (Alkire-Foster or AF approach) by challenging the identification and aggregation procedures of the previous studies on poverty measure-ment. The AF approach relies on four major steps to identify poverty: (1) Deprivation cut-off determination, (2) deprivation counts, (3) poverty cutcut-off determination, and (4) identi-fication function. Since deprivation and poverty are determined in two steps, the approach is also labeled as the “dual-cutoff methodology”. The AF approach first measures the dep-rivation in each dimension by using the depdep-rivation cutoffs; then constructs the poverty by referring to overall poverty, which has been measured as a weighted combination of each dimension. An important property of the AF approach is the perfect decomposability of the MPI for each dimension as well as for some other characteristics of the survey sample (e.g. age cohorts, gender, geography etc.).
2 Here we briefly sketch-out the central studies dealing with different methods to measure multidimen-sional poverty. See Deutsch and Silber (2005), Alkire and Foster (2011a), Betti et al. (2013) for a more detailed discussion on the pros and cons of different approaches to measure multidimensional poverty.
Based on recent advances in measuring multidimensional poverty, a prolific empirical studies literature investigates intra-country and cross-country differences in poverty and examines the extent of multidimensional poverty for selected African countries (Klasen
2000, Duclos et al. 2006, Adeoti 2014), selected EU countries (Deutsch and Silber 2005, Nolan and Whelan 2010), Nepal (Waglé 2005), the US (Waglé 2008), Brazil (Guedes et al.
2012), Italy (Coromaldi and Zoli 2012), and selected Latin-American countries (Battiston et al. 2013). Recently, Berenger (2019) considers the multidimensional poverty for selected South African countries. Similarly, Bourguignon and Chakravarty (2019) examines mul-tidimensional aspects of deprivation in Brazil and makes a comparison between poverty defined via income and education. Remarkably, there is rising interest on the cross-com-parison of income-based poverty and multidimensional poverty with various non-mone-tary aspects of individual deprivations. For instance, Alkire and Fang (2019) highlight that multidimensional poverty measure in China is historically less volatile and the ranking of poverty measures varies upon the preferred method (monetary vs. non-monetary poverty).
While these studies focus on individual characteristics of poverty at the country-level, others examine a set of countries and construct MPI in order to make cross-country pov-erty comparison (Alkire and Santos 2014). In the Middle East and North Africa (MENA) region, a number of studies examines cross-country differences in monetary poverty, with-out taking into account others dimensions (Adams Jr and Page 2003, Ncube et al. 2014); while others consider multidimensional poverty in Egypt and Tunisia (Bibi 2004), Egypt (Berenger 2010), selected MENA countries (Collicelli and Valerii 2000) and South Afri-can countries (Fransman and Yu 2019). Recently, Aguilar and Sumner (2020) examines the global distribution of multidimensional poverty by using different methods and suggest that rural and young population are among the most deprived groups of their society.
As much as the empirical literature is dominated by country-level studies to measure multidimensional poverty, regional dimension receives rising interest and draws attention (Ravallion 1996). Examples include Bidani and Ravallion (1993) among the Indonesian regions and Ningaye et al. (2011) in Cameroon, Mahadevan and Jayasinghe (2019) in Sri Lanka and Alkire and Fang (2019); Li et al. (2019), Zhang et al. (2020) in China. These regional studies confirm the existence of substantial poverty variation at the regional level.
Motivated by the recent advances in both theoretical and empirical literature on multidi-mensional poverty, this study examines the spatial distribution of multidimultidi-mensional poverty in Turkey. Prior evidence for Turkey highlights the importance of non-monetary factors to assess the extent of real poverty (Buğra and Keyder 2003; Kalaycioglu 2006; Karadağ and Saraçoğlu 2015). Even multidimensional approaches start to receive attention in Tur-key, our knowledge is confined to country-level analysis (Acar 2014; Acar et al. 2017). Although Limanli (2016) highlights the importance of regional dimension by using the AF approach, regional coverage is still broad (i.e. geographical rather than economic) and no detailed decomposition has been carried out in order to assess the spatial variability of multidimensional poverty.3
The regional dimension of poverty is important. As a developing country example, Tur-key historically realizes a dual structure in various dimensions of its social and economic characteristics (Dogruel and Dogruel 2003; Karahasan 2020). The dichotomy observed in Turkey is characterized in the form of developed west and underdeveloped east for decades. 3 Betti et al. (2013) use the fuzzy set approach and examine the regional dimension of multidimensional poverty at regional scale in Turkey. Results remark the existence of regional differences in multidimen-sional poverty at NUTS I level (12 Regions).
Moreover, the historical evolution of disparities also shows that in addition to monetary inequalities, other aspects of regional development are spatially dissimilar in Turkey. While Erdem (2016) shows the spatial variation in the educational human capital development, Karahasan and Bilgel (2019) emphasize the presence of spatial heterogeneity in access to healthcare system. Both of these studies remark the endogenous spillover among differ-ent dimensions of regional duality in Turkey. In a recdiffer-ent study, Karahasan et al. (2019) combine different non-monetary and monetary aspects of regional disparities in a single measure and show that regional duality in Turkey is beyond the univariate influence of individual factors. We argue that this approach shows the importance of combining differ-ent dimensions of the regional disparities which will enable us to explore the real sources of regional inequality and poverty.
A closely related dimension is the instrumental influence of distributive politics in Tur-key. As argued in Luca and Rodríguez-Pose (2015), Luca (2016), Luca and Rodríguez-Pose (2019), electoral outcomes affect regional growth and public investment. Regions vot-ing for the incumbent realize more regional growth and receive more public investment. This make one think of the place of distributive politics on certain public investments in education, health and infrastructure, among others. Supporting these early remarks, recent discussions confirm that the improvement in certain public services affects the voting pat-tern. For instance Marschall et al. (2016) examined the impact of public housing poli-cies by pointing out that access to public housing has a strong effect on voting patterns. Recently, Adiguzel et al. (2020) examined the impact of healthcare reform of the post-2000s and underlined that falling distance to family housing centers increases the voting for the incumbent political parties in Turkey. More remarkably, this influence is observed to be higher among the less-educated individuals. These examples show that public policy disproportionately affects the poor individuals with initially disadvantageous conditions (less education, less access to finance among others). Therefore, central government imple-mentations affect the deprivation level of individuals and exhibit spillover effects on voting patterns. This suggests that distributive politics and social policies are inter-alia related in countries with unstable political environment. While this stands as an important motiva-tion for the investigamotiva-tion of Turkey as an example, it is also essential in order to discuss the policy dimension of poverty in detail.
Our screening of the literature highlights a number of important contributions of our research beyond the Turkish literature. First, even though the literature examining the mul-tidimensional poverty is growing, our knowledge of the spatial dimension is limited, espe-cially for countries with significant spatial instabilities. More remarkably, decomposition of poverty is vital for policies dealing with poverty reduction; however, a detailed decom-position analysis along with demographic stratification of regions has not been carried out lately. To our knowledge, calculating MPI at the regional level and analyzing the sources through various decomposition analyses have not been carried out so far.
3 Empirical Strategy
3.1 Data
In order to account for non-monetary factors that influence poverty, we use individual and household-level data that comes from the Survey on Income and Living Conditions (SILC) administered by the Turkish Statistical Office (TurkStat) since 2006 (SILC-Turkstat 2017).
The survey keeps track of a detailed account of information on housing, economic situa-tion, social exclusion, real estate ownership, educasitua-tion, demography, health status, labor status and income status on individuals above the age of 15. The survey uses a two-stage stratified cluster sampling method based on Address-based Population Registry System. The primary sampling units consist of clusters (blocks) of approximately 100 dwelling addresses and are defined as the sampling frame of EU-SILC. The secondary sampling units consist of 10 clusters from each of the rural and urban residential areas. The only information about the SILC design is the sampling weights, which are based on recent population projections.
Individual and household-level data on the cross-sectional SILC are available for the 2011–2017 period and produces reliable estimates for the entire county and at the NUTS I level (12 regions). Starting on 2014, the sample size has been gradually increased in order to produce reliable estimates at the NUTS II level (26 regions). Throughout our analyses, we focus on the geographical dimension of poverty and use the SILC for the years 2014 to 2017 to produce reliable estimates at the NUTS II level (see Fig. 1).
SILC enables us to account for a number of variables on household and individual-level non-monetary factors. Household-level variables in the SILC include the type of residence, (property) ownership, heating and residential facilities, while the individual-level variables include age, gender, schooling, marital status, overall health status, employment status and other economic activity. The SILC data is recoded to make it compatible with the AF methodology, such that a total of 4 domains (housing, environment, education and health) and a total of 16 binary dimensions have been identified to be used in the AF approach. The individual is considered deprived (not deprived) in each of the 16 dimensions if the dimension takes the values of 1 (0). The selection of domains are dimensions are central to MPI construction. Both OPHI (2013) and UNDP (2020) give a general view for the main domains of multidimensional poverty. Within these domains, determining the most related dimensions requires a careful inspection of the survey. Following the early remarks of Alkire and Foster (2011a), OPHI (2013) we use a number of dimensions such as years of schooling and mandatory schooling enrollment, which are central and inclusive meas-ures of education. Moreover, we use self-rated health, chronic illness and unmet healthcare Fig. 1 NUTS II Regions of Turkey
needs as inclusive indicators for health in the SILC. Considering housing and environment domains, the dimensions are selected based on prior literature (Berenger 2019). While it would not be possible to use the exact set of variables of interest in the prior literature, we use the best applicable indicators for these dimensions based on data availability at the individual and household level.4
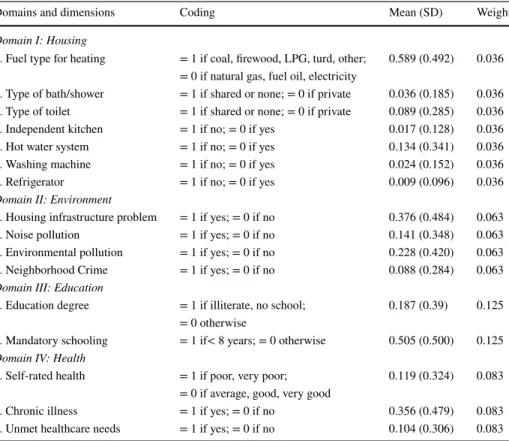
The SILC sample consists of 58, 744, 57, 942, 59, 662 and 60, 525 individuals, respec-tively for each sample year from 2014 to 2017 for a total of 236, 873 observations. Domain I: Housing and Domain II: Environment respectively consist of 7 and 4 dimensions that were recoded using the household-level data; and Domain III: Education and Domain IV: Health respectively consist of 2 and 3 dimensions that were recoded using the individual-level data. Table 1 shows the domains, the dimensions under each domain, the coding of the variables used in the analysis, the descriptive statistics for the 2014-2017 period and the individual weights of each dimension for the MPI calculations.5
Table 1 Descriptive statistics and the coding of variables, SILC 2014–2017
N= 236,873. The individual is considered deprived (not deprived) if the dimension takes the value of 1 (0).
The sum of weights adds up to 1.003 due to rounding
Domains and dimensions Coding Mean (SD) Weight
Domain I: Housing
1. Fuel type for heating = 1 if coal, firewood, LPG, turd, other; 0.589 (0.492) 0.036 = 0 if natural gas, fuel oil, electricity
2. Type of bath/shower = 1 if shared or none; = 0 if private 0.036 (0.185) 0.036 3. Type of toilet = 1 if shared or none; = 0 if private 0.089 (0.285) 0.036
4. Independent kitchen = 1 if no; = 0 if yes 0.017 (0.128) 0.036
5. Hot water system = 1 if no; = 0 if yes 0.134 (0.341) 0.036
6. Washing machine = 1 if no; = 0 if yes 0.024 (0.152) 0.036
7. Refrigerator = 1 if no; = 0 if yes 0.009 (0.096) 0.036
Domain II: Environment
1. Housing infrastructure problem = 1 if yes; = 0 if no 0.376 (0.484) 0.063
2. Noise pollution = 1 if yes; = 0 if no 0.141 (0.348) 0.063
3. Environmental pollution = 1 if yes; = 0 if no 0.228 (0.420) 0.063
4. Neighborhood Crime = 1 if yes; = 0 if no 0.088 (0.284) 0.063
Domain III: Education
1. Education degree = 1 if illiterate, no school; 0.187 (0.39) 0.125 = 0 otherwise
2. Mandatory schooling = 1 if< 8 years; = 0 otherwise 0.505 (0.500) 0.125
Domain IV: Health
1. Self-rated health = 1 if poor, very poor; 0.119 (0.324) 0.083
= 0 if average, good, very good
2. Chronic illness = 1 if yes; = 0 if no 0.356 (0.479) 0.083
3. Unmet healthcare needs = 1 if yes; = 0 if no 0.104 (0.306) 0.083
5 See Section A.1 of the “Appendix” for further details.
4 We implemented further exercises by including additional dimensions and ended up with virtually similar spatial patterns and results. These results are available upon request.
We use the equal weight principle in order to determine the importance of each domain and dimension. Among others Cherchye et al. (2008), Permanyer (2011), Foster et al. (2013), Pinar et al. (2013), Tofallis (2013), Athanassoglou (2015) underline the importance of weight choice as a central point for multidimensional index construction. While using equal weights is central to most of the applied studies (Alkire and Foster 2011a), it gives some level of arbitrariness in the process of MPI calculation. However, our central aim is to see the geographical distribution of multidimensional poverty and not the extent of the deprivation. Moreover, we argue that the variability of MPI based on weight determina-tion can be traced by focusing on the geographical distribudetermina-tion of dimension contribudetermina-tions. Once we determine the geographical distribution of dimension contributions, we are able to observe similarities in some of the dimensions (see Figure A.5 in the “Appendix”). Cer-tainly, there are additional random and dissimilar patterns which may shed light on the heterogeneous influence of these dimensions.6
SILC enables us to consider a number of individual and household demographic charac-teristics, which are essential elements in the decomposition analyses. We are aware of the fact that age and gender are important demographic characteristics that influence poverty at the regional level. Moreover, we acknowledge that the time dimension of such analyses is vital as generational effects can be a crucial aspect of multidimensional poverty (Vijaya et al. 2014; Klasen and Lahoti 2016; Espinoza-Delgado and Silber 2018). The follow-up of a given generation throughout the sample period would be an insightful exercise. How-ever, for the fact that our survey data is cross-sectional and does not keep track of the same individual through time, it proves not possible to trace the same individual in a given gen-eration. Another alternative would be to group individuals in a given generation and track the multidimensional poverty of that specific generation (i.e. a comparison of MPI of the individuals within the 15–18 age cohort in 2014 with those within the 18–21 age cohort in 2017). Given the short time dimension of our survey data, we opt to conduct a decomposi-tion analysis for a given age cohort at different periods in our sample in lieu of following the evolution of MPI for a given generation. We leave the alternative analyses of genera-tional effects for a subsequent research where we aim to use NUTS I level or country-level data in return for a longer time period.7
3.2 Methodology
We start-off by calculating a regional MPI using the AF methodology of Alkire and Foster (2011a, 2011b), built upon the Foster-Greer-Thorbecke index of poverty of Foster et al. (1984). Let N be the sample size, D be the number of deprivation indicators, Y be a N × D matrix with elements yij denoting the level of indicator j for individual i, 𝐳 be a 1 × D vector
of deprivation cutoffs used to determine if a person is deprived in each of the D dimensions with elements zj being the cutoff for indicator j and 𝐰 be a 1 × D vector of weights to assess
the relative importance of each indicator, such that ∑D
j=1 wj= 1 . Individual i is said to be
deprived in indicator j when yij<zj.
Two aspects of multidimensional poverty in the AF framework are the incidence of poverty (H) and the breadth of simultaneous deprivation (A). While the former is the 6 See Sect. 5 for further discussions on the cutoff and weight assignments.
7 In order to increase the time dimension, we are required to work with SILC that has representation level at a broader disaggregation level. This contradicts our central aim, which is the examination of the geo-graphical dimension of multidimensional poverty.
proportion of people who have been identified as multidimensionally poor in the popu-lation, the latter is the average share of weighted indicators in which poor people are deprived (Alkire et al. 2015):
where q is the number of individuals identified as poor, k is the poverty cutoff where 0 <k < 1 , 𝐠0(k) is a N × D matrix, called the censored deprivation matrix whose entries
are given by g0
ij = wj if yij<zj and 0 otherwise and ∣ 𝐠0(k) ∣ is the sum of deprivation scores
(i.e sum of all elements of the deprivation matrix, 𝐠0(k) ). The row sum of 𝐠0 becomes the
minimum number of weighted indicators that the individual must be deprived from in order to be defined as multidimensionally poor, ci=
∑D
j=1g
0
ij . The joint use of weights, 𝐰 ,
to assign the importance of each indicators and the poverty cutoff, k, to assign who is to be treated as poor, is known as the “dual cutoff approach” of the AF methodology on MPI.
The Alkire-Foster multidimensional poverty measure, M0 , accounts for both the
inci-dence of poverty and the breadth of deprivation:
An important property of M0 is the perfect decomposability, that is, M0 can be obtained as
the weighted average of MPIs for the subgroups (e.g. by gender, race, age or geographic location), M0,g where the weights correspond to the ratio of the subgroup population size,
Ng to total population size, N:
As long as the groups are mutually exclusive and collectively exhaustive, the percentage of contribution of group g to the overall MPI is therefore:
Perfect decomposability also ensures that the AF measure of multidimensional poverty can be decomposed by indicators of deprivation as well. Let ∣ 𝐠0
j(k) ∣ be the sum of elements of
the jth column of 𝐠0(k) . Then, the AF multidimensional poverty measure can be written as:
The percentage of contribution of indicator j to the overall MPI is therefore8:
(1) H =q N (2) A =∣ 𝐠 0(k) ∣ q (3) M0= ∣ 𝐠0(k) ∣ N = H × A (4) M0= G ∑ g=1 Ng NM0,g (5) C0,g= (N g N )(M 0,g M0 ) (6) M0= D ∑ j=1 ∣ 𝐠0j(k) ∣ N
The choice of the dimensions (D) to calculate M0 and the indicators to be included under
each dimension hinges upon data availability. Regarding the unit of observation, the MPI should ideally use the individual to allow intra-household inequalities and to decompose poverty by age and gender (Alkire and Santos 2014). When the diversity of individual-level dimensions is not entirely inclusive, we use household-individual-level dimensions complemen-tarily. Upon the inspection of the dataset structure of the SILC for the year 2014 through-out 2017, the available individual-level domains are education and health. Since the SILC also includes information on households, two additional domains at the household-level are housing and environmental exposure.
Together with individual information on gender and age, our methodology also enables to decompose poverty by gender and age or age groups or by the indicators used under each domain to assess the primary drivers of multidimensional poverty in Turkey.
4 Results
4.1 Benchmark Results
Panel A of Table 2 reports the national MPI estimates. First, the cutoff criteria concerns dimension-based deprivations where a binary coding is used (See Table 1). Second, in order to decide whether an individual is poor or not, a cutoff level of 0.5 is employed in our benchmark analyses (i.e. the individual is deprived in half of the dimensions in order to be identified as poor). As discussed in Alkire and Foster (2011b) the choice of the cutoff level contains some level of arbitrariness and should be subject to robustness and sensitiv-ity analyses. Therefore, we carry out a sensitivsensitiv-ity analysis using alternative cutoff levels in Sect. 4.2.
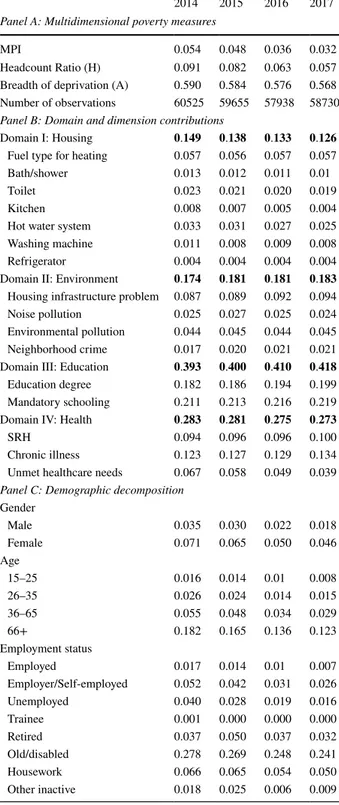
During the 2014–2017 period, there was a slight decline in the MPI and the proportion of individuals deprived (H) based on our selected cutoff criteria of 0.50. As highlighted before, one important property of MPI calculation is the ability of the measure to point out the contribution of different domains and dimensions. In Panel B of Table 2, we pro-vide the contribution of each domain to the national MPI calculations. Results show that each domains’ contribution is persistent between 2014 and 2017. However, education and health deprivations dominate the MPI construction. Domain III: Education and Domain IV: Health respectively contributes to the MPI by 41 and 28 percent, on average. On the other hand, Domain I: Housing and Domain II: Environment have limited impact around 14 and 18 percent on average, respectively. In Panel B of Table 2, we further investigate the contribution of each individual dimension to the overall MPI construction. The most important dimensions are found to be the fuel type for heating and hot water system under Domain I. Housing infrastructure under Domain II, mandatory schooling under Domain III and chronic illness under Domain IV are the largest contributors to MPI.
All these elements of the MPI construction can be further investigated by decom-posing the MPI, based on a host of demographics of the population (e.g. gender, age, employment status). Our choice for the demographic characteristics are primarily moti-vated by gender-based disparities in Turkey that place women at a disadvantageous posi-tion. We complement this first pillar by age cohorts and employment status. As an initial
(7)
CI0,j=
∣ 𝐠0
j(k) ∣
Table 2 Country-level MPI 2014 2015 2016 2017
Panel A: Multidimensional poverty measures
MPI 0.054 0.048 0.036 0.032
Headcount Ratio (H) 0.091 0.082 0.063 0.057
Breadth of deprivation (A) 0.590 0.584 0.576 0.568 Number of observations 60525 59655 57938 58730
Panel B: Domain and dimension contributions
Domain I: Housing 0.149 0.138 0.133 0.126
Fuel type for heating 0.057 0.056 0.057 0.057
Bath/shower 0.013 0.012 0.011 0.01
Toilet 0.023 0.021 0.020 0.019
Kitchen 0.008 0.007 0.005 0.004
Hot water system 0.033 0.031 0.027 0.025
Washing machine 0.011 0.008 0.009 0.008
Refrigerator 0.004 0.004 0.004 0.004
Domain II: Environment 0.174 0.181 0.181 0.183 Housing infrastructure problem 0.087 0.089 0.092 0.094
Noise pollution 0.025 0.027 0.025 0.024
Environmental pollution 0.044 0.045 0.044 0.045 Neighborhood crime 0.017 0.020 0.021 0.021 Domain III: Education 0.393 0.400 0.410 0.418
Education degree 0.182 0.186 0.194 0.199
Mandatory schooling 0.211 0.213 0.216 0.219
Domain IV: Health 0.283 0.281 0.275 0.273
SRH 0.094 0.096 0.096 0.100
Chronic illness 0.123 0.127 0.129 0.134
Unmet healthcare needs 0.067 0.058 0.049 0.039
Panel C: Demographic decomposition
Gender Male 0.035 0.030 0.022 0.018 Female 0.071 0.065 0.050 0.046 Age 15–25 0.016 0.014 0.01 0.008 26–35 0.026 0.024 0.014 0.015 36–65 0.055 0.048 0.034 0.029 66+ 0.182 0.165 0.136 0.123 Employment status Employed 0.017 0.014 0.01 0.007 Employer/Self-employed 0.052 0.042 0.031 0.026 Unemployed 0.040 0.028 0.019 0.016 Trainee 0.001 0.000 0.000 0.000 Retired 0.037 0.050 0.037 0.032 Old/disabled 0.278 0.269 0.248 0.241 Housework 0.066 0.065 0.054 0.050 Other inactive 0.018 0.025 0.006 0.009
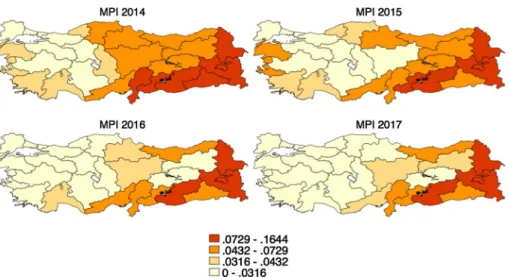
exercise, we carry out a decomposition analysis at the country level. In Sect. 4.3, a decomposition is carried out for selected characteristics at the local level. Initial results, given in Panel C of Table 2, highlight that females are more deprived relative to males. While MPI is declining for both genders, female deprivation levels are higher through-out the sample period. The decomposition of the MPI, based on age groups, shows that oldest individuals exhibit the highest deprivation levels. This finding matches with the importance of health-based deprivations, detected in Panel B of Table 2. Finally, for the Fig. 2 Spatial Distribution of Multidimensional Poverty Index (cutoff: 0.5). Notes: The legend shows fixed quantile thresholds of the year 2014. Higher MPI values indicate severer multidimensional poverty. Source: SILC-Turkstat (2017), authors’ own calculations
Fig. 3 Spatial Distribution of Headcount Ratio (cutoff: 0.5). Notes: The legend shows fixed quantile thresh-olds of the year 2014. Source: SILC-Turkstat (2017), authors’ own calculations
employment status, the old and disabled individuals exhibit the highest contribution to the MPI, followed by those engaged in housework.
For the fact that we are primarily interested in the topography of multidimensional poverty, we calculate a MPI for each of the 26 NUTS II regions. Figures 2 and 3 respec-tively show the geographical distribution of MPI and the proportion of deprived individu-als.9 The share of deprived individuals and the MPI decline during the 2014–2017 period.
However, the spatial dimension of poverty is extremely persistent. For all years consid-ered, the MPI and the headcount ratio are higher among the eastern regions. This pattern is aligned with the historical duality across the Turkish geography (Dogruel and Dogruel
2003; Karahasan and Bilgel 2018a). There is a belt extending from Northwestern regions towards Central Anatolia that realizes the lowest multidimensional poverty. On the con-trary, eastern and specifically southeastern regions suffer from multidimensional poverty to a significant extent. Northeastern as well as southern regions realize a multidimensional poverty above the country average. During this short period, we found no evidence for an overall reshuffling of poverty across the Turkish regions albeit there are some eastern regions (i.e. TRB1) that experience diminishing multidimensional poverty. Rather, certain eastern regions become more isolated and polarized in terms of multidimensional poverty.
In line with our analyses on the contribution of domains/dimensions, we further inves-tigate the regional dimension of each domains’ contribution and its spatial distribution in Fig. 4 where the domain contributions and their spatial distributions are color-coordi-nated.10 We first focus on the average contributions of each domain for the sample period.
Figure 4a shows that domains III and IV have the largest impact on multidimensional pov-erty for almost all regions while the impact of domains I and II are rather limited. These results highlight that education and health are the largest contributors to multidimensional poverty but the impact of housing and the environment are relatively limited. This finding confirms that the contribution of each domain is of similar magnitude once country-level and regional MPI are considered.
Even though the relative importance of each domain in a given region is similar, its impact may be spatially varying across the geography. The spatial distribution of each domain is plotted in Fig. 4b showing that a uniform pattern does not exist. Domain I: Hous-ing exhibits the largest impact on Eastern regions, albeit there are exceptions and Domain II: Environment exhibits the largest impact over metropolitan urban areas such as Istanbul, Ankara and Izmir, followed by Eastern regions. On the other hand, the results are mixed for Domain III: Education and Domain IV: Health. The largest contributions of Domain III (Domain IV) are observed for Northern and Eastern (Central Anatolian) regions. A careful inspection shows that the impact of education to MPI is very limited among the developed coastal regions in the south and west, followed by the Marmara region. In general, the con-tribution of education to MPI is more visible across the eastern regions as well as some of the northern regions. Interestingly, the impact of health to MPI is lower among the eastern regions, while most of the impact originates from central regions.
9 Our spatial analyses throughout the sample period are plotted with a fixed quantile thresholds in order to provide both an interregional and an intertemporal comparison. It is also possible to have individual quan-tiles for each year and make a comparison just focusing on the interregional dimension. These figures yield comparably similar results and are available from the authors upon request.
10 Additionally, we investigate the spatial distribution of dimension contribution to MPI in Sections A.3 and A.4 of the “Appendix”.
This spatially varying pattern of domain contributions is crucial for a number of differ-ent reasons. In general, our findings indicate that education and health are leading domains that influence MPI at the regional level. That said, there is some sort of a spatial vary-ing influence once the geographical distribution of each domains’ influence is observed. This highlights the importance of policy selectivity as the influence of each domain is not the same across the regions of Turkey. For instance, the relative importance of housing is Fig. 4 Domain contributions by NUTS II regions (2014–2017 averages) Source: SILC-Turkstat (2017), authors’ own calculations
stronger among the less-developed eastern regions. Considering environment, the contribu-tion is higher among the developed and urbanized areas in the west. Interestingly, there is even more spatial variability for the most important dimensions of education and health. The importance of education at the regional level is stronger for the less-developed eastern regions. That said, the contribution of health domain in the MPI calculations is higher in central regions. These results show that one size fits all-type common social policies (i.e. health and education) will not have the same influence on poverty at regional level. While education-based policies would be more effective for eastern regions, policy implemen-tations to improve health conditions will have more impact on central regions (a weaker effect for the less developed eastern regions). These findings suggest the necessity to con-sider regional and flexible social policies to combat poverty, rather than a centralized and one size fits all-type common policies.11
In order to have a detailed overview of demographic decomposition, we further inves-tigate the differences in domain contributions for a selected demographic group (Gender). Figure 5 shows the average contribution of each domain by gender. Again, domains III and IV have the largest contribution to multidimensional poverty, followed by domains II and I. The contributions are comparably similar across gender under each domain. In all domains except III: Education, the average contribution by males is slightly higher than that of females by a margin of about 0.5 to 1.5 percentage points. As for domain III: Edu-cation, the converse is true and the average contribution by females is higher by about 3.5 percentage points than males.
An important aspect of our analyses is the comparability of MPI calculations against official monetary poverty statistics. We consider two monetary poverty measures for this purpose: relative and absolute poverty rates . While the former measure is based on the percentage of individuals below the 50 percent of the regional median income, the latter is based upon 50 percent of the national median income.12 Table 3 reports the major
descrip-tive statistics. One common finding is that both the MPI and the reladescrip-tive poverty show a decline during the 2014-2017 period. On the other hand, absolute poverty rates remain Fig. 5 Domain contributions by
gender (2014–2017 averages)
Source: SILC-Turkstat (2017), authors’ own calculations
11 We would like to thank an anonymous referee for pointing this out.
12 Note that, we use the poverty cut-off line that has not been adjusted for PPP. Spatial patterns with PPP adjusted figures are virtually the same and available upon request.
stagnant. Another important difference lies behind the spatial dependence of poverty meas-ures.13 Although the absolute monetary poverty and multidimensional poverty figures are
very close to one another, the strength of spatial dependence, captured by the Moran’s I, is much higher for the MPI and headcount ratio throughout the sample period, relative to that of the absolute monetary poverty. Above all, relative poverty distribution is spatially random compared to both absolute and multidimensional poverty measures. The similarity between the MPI and absolute poverty rates in Table 3 are staggering. This is not surpris-ing because MPI is an absolute measure of poverty and a given population may have a high rate of relative poverty yet most of the population may have income levels above the absolute poverty threshold. Therefore, a comparison against an absolute monetary poverty measure is more appropriate.14 These descriptive comparisons point out that regional
dis-parities in poverty becomes more visible once non-monetary dimensions are included. The spatial distribution of relative and absolute poverty rates for the 2014–2017 period is given in Fig. 6. Vis-à-vis Fig. 2, the difference in the spatial distribution of relative Table 3 Comparison of monetary and non-monetary poverty
N = 26 . Relative (absolute) poverty is based upon 50 percent of the regional (national) median income.
Absolute poverty rates are not adjusted by PPP. The global Moran’s I employs an inverse distance spatial weight matrix. * and *** respectively denote statistical significance at 1 and 10 percent levels
Mean (SD) Min Max Range CoV Moran’s I [s.e]
2014
Relative Poverty Rate 0.105 (0.025) 0.063 0.153 0.090 0.235 − 0.016 [0.038] Absolute Poverty Rate 0.038 (0.035) 0.003 0.161 0.158 0.919 0.126***[0.035] Headcount Ratio 0.095 (0.064) 0.020 0.269 0.249 0.669 0.259***[0.037]
MPI 0.056 (0.039) 0.011 0.164 0.153 0.700 0.254***[0.037]
2015
Relative Poverty Rate 0.105 (0.020) 0.053 0.141 0.088 0.190 − 0.090*[0.037] Absolute Poverty Rate 0.038 (0.037) 0.006 0.175 0.169 0.954 0.087***[0.033] Headcount Ratio 0.086 (0.057) 0.015 0.242 0.227 0.668 0.215***[0.037]
MPI 0.050 (0.035) 0.008 0.146 0.138 0.697 0.210***[0.037]
2016
Relative Poverty Rate 0.104 (0.024) 0.051 0.159 0.108 0.227 − 0.062 [0.037] Absolute Poverty Rate 0.038 (0.037) 0.004 0.173 0.169 0.963 0.090***[0.033] Headcount Ratio 0.068 (0.049) 0.009 0.211 0.202 0.733 0.182***[0.036]
MPI 0.039 (0.029) 0.005 0.126 0.121 0.757 0.176***[0.036]
2017
Relative Poverty Rate 0.093 (0.022) 0.053 0.132 0.079 0.234 − 0.036 [0.038] Absolute Poverty Rate 0.039 (0.041) 0.004 0.195 0.181 1.054 0.077***[0.032] Headcount Ratio 0.060 (0.042) 0.007 0.187 0.180 0.693 0.219***[0.037]
MPI 0.034 (0.024) 0.004 0.110 0.106 0.715 0.209***[0.036]
14 We would like to thank two of the anonymous referees for pointing this out.
13 The Moran’s I spatial autocorrelation statistic is used to test for spatial randomness.
I = (n∕s)(∑
iwij(xi− ̄x)(xj− ̄x)∕∑ �xi− ̄x
�2
)where n is the number of cross-sections, s is the summation of all the elements wij of the weight matrix W of provinces i and j where W is defined as an inverse distance
poverty (Fig. 6a) and non-monetary poverty measures is staggering. The rank correlation between relative and non-monetary poverty indicators show statistically insignificant rela-tionships (Spearman’s 𝜌 [p-value] are 0.24 [0.2301], 0.1472 [0.4731], −0.0394 [0.8485], −0.1228 [0.5502] from 2014 to 2017 respectively.). The spatial pattern of MPI is aligned Fig. 6 Spatial Distribution of Monetary Poverty Rate. Notes: The legend shows fixed quantile thresholds of the year 2014. Higher values indicate severer poverty. Both poverty measures are based upon 50 percent of the median income. Absolute poverty rates are not adjusted by PPP. Source: SILC-Turkstat (2017)
with our knowledge on regional disparities, while the spatial distribution of relative pov-erty rate does not fit in any of the known regional disparity patterns in Turkey. In contrast, multidimensional poverty and absolute monetary poverty rates (Fig. 6b) exhibit extremely similar geographical patterns and the rank correlation between the two indicates that both measures are strongly and statistically dependent (Spearman’s 𝜌 [p-value] are 0.64 [0.0005], 0.68 [0.0001], 0.62 [0.0008], 0.56 [0.0028] from 2014 to 2017 respectively.)
4.2 Sensitivity Analysis
An important input of MPI calculation is the cutoff determination. Therefore, it is crucial to test whether MPI calculation is sensitive to the selected cutoff level. We perform a sen-sitivity analysis based on two different cutoff levels (0.30 and 0.70) to test the geographical sensitivity of our results to the constraints imposed on the deprivation level of individuals.
We first perform a sensitivity analysis at country level. Results are reported in Table 4. Similar to earlier analyses and regardless of the selected cutoff levels (0.3 and 0.70), Table 4 Sensitivity Analysis
Cut-off: 0.30 Cut-off: 0.70
2014 2015 2016 2017 2014 2015 2016 2017
Panel A: MP measures
MPI 0.146 0.138 0.117 0.114 0.007 0.005 0.003 0.001
Headcount Ratio (H) 0.329 0.315 0.274 0.269 0.009 0.007 0.004 0.002
Breadth of deprivation (A) 0.443 0.438 0.428 0.422 0.754 0.748 0.744 0.737
Panel B: Contributions
Domain I: Housing 0.139 0.126 0.119 0.113 0.188 0.173 0.166 0.165
Fuel type for heating 0.069 0.067 0.068 0.067 0.047 0.047 0.047 0.047
Bath/shower 0.009 0.007 0.007 0.005 0.023 0.022 0.022 0.02
Toilet 0.019 0.016 0.014 0.013 0.033 0.028 0.027 0.023
Kitchen 0.005 0.004 0.003 0.002 0.018 0.015 0.011 0.012
How water system 0.028 0.025 0.021 0.02 0.039 0.036 0.033 0.033
Washing machine 0.007 0.005 0.005 0.004 0.019 0.016 0.015 0.017
Refrigerator 0.002 0.002 0.002 0.002 0.009 0.007 0.011 0.014
Domain II: Environment 0.181 0.188 0.191 0.187 0.185 0.207 0.211 0.218 Housing infrastructure 0.088 0.091 0.095 0.094 0.078 0.081 0.082 0.082
Noise pollution 0.027 0.029 0.028 0.027 0.031 0.035 0.036 0.042
Environmental pollution 0.047 0.047 0.048 0.047 0.051 0.058 0.056 0.056
Neighborhood Crime 0.018 0.021 0.02 0.02 0.025 0.033 0.037 0.037
Domain III: Education 0.426 0.431 0.450 0.456 0.329 0.332 0.336 0.339
Education degree 0.16 0.162 0.171 0.174 0.163 0.165 0.167 0.17
Mandatory schooling 0.266 0.269 0.279 0.282 0.166 0.167 0.168 0.17
Domain IV: Health 0.254 0.255 0.239 0.244 0.298 0.288 0.288 0.287
SRH 0.067 0.069 0.064 0.065 0.1 0.098 0.094 0.1
Chronic illness 0.131 0.138 0.14 0.148 0.109 0.108 0.11 0.112
MPI and headcount ratio fall during the sample period. Additionally, the contribution of domains to MPI is insensitive to the chosen cutoff level.
Education and health deprivations have the highest influence on the formation of MPI during the sample period. Second, contribution of dimensions is similar as before, sug-gesting that the cutoff level has an impact on the size of deprivation and MPI but not the contribution of background factors.
The spatial distribution of MPI is given in Fig. 7a, b for a cutoff of 0.3 and 0.7, respec-tively. Compared to benchmark results with a cutoff of 0.5 shown in Fig. 2, the spatial Fig. 7 Sensitivity Analysis: Spatial Distribution of MPI. Notes: The legend shows fixed quantile thresh-olds of the year 2014. Higher MPI values indicate severer multidimensional poverty. Source: SILC-Turkstat (2017), authors’ own calculations
distribution is insensitive to changes in the cutoff level. However, the range of the regional MPI is larger for the 0.3 cutoff and smaller for the 0.7 cutoff compared to our benchmark estimates, with severer multidimensional poverty prevailing in the historically underdevel-oped and Kurdish-populated Eastern Anatolia, notwithstanding the spatial distributions of regional MPI are similar.
While our results give a rough idea about the spatial sensitivity, a related concern could be the sensitivity of the historical evolution of the distribution. For each year of our sam-ple, we implement a basic transition analysis using cutoff levels from 0.3 to 0.7 in 0.05 increments to assess whether each NUTS II region in our sample shifts across quantiles, following small increases in the level of the cutoff. The complete results of this analysis are provided in Section A.5 of the “Appendix”.
Using different cutoff levels does not change the distributional clustering of regions. There are, however, minor changes as some regions switch to adjacent poverty classes for certain cutoff levels. These transitions seem to be extremely limited and have a negligible effect. Overall, these findings support the argument that our baseline choice for the cutoff does not impinge upon our benchmark results.
4.3 Decomposition Analysis
The decomposition analysis of Sect. 4.1 shows that the realization of poverty within spe-cific segments of the society might be different. We are therefore interested in the degree of this variation across the NUTS II regions and perform a decomposition analysis by gender, age cohorts and employment status using the baseline cutoff level of 0.5. We first control for gender-based differences and then focus on the top two deprived segments of the soci-ety based on age and employment status of the sample.
The spatial distribution of MPI by gender is given in Fig. 8a, b respectively for males and females throughout the sample period with a fixed quantile thresholds as before in order to provide both an interregional and an intertemporal comparison. First, the spatial pattern of MPI by both genders almost perfectly mimics the spatio-temporal evolution of overall regional MPI. Eastern regions are clustered of highly deprived individuals who suf-fer from difsuf-ferent aspects of poverty. Notice that the spatial distribution of MPI depicts a very similar geographical composition across genders with higher MPI values reigning in the eastern and southeastern geography and an overall diminishing MPI throughout the sample period; yet the absolute values of the MPI differ to a significant extent, with severer multidimensional poverty among females compared to males for all quantiles. Additionally, there are certain western regions (Aegean geography) where females face higher poverty compared to males in the same region. Still, an overall comparison of gender decomposi-tion with the overall MPI figures highlights that the spatial distribudecomposi-tion of MPI is neutral to gender decomposition, notwithstanding the size of MPI is extremely sensitive to gender decomposition.
Next, we focus on old age groups where we report the highest multidimensional pov-erty.15 Figure 9a, b report the spatial distribution of MPI by age cohorts of 35–65 and
66+ respectively. For both age cohorts, the spatial distribution of MPI are similar to the overall multidimensional poverty distribution. The west-east duality becomes more
persistent for the age decomposition and in all poverty classes, individuals above the age of 65 are the ones that suffer from the highest deprivation.
Finally, we consider the employment status in Fig. 10a, b, where we focus on the extent of multidimensional poverty among individuals dealing with household activities and the old/disabled respectively. These two employment categories are the ones that Fig. 8 Decomposition Analysis: Spatial Distribution of MPI by Gender. Notes: The legend shows fixed quantile thresholds of the year 2014. Higher MPI values indicate severer multidimensional poverty. Source: SILC-Turkstat (2017), authors’ own calculations
we report the highest multidimensional poverty.16 Results highlight that regardless of
the employment status, clustering of poverty is high in far eastern Turkey. However, old/ disabled individuals are relatively more deprived compared to those dealing with house-work during the sample period. More remarkably, multidimensional poverty is above the country average in a number of western regions for the old/disabled.
Overall, the decomposition of MPI points out that poverty and the extent of depriva-tion share a spatial pattern, which almost perfectly mimics the overall multidimensional Fig. 9 Decomposition Analysis: Spatial Distribution of MPI by Age. Notes: The legend shows fixed quan-tile thresholds of the year 2014. Higher MPI values indicate severer multidimensional poverty. Source: SILC-Turkstat (2017), authors’ own calculations
16 The spatial distribution of MPI for the remaining employment status categories are available from the authors upon request.
poverty in Turkey. There are some exceptions; however this does not change the overall assessment on the geographical and demographic boundaries of multidimensional pov-erty in Turkey. Additionally, given the focus on demographic groups (top two deprived group for each segment), our results also contain information on the sources of non-monetary and multidimensional aspects of poverty in Turkey. Geographically, individ-uals that are deprived the most locate in the far east territory of the country. Given various characteristics of these individuals and regions, females, old individuals and economically isolated old, retired and disabled individuals are the ones that suffer most from the non-monetary aspects of deprivation and poverty. Our approach uses a number of different dimensions; therefore, multidimensional social policies are required in order Fig. 10 Decomposition Analysis: Spatial Distribution of MPI by Employment Status. Notes: The legend shows fixed quantile thresholds of the year 2014. Higher MPI values indicate severer multidimensional pov-erty. Source: SILC-Turkstat (2017), authors’ own calculations
to combat poverty across the already underdeveloped and most disadvantageous regions of Turkey.
5 Discussion
This paper investigates a recently growing line of literature on the non-monetary and mul-tidimensional aspects of poverty. Our geographic area of research, Turkey, suffered histori-cally from a dual economic structure (Dogruel and Dogruel 2003). A cross-country com-parison suggests that Turkey is one of the most adversely affected countries of the globe from spatial instabilities (Ezcurra and Rodríguez-Pose 2014). We focus on a period of rapid change and transformation in Turkey (post 2000s) during which spatial disparities have become even more persistent (Karahasan 2020). There is a growing discussion on the use of populist and monetary short-term social policies to combat poverty during this recent time period (Özdemir 2020). However, other aspects of individual capabilities rang-ing from education, health, standard of livrang-ing and environmental issues are relatively less investigated in Turkey. Earlier evidence suggests that health (Karahasan and Bilgel 2019) and education (Erdem 2016; Karahasan and Bilgel 2018b) are crucial aspects of regional disparities in Turkey. Moreover, standards of living at the regional level related to the envi-ronment and well-being receive a growing interest among scholars in Turkey (Eren and Aşıcı 2017, 2018). While these items are indispensable parts of regional inequalities in Turkey, they also motivate further discussions for developing countries combating various dimensions in terms of spatial instabilities. That said, our knowledge on the possible influ-ence of these aspects on individual deprivation and multidimensional poverty are lacking.
Therefore, our findings contribute to this growing body of discussions by expressing that a holistic measure (i.e. MPI) could capture the impact of different dimensions of indi-vidual capabilities to what is known as non-monetary and multidimensional poverty in Turkey. Turkey as a developing country that persistently suffer from regional disparities is an interesting case study not only for the ones interested in Turkey but also for a wider international audience as findings are expected to shed light on non-monetary development issues (i.e. health, education among others), which are essential elements for policy makers in other developing countries.
Our results show that multidimensional poverty accurately reflects the regional dispari-ties in Turkey. Our contribution lies in the observed spatial dissimilarity between monetary and non-monetary poverty measures. While we detect a relatively more homogeneous pat-tern for monetary poverty rate (with underdeveloped easpat-tern regions exhibiting the lowest regional poverty), multidimensional non-monetary poverty rates are highest among these underdeveloped regions. One has to keep in mind that monetary poverty rate is calculated based on a certain threshold level of the median income level of that region. This poten-tially undermines poverty rates in the already low income regions. However, multidimen-sional poverty rate does not suffer from this problem because it directly examines various aspects of the individuals residing in that region by offering a global poverty cutoff for the whole country. Therefore, MPI acts as a better tool in order to assess the extent of poverty problem in countries like Turkey.
The decomposition of MPI among domains/dimensions as well as the demographic characteristics of the population contain vital information for poverty reduction programs and policies at the spatial level. In terms of the domains, our results highlight that human capital-based deprivations are the highest: education and health are the ones that contribute
to MPI the most. At this stage, it is essential to name central policy implementations for these human capital dimensions. In terms of education, there has been a number of signifi-cant attempts directly related with the years of mandatory schooling before and after 2000s. As the post-2000s implementations are relatively new, reflections on educational outcomes have not been discussed yet. On the other hand, evidence shows that a longer period of mandatory schooling has a positive influence on health outcomes (Baltagi et al. 2019) and gender disparities (Kırdar et al. 2018) in the pre-2000. Habibi (2017) investigates the rising higher education capacity in Turkey and underlines the negative consequences stemming from over-education, which translates into a mismatch and unemployment in the labor market. Filiztekin and Karahasan (2015); Erdem (2016) also confirm that regardless of the policy shocks, there exists spatial heterogeneity in the distribution of educational human capital development, which mimics the underdeveloped east and developed west duality.
Considering health-based human capital development, one important landmark is the healthcare reform implemented during the post-2000s. The overall aim is to consolidate the healthcare system and to increase the sustainability of the long-term healthcare budget of Turkey. Among various tools, one important implementation is the Family Medicine Program and the Family Health Centers. The most important motivation of the program is access to healthcare. Even though access to the healthcare system both in primary and secondary levels are higher, this has a negligible influence on the health outcomes at the regional level (Karahasan and Bilgel 2019). Once again, eastern regions realize relatively lower health-based well-being compared to the western regions. A recent study highlights the rising influence of neoliberal policies on healthcare system in Turkey (Oguz 2020). The rising share of private hospitals, which is decoupled with the state-private partnerships, generates an inequality in healthcare access and health outcomes.
The relatively disadvantageous position of eastern regions in MPI is rooted in the neg-ative reflections of the education and health policies of the central government. From a broad perspective, we detect a negative correlation between public expenditures within a region and the MPI (− 0.31, − 0.29, − 0.29 and − 0.30 from 2014 to 2017 respectively). In general, this highlights that less developed and deprived regions realized relatively less public sources compared to their wealthier counterparts. Next, we focus on the reflections of public expenditure on local human capital development. For instance, the correlation between hospital numbers per population and MPI is − 0.47, − 0.44, − 0.55 and − 0.48 from 2014 to 2017 respectively. This means that regions with lower healthcare capacity face higher multidimensional poverty. For the case of education, we calculate the pupils per teacher in primary and secondary education. Once we compare pupils per teacher in primary education with MPI, the correlation is 0.66, 0.58, 0.49 and 0.51 from 2014 to 2017 respectively. For the case of pupils per teacher in secondary education with MPI, the cor-relation is 0.56, 0.46, 0.63 and 0.57 from 2014 to 2017 respectively. Again, this translates into the fact that regions with less education capacity (higher pupils per teacher) will have higher multidimensional poverty. In short, basic descriptive analyses show that healthcare and education system receive relatively less resources from the distribution. Alternatively, this could point out the ineffectiveness of the allocation of public funds at the regional level. Earlier remarks on the negative realization in education and health outcomes in less developed regions validate the existence of rising MPI in the far eastern geography of Turkey.
Standards of living and environmental factors, albeit crucial in certain regions, have limited influence on the overall multidimensional poverty of regions. The examination of the spatial distribution of domains and dimensions separately yields implications for local policies to combat poverty. However, we are only able to assess these variations at NUTS
II level at the moment, which acts as an important barrier to examine the influence of local and place-based policies. Given the importance of between and within disparities in coun-tries like Turkey, further attempt is required to combine the MPI methodology with more disaggregated layers (i.e. provinces and district).
Further interpretations show that demographic distribution of the population matters as well. Females, old/disabled and systematically excluded individuals from the labor market are the ones that suffer from multidimensional poverty the most. More remarkably, unlike the case-based differences in the spatial distribution of domain and dimension contribu-tions, the spatial distribution of MPI for these most disadvantageous segments of the soci-ety almost perfectly mimic the overall spatial distribution of MPI in Turkey. This suggests that policies targeting certain demographic groups will not only have influence on that group, but will also exhibit spillover effects toward the society.
From a broader policy perspective, our findings are in line with recent debates on the importance of non-monetary aspects of policies for poverty reduction. As highlighted by Goli et al. (2019), education and health are important domains to combat poverty and regional disparities. Our MPI decomposition suggests that education and health have the highest contributions to the overall MPI in Turkey. It should be noted that the economic background of the multidimensional poverty at the regional scale is beyond our scope. However, economic characteristics of countries such as openness, level of industrial devel-opment and institutional capacity are all crucial aspects of the effectiveness of policies for poverty reduction (Santos et al. 2019). While we do not directly control for these regional characteristics in our analyses, a careful review of the literature in Turkey confirms that the regions that suffer from multidimensional poverty the most are the ones with lower industrial production and openness in Turkey (Dogruel and Dogruel 2003). On the con-trary, regions with lower deprivation levels are relatively more open and realize higher economic activity. While this does not necessarily infer a causal link for Turkey, causal channels between regional characteristics and the extent of non-monetary aspects of mul-tidimensional poverty are worth investigating. Similarly, an additional dimension that pro-vides quasi-policy implications is the potential impact of immigration. The sizable influx of immigrants and their mobility in Turkey is a vital and intriguing aspect of multidimen-sional poverty. Currently, our survey data does not allow us to make a detailed analytical examination; yet we consider the immigration-poverty nexus as an important avenue for further research.
Finally, we have to underline the possible sensitivity of the results to cutoff and weight determination. Our sensitivity analyses in Sect. 4.2 and the “Appendix” point out that even though size of MPI changes, the geographical distribution is almost unaffected from the chosen cutoff level. Moreover, regions’ position within the distribution is not so much sen-sitive to the chosen cutoff level. In addition to cutoff determination, there are other aspects in the applied literature (See Catalán and Gordon (2019); Santos and Villatoro (2019) for a recent debate on MPI and its reliability over an example for Latin American countries.). Recent attempts examine the weight determination in MPI calculation suggesting that it might have an influence on the level of MPI (Catalán 2019; Pinar et al. 2020). While the level of arbitrariness in weight selection is acknowledged, it is not the level of MPI that matters but the geographical distribution that is central in the setup of our analyses. Addi-tional results provided in the “Appendix” give related insight on this issue. Figure A.5 in the “Appendix” shows the distribution of dimension contributions. One can have some idea about how the MPI will vary based on possible variation in the weight attributed to these dimensions. The geographical scope of MPI’s level variation upon different weight assign-ments is left for subsequent research and calls for an in-depth discussion (i.e. sociological,