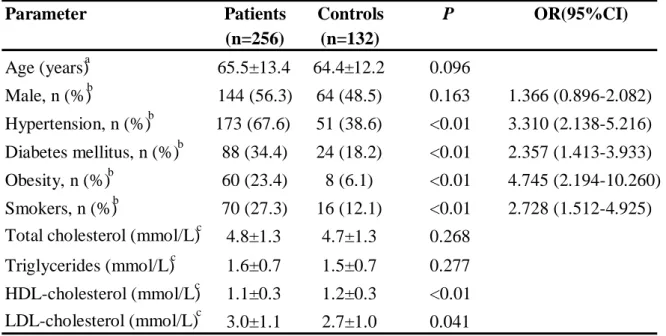
Table 1. Clinical laboratory data and conventional risk factors of ischemic stroke patients and controls.
Values are either number of subjects, percentage or mean ± SD.
a Mann Whitney U test is applied. b Chi-square test is applied.
c Independent Samples T-test is applied.
Parameter Patients Controls P OR(95%CI)
(n=256) (n=132) Age (years)a 65.5±13.4 64.4±12.2 0.096 Male, n (%)b 144 (56.3) 64 (48.5) 0.163 1.366 (0.896-2.082) Hypertension, n (%) b 173 (67.6) 51 (38.6) <0.01 3.310 (2.138-5.216) Diabetes mellitus, n (%) b 88 (34.4) 24 (18.2) <0.01 2.357 (1.413-3.933) Obesity, n (%) b 60 (23.4) 8 (6.1) <0.01 4.745 (2.194-10.260) Smokers, n (%)b 70 (27.3) 16 (12.1) <0.01 2.728 (1.512-4.925) Total cholesterol (mmol/L) c 4.8±1.3 4.7±1.3 0.268
Triglycerides (mmol/L) c 1.6±0.7 1.5±0.7 0.277 HDL-cholesterol (mmol/L)c 1.1±0.3 1.2±0.3 <0.01 LDL-cholesterol (mmol/L)c 3.0±1.1 2.7±1.0 0.041
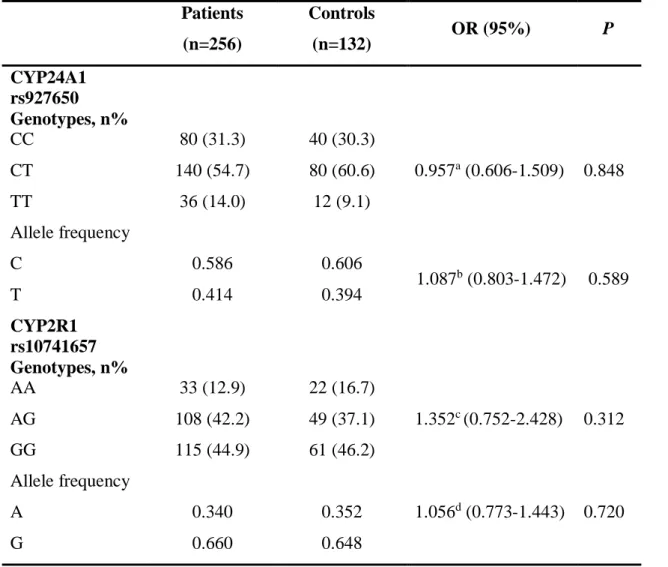
Table 2. Distribution of CYP24A1 rs927650 and CYP2R1 rs10741657 genotypes and allele frequencies inischemic stroke patients and controls.
Patients (n=256) Controls (n=132) OR (95%) P CYP24A1 rs927650 Genotypes, n% CC 80 (31.3) 40 (30.3) CT 140 (54.7) 80 (60.6) 0.957a (0.606-1.509) 0.848 TT 36 (14.0) 12 (9.1) Allele frequency C 0.586 0.606 1.087b (0.803-1.472) 0.589 T 0.414 0.394 CYP2R1 rs10741657 Genotypes, n% AA 33 (12.9) 22 (16.7) AG 108 (42.2) 49 (37.1) 1.352c (0.752-2.428) 0.312 GG 115 (44.9) 61 (46.2) Allele frequency A 0.340 0.352 1.056d (0.773-1.443) 0.720 G 0.660 0.648
Note: Values are either number of subjects (n) or percentages. Comparisons are by Chi-square test.aCT+TT vs.
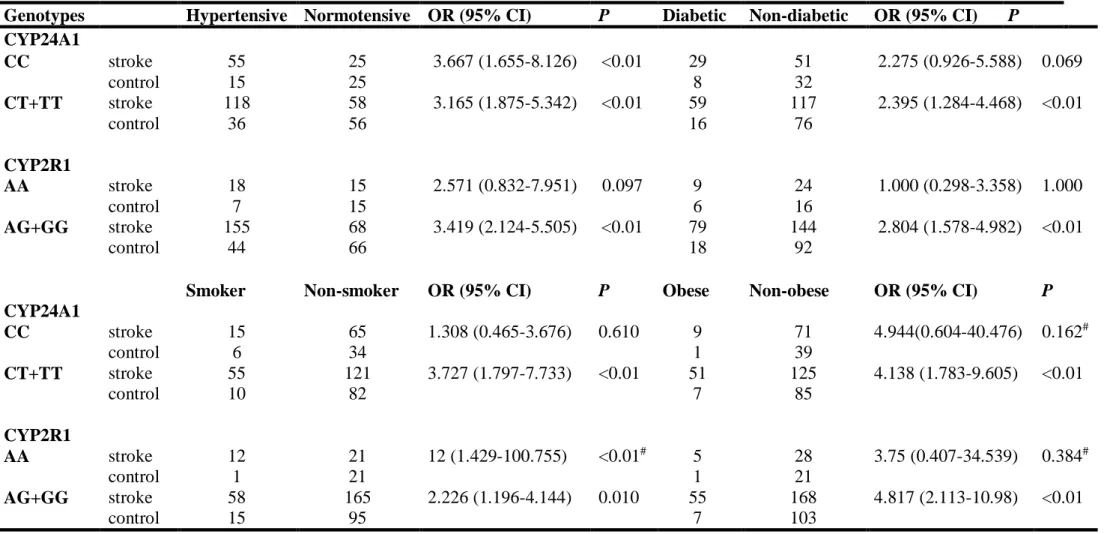
Table 3: Stratification of hypertensive/normotensive, diabetic/non-diabetic, smoker/non-smoker and obese/non-obese individuals according to CYP24A1 rs927650 and CYP2R1 rs10741657 genotypes and ischemic stroke-control status.
Given values in the stroke and control lines are number of subjects (n).
Comparisons are by Chi-square test except for those marked with #for whcih Fisher’s exact test was used.
Genotypes Hypertensive Normotensive OR (95% CI) P Diabetic Non-diabetic OR (95% CI) P
CYP24A1 CC stroke 55 25 3.667 (1.655-8.126) <0.01 29 51 2.275 (0.926-5.588) 0.069 control 15 25 8 32 CT+TT stroke 118 58 3.165 (1.875-5.342) <0.01 59 117 2.395 (1.284-4.468) <0.01 control 36 56 16 76 CYP2R1 AA stroke 18 15 2.571 (0.832-7.951) 0.097 9 24 1.000 (0.298-3.358) 1.000 control 7 15 6 16 AG+GG stroke 155 68 3.419 (2.124-5.505) <0.01 79 144 2.804 (1.578-4.982) <0.01 control 44 66 18 92
Smoker Non-smoker OR (95% CI) P Obese Non-obese OR (95% CI) P
CYP24A1 CC stroke 15 65 1.308 (0.465-3.676) 0.610 9 71 4.944(0.604-40.476) 0.162# control 6 34 1 39 CT+TT stroke 55 121 3.727 (1.797-7.733) <0.01 51 125 4.138 (1.783-9.605) <0.01 control 10 82 7 85 CYP2R1 AA stroke 12 21 12 (1.429-100.755) <0.01# 5 28 3.75 (0.407-34.539) 0.384# control 1 21 1 21 AG+GG stroke 58 165 2.226 (1.196-4.144) 0.010 55 168 4.817 (2.113-10.98) <0.01 control 15 95 7 103
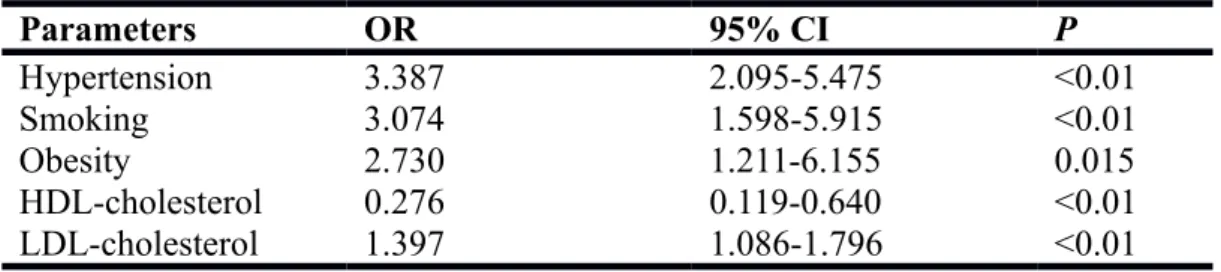
Table 4: Logistic regression analysis of vascular risk factors (age, sex, hypertension, smoking status, diabetes and obesity), lipid parameters (total cholesterol, TG, LDL-cholesterol and HDL-cholesterol), CYP24A1 rs927650 and CYP2R1 rs10741657 genotypes in ischemic stroke patients and controls.
Parameters OR 95% CI P Hypertension 3.387 2.095-5.475 <0.01 Smoking 3.074 1.598-5.915 <0.01 Obesity 2.730 1.211-6.155 0.015 HDL-cholesterol 0.276 0.119-0.640 <0.01 LDL-cholesterol 1.397 1.086-1.796 <0.01