Procedia - Social and Behavioral Sciences 191 ( 2015 ) 925 – 929
ScienceDirect
1877-0428 © 2015 The Authors. Published by Elsevier Ltd. This is an open access article under the CC BY-NC-ND license (http://creativecommons.org/licenses/by-nc-nd/4.0/).
Selection and peer-review under responsibility of the Organizing Committee of WCES 2014 doi: 10.1016/j.sbspro.2015.04.221
WCES 2014
Effect of Correction-for-Guessing Formula on Psychometric
Characteristics of Test
Selma Şenel
a, Emine Burcu Pehlivan
b, Betül Alatlı
c a Balıkesir University, Information Processing Research and Application Center, Balıkesir, Turkeyb Marmara University, Faculty of Education, Istanbul, Turkey cGaziosmanpasa University, Faculty of Education, Tokat, Turkey
Abstract
The purpose of this research is to determine if there are any differences in test and item statistics when the correction for guessing formula is used and not used in a Turkish reading comprehension test consists of multiple-choice items. Proposed study is a correlational research and the study group consists 123 8th grade students in a secondary school. For the stated purpose, a Turkish language test is generated which consists of 15 items all of them chosen among the Turkish items of Central Educational Institutions Student Selection and Placement Exam (OKÖSYS) and the Private Schools Examination (ÖOS). The first test application was conducted with the instruction of "correction for guessing formula will use for the test score". After a 30-day period, for impeding retention affect, same test applied with the “correction for guessing formula will not use for the test score" instruction. Student achievement, test and item statistics compared and interpreted according to the data obtained from both applications. Findings point out that there is a significant difference in test and item when statistics between the two applications of correction formula is used and not used. However the effect size was determined to be moderate. It has never been a significant difference on item statistics. Findings were discussed in context of related literature.
© 2014 The Authors. Published by Elsevier Ltd.
Selection and peer-review under responsibility of the Organizing Committee of WCES 2014.
Keywords: correction for guessing formula, item and test statistics, student achievement
1. Introduction
Various assessment and evaluation tools are used to measure and evaluate the achievement levels of students. It is
* Selma Şenel. Tel.:+023-321-321-321..
E-mail address: [email protected]
© 2015 The Authors. Published by Elsevier Ltd. This is an open access article under the CC BY-NC-ND license (http://creativecommons.org/licenses/by-nc-nd/4.0/).
extremely important to select the appropriate measurement tool for the behavior that would be measured. One of these tools that widely used is multiple-choice tests. Multiple choice tests are said to be more preferable than other measurement tools with their ease of applicability, usability with exams in different contents and objective scoring specifications (Öncü, 2003). One of the drawbacks of multiple choice tests is the probability of finding correct answer by guessing. When the respondents which none or partially have the measured behavior find the correct answer by guessing, chance effect may interfere to scores and this may adversely affect the reliability and validity of the test (Baykul, 2000). With the‘correction-for-guessing formula lay down by Thurstone (1919) and Holzinger (1924) (cited in Budescu & Bar-Hillel, 1993) it is aimed to eradicate the “chance achievement” involved in test scores. The formula is: “DTP = D Y / k – 1” which DTP is corrected test scores; D is the number of questions answered correctly, Y is the number of questions answered incorrectly, and k is the number of choices. However, it is not possible to state that possibility of refining test scores from chance effect or to reduce the achievement differences that occurred by chance effect between respondents with the correction interferences that will emerge with extract some of wrong answers from the count of correct answers or add some of blank items to the test score (Tekin, 2010). In general, the chance achievement is confused with the scores earned with partial knowledge. If a respondent is able to eliminate some of the choices of the question and and if he/she is able to find the correct answer with guessing on remaining choices, this is a different situation from ‘blind guess’ (Frary, 1980). Those who consider guessing for the correct answer as a problem thought that the solution is to discourage the responders from guessing with punishing them (Mehrens & Lehmann, 1984). To avoid guessing, adding an explanation to instruction like “If you don’t precisely know the answer of the item, you should not answer. Some of the wrong answers will extract from the count of correct answers.” is suggested. On the other hand, these instructions and explanations may lead to cautious students not to answer questions and leave it blank even though they have high chance of giving right answers (Espinosa & Gardeazabal, 2010). Some of the right guesses might be based on partial knowledge. On the other hand, wrong answers are due to wrong knowledge or a well-worked distracter. In these two cases the correction formula will ameliorate student's score excessively or in a lacking manner. Since it will never be certain whether the student have the answer of the question partially or completely. It is not possible to reach the exact purpose of the correction interferences (Gronlund, 1976). Additionally, deploying of correcting score formula may be advantageous for the individuals who are experienced in guessing correct answer in the test items (Ebel, 1965; Frary, 1988). Another point that opponents of the use of correction for guessing formula, put emphasis on, the achievement rate that may be obtained with chance is minor and the possibility of obtaining the highest score with chance is almost non-existent (Mehrens & Lehmann, 1984). Comparisons between corrected and uncorrected test scores show that the relationship between these two scores is usually very high (Ebel, 1965). The purpose of this research is to determine the differences in test and item statistics when the correction for guessing formula is used and not used in a Turkish language reading comprehension test consists of multiple-choice items.
2. Method
This study is a correlational research (Fraenkel & Wallen, 2006). The study group is 123 secondary school students in 8th grade. The Turkish language reading comprehension test that used for the research, consists of 15 items which were chosen among the Turkish items of Central Educational Institutions Student Selection and Placement Exam (OKÖSYS) and the Private Schools Examination (ÖOS) of various years. Text types, situation, aspects were taken into account in the item choosing process (OECD, 2012). The first test application was conducted with the instruction of "correction for guessing formula will use for the test score". After a 30-day period, for impeding retention affect, same test applied with the “correction for guessing formula will not use for the test score" instruction. Student achievement, test and item statistics compared and interpreted according to the data obtained from both applications. Test scores and test statistics were calculated with correction for guessing formula for the first application and without correction for guessing formula for the second application. Since the data was not normally distributed, Wilcoxon Signed Ranks test was performed to analyze whether there is a significant difference in student scores between two applications and differences in item statistics.
3. Findings and Interpretations
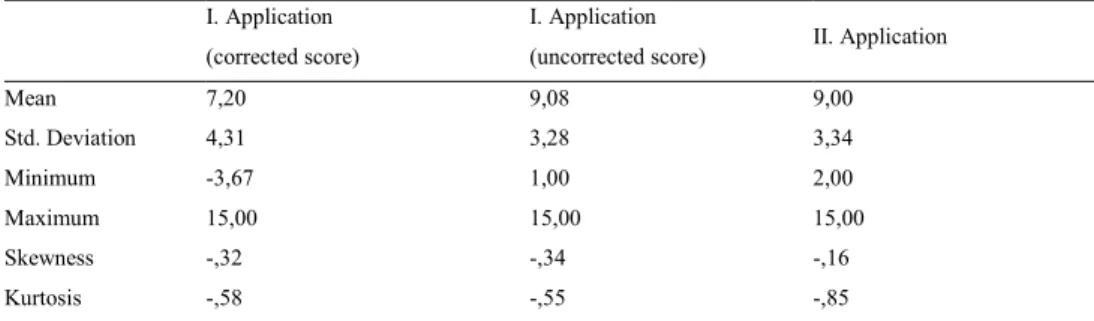
Test statistics obtained from first and second application of reading comprehension tests were given on Table 1.Referred to Table 1, it is seen that uncorrected scores and second application’s means are nearly the same. However, it can be expressed that the mean is lower in first application’s corrected score. In all three cases, the 15 (maximum number) is obtained but for the first application the minimum score changes and corrected score is below zero points. Although there are not great differences between skewness values, it may be expressed that the first application is easy for the students.
Table 1. Test statistics obtained from first and second application I. Application
(corrected score)
I. Application
(uncorrected score) II. Application
Mean 7,20 9,08 9,00 Std. Deviation 4,31 3,28 3,34 Minimum -3,67 1,00 2,00 Maximum 15,00 15,00 15,00 Skewness -,32 -,34 -,16 Kurtosis -,58 -,55 -,85
The first and second application’s item statistics are given on Table 2. Considering the limits (0.00 – 0.39: very difficult, 0.40 – 0.69: in medium difficulty, 0.70 – 1.00: easy; 0.00 – 0.29: low discrimination, 0.30 – 0.39: medium discrimination, 0.40 – 1.00: high discrimination (Crocker & Algina, 1986)) it can be suggested that items are medium or highly discrimination (rpbis) and medium or easy difficulties (pj). The Wilcoxon Signed Ranks test was
performed for testing whether there are differences between the mean of item statistics. According to the results, it is determined that there isn’t significant difference in item difficulty and discrimination index’s mean (zpj=-.946, p>.05;
zrpbis=-.171, p>.05 ).
Table 2. Item statistics obtained from first and second application
M1 M2 M3 M4 M5 M6 M7 M8 M9 M10 M11 M12 M13 M14 M15 I. Application pj 0,68 0,45 0,68 0,80 0,48 0,63 0,80 0,57 0,58 0,57 0,70 0,61 0,67 0,62 0,41 rpbis 0,54 0,31 0,51 0,34 0,36 0,37 0,36 0,71 0,59 0,56 0,45 0,50 0,58 0,38 0,40 II. Application pj 0,71 0,49 0,68 0,81 0,41 0,63 0,68 0,58 0,62 0,51 0,67 0,63 0,63 0,53 0,44 rpbis 0,51 0,56 0,42 0,5 0,45 0,43 0,32 0,58 0,5 0,49 0,52 0,42 0,49 0,31 0,49 pj: item difficulty index, rpbis:discrimination power of items
The Wilcoxon Signed Ranks is given on Table 3 indicates whether there are differences between student’s scores from first and second application. Test results show that it is statistically significant difference between first and second application. (z=-5,25, p<.05). When we consider at the observed frequencies, it can be expressed that scores of four students are the same in both application, 37 students have higher scores in the first application, 82 students have higher scores in the second application. Statistically significance tests may assess the results obtained from the sample with the chance factor; effect size is an indication of the practical significance. Statistical significance is affected from number of samples but effect size helps to get more accurate decision by eliminating the resulting from sample size (Fan, 2001). In this study, the Cohen's d effect size was calculated and it was found 0.47. It may be referred that this value corresponds to the size of the medium effects.
Table 3. The Wilcoxon Signed Ranks
I. Application (corrected score) – II. Application
N Mean Rank Sum of Ranks Negative Ranks 37a 40,20 1487,50
Positive Ranks 82b 68,93 5652,50
Ties 4c
Total 123
a. II. Application < I. Application b. II. Application > I. Application c. II. Application = I. Application
Spearman correlation was used to examine whether statistically significant relationship between the two applications. Results are showed on Table 4. It was determined that second application has statistically significant relationship both with uncorrected and corrected scores (p <.05). The concept of a linear transformation is useful for describing the relationship between the corrected scores and number-right (uncorrected) scores. The scores resulting from a linear transformation are equivalent to the original scores for comparing examinees with respect to each other. Moreover, knowing the transformation, one could return to the original scores if desired (Frary, 1988).
Table 4. Spearman Correlation Test Results
First application (corrected score)
First application (uncorrected score) II. Application Correlation Coefficient ,671 ,677
Sig. (2-tailed) ,000 ,000
4. Conclusion and Suggestions
In consideration of the test statistics obtained from both applications, in first application that was used the correction for guessing formula, the minimum point was found approximately -4. However as stated by Ebel (1965), learning is not a process based on the ‘all or nothing’ principle, generally there is a state of ‘less or more in learning. Therefore, it is thought that the ‘-4’ score from the test, was prepared for this study to determine the reading comprehension level of the students, is not accurate. It is a remarkable finding that despite the differentiation of item discrimination values in Burton (2001), Harris et al (1996) and Çelen and Demirtaşlı (2006)’s similar studies, this study demonstrate that the use of the correction for guessing formula did not made a significant difference on the average of item difficulty and discrimination values. Although there are significant differences in student scores, the effect size is moderate. Therefore, as a recommendation, this study should be repeated in larger groups. A significant almost high correlation was found between the student scores, obtained from the two applications as Çelen and Demirtaşlı (2006)’s studies. In the light of research findings, it is hard to say that the correction for guessing formula completely eliminate the chance error in the application on multiple-choice items. The equalization of ‘chance achievement’ for everyone is possible to allow all students to answer all questions without any correction application, without a penalty. Similar studies repeated in different tests and different samples will provide new contributions in this field.
References
Baykul, Y. (2000). Eğitimde ve Psikolojide Ölçme: Klasik Test Teorisi ve Uygulaması. Ankara: ÖSYM Yayınları.
26(3), 2\3- 220.
Crocker, L., & Algina, J. (1986). Introduction to Classical and Modern Test Theory. New York: Holt, Rinehart and Winston.
Çelen, Ü. ve Demirtaşlı, N. (2006). Düzeltme yönergesinin testin psikometrik özelliklerine etkisi. Hacettepe Üniversitesi Eğitim Fakültesi
Dergisi. 30 (2006) 82-91.
Ebel, R. (1965). Measuring Educational Achievement. New Jersey: Prentice Hall.
Espinosa, M.P. & Gardeazabal, J. (2010). Optimal correction for guessing in multiple-choice tests. Journal of Mathematical Psychology, 54
(5), 415-425.
Fan, X. (2001). Statistical significance and effect size in education research: Two sides of a coin. Journal of Educational Research, 94, 275 283.
Fraenkel, R. J. & Wallen, E. N. (2006). How to Design and Evaluate Research In Education. Mc Graw Hill.
Frary, R. B. (1980). The effect of misinformation, partial ınformation and guessing on expected multiple-choice test ıtem scores. Applied
Psychological Measurement, 4 (1), 79-90.
Frary, R. B. (1988). Formula scoring of multiple-choice tests (correction for guessing). No. 3 in the series; Instructional Topics in Educational Measurement, B. S. Plake, Editor. Educational Measurement: Issues and Practices, 7(2), 33-38.
Gronlund, N. E. (1976). Measurement and Evaluation in Teaching (3. Edition). New York: MacmiIlan Publishing Co.
Harris, D. K., Changas, P. S. & Palmore, E. B. (1996). Palmore's first facts on aging quiz in a multiple-choice format. Educational
Gerontology, 22(6), 575-589.
Mehrens, W. A. & Lehmann, i. J. (1984). Measurement and Evaluation in Educatian and Psychology. (3. Edition). New York: CBS College Publishing.
Organisation for Economic Co-operation and Development (OECD) (2012), PISA 2009 Technical Report, PISA, OECD Publishing. http://dx.doi.org/10.1787/9789264167872-en
Öncü, H. (Ağustos 2003). Çoktan seçmeli testler. Türkiye Sosyal Araştırmalar Dergisi. Cilt:7 Sayı: 2. Tekin, H. (2010). Eğitimde Ölçme ve Değerlendirme. (20. Baskı). Ankara: Yargı Yayınları.
Espinosa, M. P. & Gardeazabal, J. (2010). Optimal correction for guessing in multiple-choice tests. Journal of Mathematical Psychology,