No Evidence for a Common Factor Underlying Visual Abilities in Healthy
Older People
Albulena Shaqiri
Swiss Federal Institute of Technology Lausanne (EPFL)
Karin S. Pilz
University of GroningenAline F. Cretenoud
Swiss Federal Institute of Technology Lausanne (EPFL)
Konrad Neumann
Charité - Medical UniversityAaron Clarke
Bilkent UniversityMarina Kunchulia
Free University of Tbilisi and Ivane Beritashvili Center of Experimental Biomedicine, Tbilisi, Georgia
Michael H. Herzog
Swiss Federal Institute of Technology Lausanne (EPFL)
The world’s population is aging at an increasing rate. Even in the absence of neurodegenerative disorders, healthy aging affects perception and cognition. In the context of cognition, common factors are well established. Much less is known about common factors for vision. Here, we tested 92 healthy older and 104 healthy younger participants in 19 visual tests (including visual search and contrast sensitivity) and three cognitive tests (including verbal fluency and digit span). Unsurprisingly, younger participants performed better than older participants in almost all tests. Surprisingly, however, the performance of older participants was mostly uncorrelated between visual tests, and we found no evidence for a common factor.
Keywords: aging, perception, common factor, cognition
Supplemental materials:http://dx.doi.org/10.1037/dev0000740.supp
The world’s population is aging. For the first time in history, people aged 65 and over will soon outnumber children under the age of 5 (National Institute of Aging [NIA], 2015). These demo-graphic changes impact all aspects of society, including the health care system. It has long been suggested that there is a common factor underlying cognitive abilities as, for example, performance strongly correlates between memory and verbal tests in the young adult population (Conway, Cowan, Bunting, Therriault, & Minkoff, 2002;McCabe, Roediger, McDaniel, Balota, & Hambrick, 2010).
Cognitive abilities significantly change with age, affecting profes-sional skills and well-being (Li & Lindenberger, 2002; Park & Reuter-Lorenz, 2009;Salthouse, 2009). Evidence suggests a com-mon factor underlying these cognitive changes in healthy aging (for a review, seeKiely & Anstey, 2017). For example,Baltes and Lindenberger (1997)found that age-related changes of five cognitive functions were correlated.Salthouse and Czaja (2000) found more than 11 cognitive variables that shared a common variance dependent on age.
This article was published Online First June 13, 2019.
Albulena Shaqiri, Laboratory of Psychophysics, Brain Mind Institute, Swiss Federal Institute of Technology Lausanne (EPFL); Karin S. Pilz, Department of Experimental Psychology, University of Groningen; Aline F. Cretenoud, Laboratory of Psychophysics, Brain Mind Institute, Swiss Federal Institute of Technology Lausanne (EPFL); Konrad Neumann, Charité - Institute of Biom-etry and Clinical Epidemiology, Charité - Medical University; Aaron Clarke, Department of Psychology and Department of Neuroscience, Bilkent Univer-sity; Marina Kunchulia, Institute of Cognitive Neurosciences, Free University of Tbilisi, and Laboratory of Vision Physiology, Ivane Beritashvili Center of Experimental Biomedicine, Tbilisi, Georgia; Michael H. Herzog, Laboratory of Psychophysics, Brain Mind Institute, Swiss Federal Institute of Technology Lausanne (EPFL).
We thank Marc Repnow, Vitaly Chicherov and Janir da Cruz for their help with data analysis, Britt Anderson for his comments on the manuscript and Maya Jastrzebowska for proof reading of the manu-script. This work was generously supported by the Velux Foundation. Aaron Clarke was supported by a TU¨ BI˙TAK 2236 Co-Funded Brain Circulation Scheme grant, Project 116C037. We are saddened to an-nounce that Aaron Clarke has passed away during the publication process.
Correspondence concerning this article should be addressed to Al-bulena Shaqiri, Laboratory of Psychophysics, Brain Mind Institute, School of Life Sciences, Ecole Polytechnique Fédérale de Lausanne (EPFL), Station 19, CH-1015, Lausanne, Switzerland. E-mail:albulena .shaqiri@epfl.ch This document is copyrighted by the American Psychological Association or one of its allied publishers. Content may be shared at no cost, but any requests to reuse this content in part or whole must go through the American Psychological Association.
© 2019 American Psychological Association 2019, Vol. 55, No. 8, 1775–1787
0012-1649/19/$12.00 http://dx.doi.org/10.1037/dev0000740
Contrary to cognition, there seems to be no common factor for adult vision (Bargary et al., 2017;Bosten & Mollon, 2010;Cappe, Clarke, Mohr, & Herzog, 2014; Chamberlain, Van der Hallen, Huygelier, Van de Cruys, & Wagemans, 2017;Emery, Volbrecht, Peterzell, & Webster, 2017;Peterzell & Kennedy, 2016). As in cognition, vision is affected by age-related changes. Decline has been found in contour integration (Roudaia, Bennett, & Sekuler, 2013), motion perception (Arena, Hutchinson, & Shimozaki, 2012; Bennett, Sekuler, & Sekuler, 2007;Billino, Bremmer, & Gegen-furtner, 2008; Pilz, Miller, & Agnew, 2017), biological motion (Agnew, Phillips, & Pilz, 2016; Billino et al., 2008; Norman, Payton, Long, & Hawkes, 2004;Pilz, Bennett, & Sekuler, 2010; Spencer, Sekuler, Bennett, Giese, & Pilz, 2016), vernier acuity (Garcia-Suarez, Barrett, & Pacey, 2004;Li, Edwards, & Brown, 2000), and in spatial and temporal processing (Pilz, Kunchulia, Parkosadze, & Herzog, 2015;Roudaia et al., 2013).
Aging may affect certain people more than others, which may, for instance, be due to differences in optical decline and lifestyle. For this reason, even though there is no unique common factor for vision in young people, it is possible that such a factor emerges during aging. In most studies investigating visual perception in healthy aging, performance of younger and older people is com-pared using only a single or very few perceptual tests, which prevents drawing specific conclusions on common factors (e.g., Andersen, 2012;Bennett et al., 2007;Billino et al., 2008;McBain, Norton, & Chen, 2010;Owsley, McGwin, & Seder, 2011;Pilz et al., 2010,2015, 2017;Spear, 1993). Here, we used a much larger battery of perceptual tasks compared to previous studies and investigated performance in younger and older participants. The tests are not all purely perceptual but are all somehow representative of various visual functions.
We also included three cognitive tests in our battery to assess a potential relationship between cognitive and perceptual functions. Visual sensation and perception precede cognition and, hence, cog-nitive deficits may, at least partially, be related to sensory and per-ceptual deficits, e.g., attentional changes might in fact be changes in visual filtering (Lee, Itti, Koch, & Braun, 1999). Indeed, moderate to strong correlations were found between sensory and cognitive abilities (Anstey, Hofer, & Luszcz, 2003;Ghisletta & Lindenberger, 2005; Lindenberger & Baltes, 1994;Lindenberger & Ghisletta, 2009; for a review, seeKiely & Anstey, 2017).
As in previous studies, we found strong performance differences between younger and older adults and only weak correlations between tests in the younger population. Surprisingly, we found only weak correlations between tests in the older population, that is, performance in one test did not predict performance in other tests.
Method
Participants
We tested 105 younger and 131 older participants. Older par-ticipants were recruited from the general population in Tbilisi, Georgia and from a course about refreshing driving skills in Lausanne, Switzerland. For the young group, we recruited univer-sity students from both Lausanne and Tbilisi Universities. All participants had normal or corrected-to-normal visual acuity, as assessed via the Freiburg visual acuity test (FrACT;Bach, 1996) and had no known history of eye diseases, such as macular
degeneration or cataract. All older adults were screened for mild cognitive impairments with the Montreal Cognitive Assessment (MoCA;Nasreddine et al., 2005). Because we wanted to test only healthy participants, we excluded 36 older participants because their scores were lower than 26, which is the threshold for a potential mild cognitive impairment. In addition, data of one young and three older participants were excluded because of excessive data loss. Therefore, we report the results for the re-maining subset of 92 older participants (60 –90 years, M⫽ 70 years, SD ⫽ 6.89) and 104 younger adults (18–31 years, M ⫽ 21.8, SD ⫽ 2.66). Participants were tested either at the École Polytechnique Fédérale de Lausanne, Switzerland (N⫽ 79), or at the Beritashvili Center of Experimental Biomedicine in Tbilisi, Georgia (N⫽ 117).
This study was approved by the ethics committee of the Canton de Vaud in Lausanne, Switzerland (study title: “Aspects fonda-mentaux de la reconnaissance des objets: approche psychophy-sique et électrophysiologique,” approval number: 384/2011), and the ethics committee of the Beritashvili Center of Experimental Biomedicine in Tbilisi, Georgia. All participants gave written informed consent, were reimbursed for their participation, and were informed that they could quit the experiment at any time.
Procedure and Analysis
All participants performed 19 visual tests, of which some tests were versions of the same paradigm. For example, we tested biological motion perception with four conditions. In addition, participants performed three cognitive tests (verbal fluency, digit span forward and backward, and the Wisconsin Card Sorting Test [WCST]) and answered three questionnaires: the Montreal Cogni-tive Assessment (MoCA) the Geriatric Depression Scale (GDS), and the Autism-Spectrum Quotient Questionnaire (AQ). The 19 visual tests tested basic to complex visual processing: vernier discrimination (duration and offset), visual backward masking (with a 5 and a 25 elements grating), visual acuity, orientation discrimination, contrast sensitivity, motion direction discrimina-tion, biological motion perception (for 200 ms and 800 ms, upward and inverted), simple reaction time, visual search (for three num-bers of distractors; we determined two measures: slope and RT), and a Simon test.
Data transformation. We first rescaled the data to approxi-mate normal distributions so that a three-sigma outlier criterion and Pearson correlations were less affected by skewness. For rescaling, we used a power transformation whose exponent was optimized for each test in order to maximize normality according to the Shapiro-Wilk test (the values of for each test are given in theSupplemental Table S1in the online supplemental material). For each test, the optimization procedure minimized the average of the Shapiro-Wilk test statistic values for the two age groups (younger and older). That is, the optimized exponent was test-specific but not group-test-specific. For tests that used the same mea-sure, the same exponent was applied (i.e., Bio200 ⫽ Bio800 ⫽ Bio200i⫽ Bio800i, BMask5⫽ BMask25 and DigitF ⫽ DigitB). Finding the optimal exponent for rescaling was interleaved with outlier identification to alleviate the problem of both steps, rescal-ing and outlier identification, spoilrescal-ing each other.
This procedure was modified for the vernier duration and the biological motion tests, which showed strong floor or ceiling
This document is copyrighted by the American Psychological Association or one of its allied publishers. Content may be shared at no cost, but any requests to reuse this content in part or whole must go through the American Psychological Association.
effects, at least for some conditions and for one or both groups. For vernier duration, thresholds above 500 ms were classified as out-liers and removed, and the scores were log-transformed. For the biological motion tests, the few outliers were identified and re-moved just after rescaling.
Finally, we z-transformed the data for each test and flipped the sign when better performance was indicated by lower values. Hence, higher scores indicate better performance for all tests.
Merging task repetitions. For the visual backward masking tasks, performance was determined twice for both the 5 and the 25 elements grating. In the factor analysis, we used the mean values of the two measurements.
Data imputation. We removed data from participants who had more than 25% of the scores missing, for example, due to outlier rejection. This was the case for one younger and three older participants. For the factor analysis, we imputed missing scores using the function ‘mice’ from the R package ‘mice’ with method ‘norm’ (Bayesian linear regression). Because in total only 2.9% of the scores were missing, we used simple imputation with only one imputation sample.
Factor analysis. To determine the optimal number of factors for each group, we ran exploratory and confirmatory factor anal-yses for F factors and chose the model with the minimal Akaike criterion. For the exploratory factor analysis (EFA), we extracted F factors (F ranging from 1 to 6) with ‘varimax’ rotation using the R function ‘principal’ from the R package ‘psych.’ To simplify the factor structure and to arrive at a suitable hypothesis for the subsequent confirmatory factor analysis, we followed the approach by Jöreskog (1978). First, we identified for each factor Fi the variable Vi which loaded maximally on the factor Fi. Then we performed a suitable linear transformation (oblique rotation) such that the Vihas an even larger loading on the rotated factor Fiand zero or very small loadings on all other rotated factors. Hence after the rotation, these variables mainly loaded on one factor only. For the confirmatory factor analysis (CFA), we constructed a path model from the simplified model by including only connections whose loadings were⬎0.3 (or ⬍ ⫺0.3, respectively). So, the null hypothesis for the CFA is that all other loadings are exactly zero. The coefficients of this path model were computed with the ‘sem’ function of the R package ‘psych.’ The correlation matrices that were used to compute the factor analysis for the young and old
populations are reported in the online supplemental material (Sup-plemental Table S2).
For the young population, the three-factor model had the small-est Akaike criterion, for the older population it was the four-factor model, which we report in detail.
Tests
Perceptual tests.
Vernier discrimination and backward masking. We adapted the shine-through paradigm (Herzog, Kopmann, & Brand, 2004; Roinishvili, Chkonia, Stroux, Brand, & Herzog, 2011). Vernier stimuli were presented from a distance of 500 cm in a dimly illuminated room. The stimuli were white on a black background. In a first step, we presented vernier stimuli consisting of two vertical bars which were offset in the horizontal direction (Figure 1a). Participants indicated via button press the offset direction of the lower bar compared to the upper bar (left or right). Errors were indicated by an auditory signal. For each observer, we determined the individual vernier duration (VernDur) required to reach 75% correct responses using a staircase procedure (for details, seeChkonia et al., 2010). The staircase procedure started with a duration of 150 ms. In addition to the individual vernier duration, we also determined the vernier offset thresholds (VernOfs) for the 150 ms condition.
In the backward masking conditions, the vernier was followed by a variable interstimulus interval (ISI), that is, a blank screen, and then a grating for 300 ms. We used the individual vernier duration for each observer as determined in the vernier discrimi-nation task and we varied the ISI adaptively using a staircase procedure (Taylor & Creelman, 1967). The grating consisted of either 5 (BMask5) or 25 (BMask25) aligned elements of the same length as the target vernier (Figure 1b). We reported the stimulus onset asynchrony (SOA⫽ individual VernDur ⫹ ISI, in ms). The five elements grating leads to stronger masking than the 25 ele-ments grating even though the five eleele-ments grating is contained within the 25 elements grating (Herzog & Koch, 2001). This difference in masking strength indicates that a substantial part of the masking power is not of retinal origin because retinal process-ing is mainly determined by the sheer amount of light, for exam-ple, the number of grating elements presented. No feedback was given.
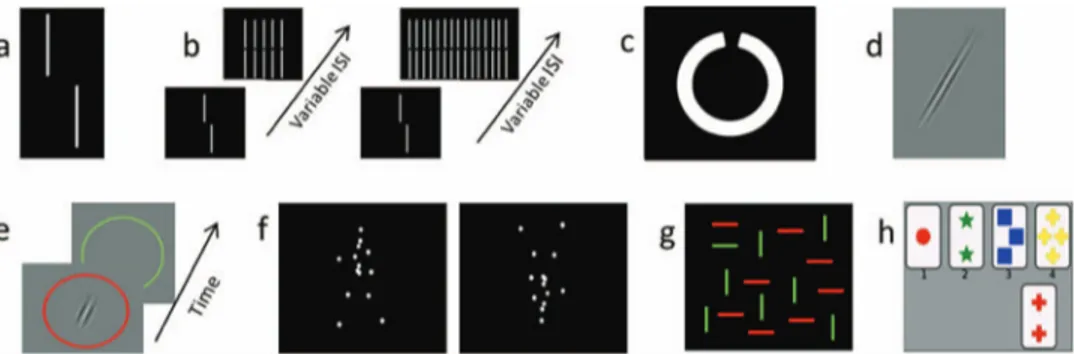
Figure 1. A few examples of the perceptual and cognitive tasks used. a: vernier discrimination; b: visual
backward masking with the 5 and the 25 elements grating; c: Freiburg Visual Acuity Test; d: orientation discrimination; e: contrast sensitivity; f: upward and inverted biological motion perception; g: visual search; h: Wisconsin Card Sorting Test. See the online article for the color version of this figure.
This document is copyrighted by the American Psychological Association or one of its allied publishers. Content may be shared at no cost, but any requests to reuse this content in part or whole must go through the American Psychological Association.
Freiburg Visual Acuity Test (FrACT). This test has been developed and described in detail byBach (1996) and has been validated in various studies (Schulze-Bonsel, Feltgen, Burau, Han-sen, & Bach, 2006;Wesemann, 2002). Landolt-C optotypes with randomized gap orientations were presented on a computer mon-itor (Figure 1c). Participants indicated the direction of the gap (“up,” “down,” “left,” “right”) by verbalizing their responses and the experimenter operated the input device. The size of each optotype changed adaptively following the best-PEST algorithm (Treutwein, 1995).
Orientation discrimination (Orient). This is an adapted ver-sion of the orientation discrimination test as used previously (Tib-ber, Guedes, & Shepherd, 2006). Participants were seated 200 cm from the computer screen and were asked whether a Gabor patch was oriented clockwise or anticlockwise from vertical (Figure 1d). Auditory feedback was given for incorrect responses. The outcome measure was the perceptual threshold in degrees from vertical.
Contrast sensitivity (Contrast). We measured contrast sensi-tivity similarly toLahav, Levkovitch-Verbin, Belkin, Glovinsky, and Polat (2011). Stimuli were presented from a distance of 200 cm in a dimly illuminated room. Participants indicated in which of two subsequently presented circles (first red, second green,Figure 1e) a Gabor patch was presented. Participants had to press the button corresponding to the color of the circle in which the Gabor was presented (i.e., a red or green button). A staircase method was used to determine the contrast threshold level at which participants reached 75% correct responses. Auditory feedback was given for incorrect responses.
Motion direction discrimination (Motion). This test measures global motion perception. Stimuli and procedures were based on work by Banton, Dobkins, and Bertenthal (2001). Participants were seated 200 cm in front of the screen and had to judge the motion of dot patterns. On each trial, a certain number of dots moved either to the right or to the left (target), and a certain number of dots moved independently from each other (distractors). The percentage of target dots varied according to a staircase procedure (PEST). The starting value was 20%.
Biological motion perception. Participants were seated 60 cm from the screen and indicated the walking direction of a point-light walker via a button press (left or right,Figure 1f). The walker did not move across the screen, but appeared to walk in place as if on a treadmill. The walker’s direction of motion was either rightward or leftward, and the walker was either presented upright or inverted (conditions were not intermixed) for either 200 or 800 ms (upright: Bio200, Bio800; inverted: Bio200i, Bio800i). We determined ac-curacy (in %). Auditory feedback was given. For details, see (Pilz et al., 2010).
Simple reaction time (SimpRT). Participants were seated at a distance of 200 cm from the computer screen and were instructed to press a button immediately after a white square (3 arc degrees size) appeared on the black background. The intertrial interval (ITI) was varied randomly to prevent participants from predicting when the square appears. There was a minimal ITI of 1,500 ms. Reaction time (in ms) was measured. This test was a modified version of the classic Hick-paradigm (Hick, 1952).
Visual search test. Participants searched for a green hori-zontal line within an array of distractors (green vertical and red horizontal lines,Figure 1g). They were seated at a distance of 200 cm from the computer screen. The displays consisted of
4, 9, or 16 lines and were presented in random order. Partici-pants had to indicate whether the displays contained the green horizontal line, which was the case in 50% of the trials. Both average RT for the correctly answered trials (VSrchRT) and slope of the regression line for RT over number of elements (VSrchSL) were assessed.
Simon test (Simon). We used a modified version of the visual Simon test (Castel, Balota, Hutchison, Logan, & Yap, 2007). Participants were seated at a distance of 200 cm from the computer screen and were presented with arrows. Participants were instructed to respond with the right hand to a right-pointing arrow and respond with the left hand to a left-right-pointing arrow. Arrows were presented at three locations on the screen (left, right or center). In congruent trials, the direction of the arrow matched its location (e.g., left-pointing arrow on the left side of the screen), whereas this was not the case for incongru-ent trials (e.g., left-pointing arrow on the right side of the screen). The magnitude of response conflict (Simon effect) was defined by the difference of the response times for the congru-ent and the incongrucongru-ent conditions, divided by the average response time. Only valid responses were taken into account.
Cognitive tests.
Verbal fluency (VbFlu). The Controlled Oral Word Associa-tion Test (COWAT) was originally developed by Bechtold and colleagues (Bechtoldt, Benton, & Fogel, 1962) and is a measure of left frontal lobe functioning (Newman, Trivedi, Bendlin, Ries, & Johnson, 2007;Wood, Saling, Abbott, & Jackson, 2001). Partici-pants produced as many words as they could that belonged to the categories of animals and fruit/vegetables. The total number of words from each category was recorded.
Digit span test. Participants were asked to repeat a series of random numbers, which were presented at a rate of one per second. In the digit span forward test (DigitF), participants were asked to repeat the numbers in a forward order. In the digit span backward test (DigitB), participants were asked to report the numbers in reverse order. In DigitF, two sets of three digits were presented first, and an additional digit was added if at least one out of two trials had been correctly recalled. For DigitB, two sets of two digits were given first. The longest correctly repeated digit length (based on at least one correctly recalled set; maximum of 9 digits for DigitF and DigitB) was reported. The test was adapted fromElliott and colleagues (2011).
Wisconsin Card Sorting Test (WCST). We administered a com-puterized version of the WCST (Berg, 1948; part of the PEBL, Psychological Test Battery), which contains 64 cards of which four were displayed at the top of the computer screen at a time (Figure 1h). Each card contained items that differed from the other three cards on three dimensions, namely in shape (crosses, triangles, circles or stars), number (1– 4 items) and color (red, blue, yellow, green). A fifth card was then presented on the bottom of the screen, and participants matched the fifth card according to the shape, number of items or color by clicking on one of the four cards displayed at the top of the screen. Participants were not told according to which strategy they were supposed to match the cards. Feedback about whether or not cards were successfully matched was given after each response. Once the participant had learned the correct strategy, the dimension accord-ing to which cards had to be matched changed. Hence, participants
This document is copyrighted by the American Psychological Association or one of its allied publishers. Content may be shared at no cost, but any requests to reuse this content in part or whole must go through the American Psychological Association.
were required to constantly adjust their strategies. The total number of perseverative errors was assessed.
Questionnaires.
Montreal Cognitive Assessment (MoCA). Participants per-formed the MoCA, which tests for mild cognitive impairments (Nasreddine et al., 2005). A score between 30 and 26 corresponds to healthy participants, a score between 26 and 16 corresponds to a mild cognitive impairment and a score of below 16 corresponds to dementia.
Geriatric Depression Scale (GDS). The Geriatric Depression Scale (Yesavage et al., 1982) is a 30-item questionnaire that tests for depressive symptoms in older subjects. This questionnaire is generally used in geriatric standardized evaluations or for research in depression or cognitive decline.
Autism-Spectrum Quotient questionnaire (AQ). The AQ (Baron-Cohen, Wheelwright, Skinner, Martin, & Clubley, 2001) is a 50-item questionnaire designed to detect symptoms of autism or other symptoms from the autism spectrum.
Results
Performances
Mean values for each test and both groups are reported inTable 1. Older participants performed significantly worse in all tests except for the verbal fluency test (Table 2). Scores on the AQ and GDS did not differ between older and younger participants, indi-cating the good mental state of the older participants. These results
are in line with previous studies (Strauss, Sherman, Spreen, & Spreen, 2006).
Correlations
We computed Pearson correlations for the young and old pop-ulations (Figures 2and3, respectively). Correlations between most tests are rather low, except for correlations between versions of one paradigm (e.g., between the digit span forward and backward tasks).
Test–Retest Reliability, Power, and Factor Analysis
The null results cannot be explained by poor test–retest reliability or low statistical power. First, our test-retest correlations were high. For example, we tested performance in the visual backward masking conditions with the 5 and 25 elements grating twice and found test-retest correlations of
rBMask5,young⫽ 0.76 [N ⫽ 85], rBMask5,old⫽ 0.65 [N ⫽ 73], rBMask25,young⫽ 0.67 [N ⫽ 72], rBMask25,old⫽ 0.65 [N ⫽ 80], respectively (all p⬍ .001), which are large according toCohen (1988) and Gignac and Szodorai (2016). In the visual search test, participants searched with 4, 9 and 16 distractors. The corresponding correlation coefficients were 0.922, 0.865 and 0.957 (young) and 0.840, 0.721, and 0.922 (older) with p values ⬍0.001. In addition, versions of the same paradigm, such as Bio200 and Bio800, also showed high correlations.
Second, with about 100 participants in each group, we had 80% power to detect effect sizes with r of 0.27, which is close to a
Table 1
Means of Untransformed Data After Removal of Outliers and of Participants With More Than 25% of Missing Data
Measure
Young Old
M SE n M SE n
FrACT Visual acuity (decimal) 1.73 0.048 101 1.17 0.041 92
VbFlu Number of words 19.8 0.48 104 20.3 0.42 91
DigitF Number of digits 6.33 0.116 103 5.99 0.104 91
DigitB Number of digits 4.85 0.131 102 4.36 0.116 92
WCST Number of perseverative errors 17.6 0.91 103 27.2 1.56 90
SimpRT Response time [ms] 261 4.0 102 281 5.3 91
Simon Relative percent correct delta [%] ⫺3.91 0.359 103 ⫺8.46 0.541 91
VernDur Vernier duration [ms] 36.6 6.11 103 99.3 12.96 85
VernOfs Vernier offset [arcsec] 24.0 3.24 89 40.1 4.65 85
BMask25 Mask onset asynchrony [ms] 31.7 3.64 82 90.2 10.62 83
BMask5 Mask onset asynchrony [ms] 88.0 4.82 91 183 8.8 83
Contr Michelson contrast [%] 1.76 0.066 101 6.11 0.613 91
Motion Motion direction coherence [%] 20.0 0.84 104 25.9 1.00 89
Bio200i Percent correct [%] 80.8 1.75 104 57.9 1.66 92
Bio800i Percent correct [%] 86.3 1.77 104 60.0 2.08 92
Bio200 Percent correct [%] 98.5 0.25 103 82.8 1.80 92
Bio800 Percent correct [%] 99.2 0.18 102 88.4 1.84 92
Orient Angular orientation delta [°] 0.660 0.0432 104 1.03 0.062 91
VSrchSL Response time slope [ms/item] 21.4 1.25 103 36.0 1.70 91
VSrchRT Average response time [ms] 863 19.1 103 1080 20 90
Note. FrACT⫽ Freiburg Visual Acuity Test; VbFlu ⫽ COWAT Verbal Fluency; DigitF ⫽ Digit Span Forward; DigitB ⫽ Digit Span Backward;
WCST⫽ Wisconsin Card Sorting Test; SimpRT ⫽ simple reaction time; Simon ⫽ Simon Test; VernDur ⫽ vernier duration; VernOfs ⫽ vernier offset; BMask25 and BMask5⫽ visual backward masking with 25 and 5 elements grating, respectively; Contr ⫽ contrast sensitivity; Motion ⫽ motion direction discrimination; Bio200i and Bio800i⫽ inverted biological motion perception for 200 ms and 800 ms, respectively; Bio200 and Bio800 ⫽ upward biological motion perception for 200 ms and 800 ms, respectively; Orient⫽ orientation discrimination; VSrchSL and VSrchRT ⫽ visual search slope and intercept, respectively. This document is copyrighted by the American Psychological Association or one of its allied publishers. Content may be shared at no cost, but any requests to reuse this content in part or whole must go through the American Psychological Association.
medium effect size according toCohen (1988)and a large effect size according toGignac and Szodorai (2016).
Factor Analysis
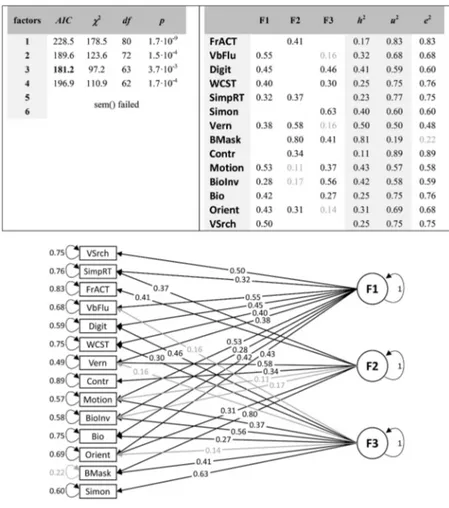
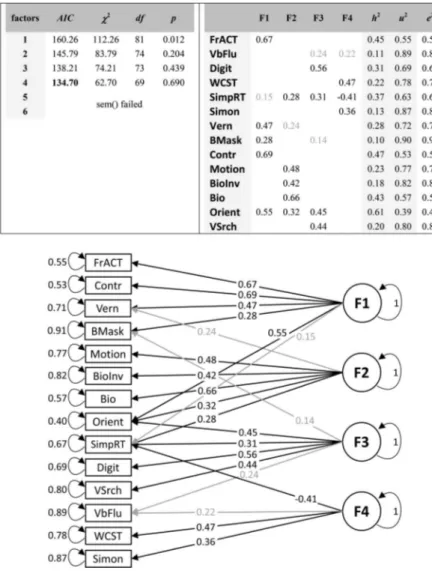
First, the values of the Kaiser-Meyer-Olkin’s Measure of Sam-pling Adequacy were 0.69 for the young and 0.62 for old partic-ipants, indicating a rather weak factor structure (according to the Kaiser-Meyer-Olkin’s classification of Measure of Sampling Ad-equacy values, the suitability of the data for factor analysis is “mediocre”). Second, we computed a factor analysis for one to six factors. The best fitting model according to the Akaike criterion was obtained with three factors for the young population and four factors for the old population (Figures 4and5, respectively). The best fitting models do not reveal a clear factor structure, where single factors load on specific variables. Variables rather load on many factors (for the detailed model parameter statistics, see Supplemental Tables S3andS4in the online supplemental mate-rial). In addition, loadings are often low. Third, for most tasks, the uniqueness u2is larger than the communalities h2, which means that the explained variance by the factors is smaller than the unexplained one (Figures 4and5).
Discussion
Previous studies have shown strong correlations between cog-nitive tests in younger adults and have provided evidence for common factors underlying age-related cognitive deterioration
(Christensen, Mackinnon, Korten, & Jorm, 2001;Salthouse, Han-cock, Meinz, & Hambrick, 1996; for a review, seeKiely & Anstey, 2017). Here, we investigated to what extent there are common factors for visual perception.
First, apart from test–retest comparisons or comparisons be-tween similar tasks, we found mainly weak correlations bebe-tween visual tests in younger adults. A three-factor model explained the data best without overfitting. However, the factor structure did not reveal a clear pattern and loadings were mainly low. The three factors explained 34.8% of the total variance. As a comparison, the one-factor model explained 20.4% of the total variance. Our re-sults are in accordance with previous studies (Bosten & Mollon, 2010;Cappe et al., 2014;Grzeczkowski, Clarke, Francis, Mast, & Herzog, 2017;Ward, Rothen, Chang, & Kanai, 2017). For exam-ple,Halpern, Andrews, and Purves (1999)tested orientation dis-crimination, motion direction disdis-crimination, vernier discrimina-tion, and contrast sensitivity and found a factor explaining 30% of the variance.Bosten et al. (2017)used 25 visual and auditory tests and found a factor that explained 19.9% of the total variance.Ward and colleagues (2017)tested performance for glass pattern, visual search, and motion perception, among others. They found two factors explaining 18% and 19% of the variance, respectively. Across these studies, the explained variance is roughly in the same range. Interpretations differ between studies because different cri-teria are used to determine how much variance a common factor needs to explain.
Table 2
t-Tests Comparing Older and Younger Participants
Measure t value df p value
Effect size (Cohen’s d)
95% CI (Cohen’s d) Lower bound Upper bound
FrACT 8.95 188.49 ⬍.001 1.29 .97 1.59 VbFlu ⫺.90 192.13 .368 .13 ⫺.41 .15 DigitF 2.10 191.98 .037 .30 .02 .58 DigitB 2.75 192.00 .007 .39 .11 .68 WCST 5.63 180.15 ⬍.001 .82 .51 1.10 SimpRT 3.00 185.28 .003 .43 .15 .71 Simon 7.25 182.15 ⬍.001 1.05 .74 1.34 VernDur 5.60 129.90 ⬍.001 .84 .51 1.09 VernOfs 6.17 169.91 ⬍.001 .93 .59 1.18 BMask25 7.31 163.00 ⬍.001 1.14 .75 1.34 BMask5 11.56 170.04 ⬍.001 1.75 1.33 1.98 Contr 15.77 187.52 ⬍.001 2.28 1.90 2.61 Motion 4.83 190.40 ⬍.001 .70 .40 .98 Bio200i 9.92 193.50 ⬍.001 1.41 1.10 1.73 Bio800i 10.11 189.67 ⬍.001 1.45 1.13 1.76 Bio200 9.57 97.22 ⬍.001 1.41 1.06 1.68 Bio800 6.31 94.06 ⬍.001 .93 .61 1.20 Orient 5.93 192.81 ⬍.001 .85 .55 1.14 VSrchSL 8.21 189.86 ⬍.001 1.17 .87 1.48 VSrchRT 9.35 175.00 ⬍.001 1.33 1.03 1.65
Note. Positive t-values indicate that older participants were worse than younger participants. CI⫽ confidence
interval; FrACT⫽ Freiburg Visual Acuity Test; VbFlu ⫽ COWAT Verbal Fluency; DigitF ⫽ Digit Span Forward; DigitB⫽ Digit Span Backward; WCST⫽ Wisconsin Card Sorting Test; SimpRT ⫽ simple reaction time; Simon⫽ Simon Test; VernDur ⫽ vernier duration; VernOfs ⫽ vernier offset; BMask25 and BMask5 ⫽ visual backward masking with 25 and 5 elements grating, respectively; Contr⫽ contrast sensitivity; Motion ⫽ motion direction discrimination; Bio200i and Bio800i⫽ inverted biological motion perception for 200 ms and 800 ms, respectively; Bio200 and Bio800⫽ upward biological motion perception for 200 ms and 800 ms, respectively; Orient⫽ orientation discrimination; VSrchSL and VSrchRT ⫽ visual search slope and intercept, respectively. Effect size is expressed as Cohen’s d.
This document is copyrighted by the American Psychological Association or one of its allied publishers. Content may be shared at no cost, but any requests to reuse this content in part or whole must go through the American Psychological Association.
Second, we found that young people perform much better in all tasks, except for the verbal fluency test, which is very much in line with previous findings (Agnew et al., 2016;Bennett et al., 2007; Billino et al., 2008; Garcia-Suarez et al., 2004;Norman et al., 2004;Pilz et al., 2017).
Third, most visual functions share common optical, retinal, and neural mechanisms (Thorpe & Fabre-Thorpe, 2001), which strongly
change with age, but to a different extent for each individual (Raz, Perlman, Percicot, Lambrou, & Ofri, 2003;Spear, 1993). For exam-ple, lens clouding may affect most visual functions, and stronger lens clouding may lead to stronger deficits. For this reason, we expected that some older participants would perform generally better than others. However, this is not what we found, as correlations between tests were rather weak. In addition, factor analysis revealed that a
Figure 2. Correlations for the young population. Values in the upper triangular matrix show Pearson
correlation coefficients (r) with a color code (blue: negative values; red: positive values). In the lower triangular matrix, we show the scatter plots of the individual performances together with regression lines plus 95% confidence intervals. The diagonal elements show histograms of the scores. Data were power-transformed to approximate normality, after removing outliers and participants with too many missing scores, but before data imputation. Vernier duration (VernDur) and upward biological motion perception (Bio200 and Bio800) show ceiling effects. This document is copyrighted by the American Psychological Association or one of its allied publishers. Content may be shared at no cost, but any requests to reuse this content in part or whole must go through the American Psychological Association.
4-factor model explained the data best, however, with no obvious relationship between factors and variables and low factor loadings. For almost all tests, the communalities were smaller than the unique-ness (Figure 5), indicating that there is more unexplained than ex-plained variance in the model. The four factors exex-plained all together 29.1% of the total variance. As a comparison, the one-factor model explains 13.1% of the total variance. Taken together, these results provide no evidence for a common factor for vision.
Our results can be explained neither by a lack of power, given the large number of participants (N ⫽ 196 participants), nor by poor test–retest reliability. The visual backward masking and
vi-sual search tests showed high test–retest reliability, and the corre-lations between the different biological motion conditions and between different set-sizes of the visual search tests were also high.
Because of the cross-sectional design of our study, we do not draw conclusions on how perception changes with age. We only claim that we do not find evidence for a common factor for vision in older participants.
We can only speculate why there is more evidence for common factors for cognition than for vision. One reason may be that cognition developed much later in human evolution than vision,
Figure 3. Correlations for the older population. Same format as inFigure 2.
This document is copyrighted by the American Psychological Association or one of its allied publishers. Content may be shared at no cost, but any requests to reuse this content in part or whole must go through the American Psychological Association.
which may have led to a higher degree of specialization in vision (for a review, seeJohnson, 1990). Another reason might be that more brain areas interact when performing cognitive compared to visual tasks. The increase in dedifferentiation with age may lead to higher correlations between cognitive compared to visual tests (Cox et al., 2016; Tucker-Drob, 2009). In addition, age-related volumetric changes are widespread across the brain, with the exception of the primary visual cortex (Giorgio et al., 2010;Raz et al., 2005).
It is important to note that we only tested healthy participants, that is, we sampled only from participants with good visual acuity (restricted range sampling), which is the vast majority of the population. There are strong correlations between visual tasks in people with optical or neurological pathologies because, for ex-ample, a person close to blindness performs poorly in all tests (Kurtenbach, Langrová, Messias, Zrenner, & Jägle, 2013).
The perceptual tests we chose are representative of visual func-tions and commonly used to understand visual processing. Gabors,
for example, mimic receptive field profiles in primary visual cortex V1 (Jones & Palmer, 1987). Some of our tests are not considered purely perceptual because they also tap into other aspects, such as inhibition and attention; one such example is the Simon task (Bialystok, Craik, Klein, & Viswanathan, 2004). Our goal was to have a battery of tests which would span a wide range of visual function complexity, from very basic to more complex. Future research is needed to confirm our results with different tests.
We were able to detect the absence of a unique common factor only because we used a large battery of tests. Previous research with older participants has usually employed only one or a few different paradigms and, thus, could not address a common factor hypothesis. Still, most studies support our no-tion of a lack of a unique common factor for percepno-tion because they find that visual abilities age differently and are not equally prone to age-related decline (e.g.,Billino et al., 2008;Pilz et al., 2010).
Figure 4. Confirmatory factor analysis for the young population. Left table: Number of factors in the model
and the corresponding fit statistics including the Akaike information criteria (AIC) and2values, degrees of
freedom, and p values for the one-tailed2test. The AIC is lowest for 3 factors. “Sem() failed” indicates that
the computation of the CFA did not converge properly. Right table: For this three-factor model, the table shows the estimated factor loadings, communalities (h2) and uniqueness values (u2⫽ 1-communalities) as calculated
from the loadings, and the estimated error variances (e2), which should ideally be identical with the uniqueness
values. Bottom: Factor structure from the three-factor model. Grayed-out values are not significantly different from zero (p⬎ .05). This document is copyrighted by the American Psychological Association or one of its allied publishers. Content may be shared at no cost, but any requests to reuse this content in part or whole must go through the American Psychological Association.
We expected high correlations between perceptual and cog-nitive tests because differences in cogcog-nitive functions may strongly influence perception and vice versa. For example, increased processing loads come with strong perceptual deficits and, hence, higher attentional and other cognitive demands (Pichora-Fuller, 2003). However, we found very low correla-tions between cognitive and perceptual tests in both younger and older participants (but seeAnstey et al., 2003;Christensen et al., 2001; Lindenberger & Ghisletta, 2009). We also found only weak correlations between the WCST (measuring execu-tive functions) and verbal fluency or digit span tests, most likely because these tests are measuring very different cognitive functions. These results are in accordance with previous studies (Fabiani & Friedman, 1997;Parkin & Lawrence, 1994;Stratta et al., 1997). However,McCabe et al. (2010), found that these three cognitive tests were linked under a common factor rep-resenting higher cognitive functions. Our data does not contrib-ute to this discussion because we had only three cognitive tests and thus, cannot address the question of common factors for cognition.
Conclusion
We found only weak correlations between visual tests in both younger and older adults and no evidence for a common factor. This is good news because age-related deficits in one visual function do not imply deficits in other visual functions.
References
Agnew, H. C., Phillips, L. H., & Pilz, K. S. (2016). Global form and motion processing in healthy ageing. Acta Psychologica, 166, 12–20.http://dx .doi.org/10.1016/j.actpsy.2016.03.005
Andersen, G. J. (2012). Aging and vision: Changes in function and per-formance from optics to perception. WIREs Cognitive Science, 3, 403– 410.http://dx.doi.org/10.1002/wcs.1167
Anstey, K. J., Hofer, S. M., & Luszcz, M. A. (2003). A latent growth curve analysis of late-life sensory and cognitive function over 8 years: Evi-dence for specific and common factors underlying change. Psychology
and Aging, 18, 714 –726.http://dx.doi.org/10.1037/0882-7974.18.4.714
Arena, A., Hutchinson, C. V., & Shimozaki, S. S. (2012). The effects of age on the spatial and temporal integration of global motion. Vision
Research, 58, 27–32.http://dx.doi.org/10.1016/j.visres.2012.02.004
Figure 5. Confirmatory factor analysis for the old population. Same denotations as for young population (see
Figure 4). The Akaike criterion is lowest for four factors.
This document is copyrighted by the American Psychological Association or one of its allied publishers. Content may be shared at no cost, but any requests to reuse this content in part or whole must go through the American Psychological Association.
Bach, M. (1996). The Freiburg Visual Acuity test—automatic measure-ment of visual acuity. Optometry and Vision Science, 73, 49 –53.http:// dx.doi.org/10.1097/00006324-199601000-00008
Baltes, P. B., & Lindenberger, U. (1997). Emergence of a powerful connection between sensory and cognitive functions across the adult life span: A new window to the study of cognitive aging? Psychology and
Aging, 12, 12–21.http://dx.doi.org/10.1037/0882-7974.12.1.12
Banton, T., Dobkins, K., & Bertenthal, B. I. (2001). Infant direction discrimination thresholds. Vision Research, 41, 1049 –1056.http://dx .doi.org/10.1016/S0042-6989(01)00027-X
Bargary, G., Bosten, J. M., Goodbourn, P. T., Lawrance-Owen, A. J., Hogg, R. E., & Mollon, J. D. (2017). Individual differences in human eye movements: An oculomotor signature? Vision Research, 141, 157– 169.http://dx.doi.org/10.1016/j.visres.2017.03.001
Baron-Cohen, S., Wheelwright, S., Skinner, R., Martin, J., & Clubley, E. (2001). The autism-spectrum quotient (AQ): Evidence from Asperger syndrome/high-functioning autism, males and females, scientists and mathematicians. Journal of Autism and Developmental Disorders, 31, 5–17.http://dx.doi.org/10.1023/A:1005653411471
Bechtoldt, H. P., Benton, A. L., & Fogel, M. L. (1962). An application of factor analysis in neuropsychology. The Psychological Record, 12, 147– 156.http://dx.doi.org/10.1007/BF03393452
Bennett, P. J., Sekuler, R., & Sekuler, A. B. (2007). The effects of aging on motion detection and direction identification. Vision Research, 47, 799 – 809.http://dx.doi.org/10.1016/j.visres.2007.01.001
Berg, E. A. (1948). A simple objective technique for measuring flexibility in thinking. Journal of General Psychology, 39, 15–22.http://dx.doi.org/ 10.1080/00221309.1948.9918159
Bialystok, E., Craik, F. I. M., Klein, R., & Viswanathan, M. (2004). Bilingualism, aging, and cognitive control: Evidence from the Simon task. Psychology and Aging, 19, 290 –303. http://dx.doi.org/10.1037/ 0882-7974.19.2.290
Billino, J., Bremmer, F., & Gegenfurtner, K. R. (2008). Differential aging of motion processing mechanisms: Evidence against general perceptual de-cline. Vision Research, 48, 1254 –1261. http://dx.doi.org/10.1016/j.visres .2008.02.014
Bosten, J. M., Goodbourn, P. T., Bargary, G., Verhallen, R. J., Lawrance-Owen, A. J., Hogg, R. E., & Mollon, J. D. (2017). An exploratory factor analysis of visual performance in a large population. Vision Research,
141, 303–316.http://dx.doi.org/10.1016/j.visres.2017.02.005
Bosten, J. M., & Mollon, J. D. (2010). Is there a general trait of suscep-tibility to simultaneous contrast? Vision Research, 50, 1656 –1664. http://dx.doi.org/10.1016/j.visres.2010.05.012
Cappe, C., Clarke, A., Mohr, C., & Herzog, M. H. (2014). Is there a common factor for vision? Journal of Vision, 14(8), 4.http://dx.doi.org/ 10.1167/14.8.4
Castel, A. D., Balota, D. A., Hutchison, K. A., Logan, J. M., & Yap, M. J. (2007). Spatial attention and response control in healthy younger and older adults and individuals with Alzheimer’s disease: Evidence for disproportionate selection impairments in the Simon task.
Neuropsy-chology, 21, 170 –182.http://dx.doi.org/10.1037/0894-4105.21.2.170
Chamberlain, R., Van der Hallen, R., Huygelier, H., Van de Cruys, S., & Wagemans, J. (2017). Local-global processing bias is not a unitary individual difference in visual processing. Vision Research, 141, 247– 257.http://dx.doi.org/10.1016/j.visres.2017.01.008
Chkonia, E., Roinishvili, M., Makhatadze, N., Tsverava, L., Stroux, A., Herzog, M. H., & Brand, A. (2010). The shine-through masking para-digm is a potential endophenotype of schizophrenia PLoS ONE, 5(12), e14268.
Christensen, H., Mackinnon, A. J., Korten, A., & Jorm, A. F. (2001). The “common cause hypothesis” of cognitive aging: Evidence for not only a common factor but also specific associations of age with vision and grip strength in a cross-sectional analysis. Psychology and Aging, 16, 588 – 599.http://dx.doi.org/10.1037/0882-7974.16.4.588
Cohen, J. (1988). Statistical power analysis for the behavioral sciences. Hillsdale, NJ: Erlbaum Associates.
Conway, A. R., Cowan, N., Bunting, M. F., Therriault, D. J., & Minkoff, S. R. (2002). A latent variable analysis of working memory capacity, short-term memory capacity, processing speed, and general fluid intelligence.
Intelli-gence, 30, 163–183.http://dx.doi.org/10.1016/S0160-2896(01)00096-4
Cox, S. R., Ritchie, S. J., Tucker-Drob, E. M., Liewald, D. C., Hagenaars, S. P., Davies, G., . . . Deary, I. J. (2016). Ageing and brain white matter structure in 3,513 U. K. Biobank participants. Nature Communications,
7, 13629.http://dx.doi.org/10.1038/ncomms13629
Elliott, E. M., Cherry, K. E., Brown, J. S., Smitherman, E. A., Jazwinski, S. M., Yu, Q., & Volaufova, J. (2011). Working memory in the oldest-old: Evidence from output serial position curves. Memory & Cognition,
39, 1423–1434.http://dx.doi.org/10.3758/s13421-011-0119-7
Emery, K. J., Volbrecht, V. J., Peterzell, D. H., & Webster, M. A. (2017). Variations in normal color vision. VII. Relationships between color naming and hue scaling. Vision Research, 141, 66 –75.http://dx.doi.org/ 10.1016/j.visres.2016.12.007
Fabiani, M., & Friedman, D. (1997). Dissociations between memory for temporal order and recognition memory in aging. Neuropsychologia, 35, 129 –141.http://dx.doi.org/10.1016/S0028-3932(96)00073-5
Garcia-Suarez, L., Barrett, B. T., & Pacey, I. (2004). A comparison of the effects of ageing upon vernier and bisection acuity. Vision Research, 44, 1039 –1045.http://dx.doi.org/10.1016/j.visres.2003.11.018
Ghisletta, P., & Lindenberger, U. (2005). Exploring structural dynamics within and between sensory and intellectual functioning in old and very old age: Longitudinal evidence from the Berlin Aging Study.
Intelli-gence, 33, 555–587.http://dx.doi.org/10.1016/j.intell.2005.07.002
Gignac, G. E., & Szodorai, E. T. (2016). Effect size guidelines for indi-vidual differences researchers. Personality and Indiindi-vidual Differences,
102, 74 –78.http://dx.doi.org/10.1016/j.paid.2016.06.069
Giorgio, A., Santelli, L., Tomassini, V., Bosnell, R., Smith, S., De Stefano, N., & Johansen-Berg, H. (2010). Age-related changes in grey and white matter structure throughout adulthood. NeuroImage, 51, 943–951.http:// dx.doi.org/10.1016/j.neuroimage.2010.03.004
Grzeczkowski, L., Clarke, A. M., Francis, G., Mast, F. W., & Herzog, M. H. (2017). About individual differences in vision. Vision Research,
141, 282–292.http://dx.doi.org/10.1016/j.visres.2016.10.006
Halpern, S. D., Andrews, T. J., & Purves, D. (1999). Interindividual variation in human visual performance. Journal of Cognitive
Neurosci-ence, 11, 521–534.http://dx.doi.org/10.1162/089892999563580
Herzog, M. H., & Koch, C. (2001). Seeing properties of an invisible object: Feature inheritance and shine-through. Proceedings of the National Academy of Sciences of the United States of America, 98, 4271– 4275. http://dx.doi.org/10.1073/pnas.071047498
Herzog, M. H., Kopmann, S., & Brand, A. (2004). Intact figure-ground segmentation in schizophrenia. Psychiatry Research, 129, 55– 63.http:// dx.doi.org/10.1016/j.psychres.2004.06.008
Hick, W. E. (1952). On the rate of gain of information. The Quarterly
Journal of Experimental Psychology, 4, 11–26. http://dx.doi.org/10
.1080/17470215208416600
Johnson, M. H. (1990). Cortical maturation and the development of visual attention in early infancy. Journal of Cognitive Neuroscience, 2, 81–95. http://dx.doi.org/10.1162/jocn.1990.2.2.81
Jones, J. P., & Palmer, L. A. (1987). An evaluation of the two-dimensional Gabor filter model of simple receptive fields in cat striate cortex. Journal
of Neurophysiology, 58, 1233–1258.http://dx.doi.org/10.1152/jn.1987
.58.6.1233
Jöreskog, K. G. (1978). Structural analysis of covariance and correlation matrices. Psychometrika, 43, 443– 477. http://dx.doi.org/10.1007/BF0 2293808
Kiely, K., & Anstey, K. (2017). Common cause theory in aging. In N. A. Pachana (Ed.), Encyclopedia of geropsychology (pp. 559 –569). Singa-pore: Springer Science⫹ Business Media.
This document is copyrighted by the American Psychological Association or one of its allied publishers. Content may be shared at no cost, but any requests to reuse this content in part or whole must go through the American Psychological Association.
Kurtenbach, A., Langrová, H., Messias, A., Zrenner, E., & Jägle, H. (2013). A comparison of the performance of three visual evoked potential-based methods to estimate visual acuity. Documenta
Ophthal-mologica Advances in Ophthalmology, 126, 45–56.http://dx.doi.org/10
.1007/s10633-012-9359-5
Lahav, K., Levkovitch-Verbin, H., Belkin, M., Glovinsky, Y., & Polat, U. (2011). Reduced mesopic and photopic foveal contrast sensitivity in glaucoma. Archives of Ophthalmology, 129, 16 –22.http://dx.doi.org/10 .1001/archophthalmol.2010.332
Lee, D. K., Itti, L., Koch, C., & Braun, J. (1999). Attention activates winner-take-all competition among visual filters. Nature Neuroscience,
2, 375–381.http://dx.doi.org/10.1038/7286
Li, K. Z., & Lindenberger, U. (2002). Relations between aging sensory/ sensorimotor and cognitive functions. Neuroscience and Biobehavioral
Reviews, 26, 777–783.http://dx.doi.org/10.1016/S0149-7634(02)00073-8
Li, R. W., Edwards, M. H., & Brown, B. (2000). Variation in vernier acuity with age. Vision Research, 40, 3775–3781.http://dx.doi.org/10.1016/ S0042-6989(00)00212-1
Lindenberger, U., & Baltes, P. B. (1994). Sensory functioning and intel-ligence in old age: A strong connection. Psychology and Aging, 9, 339 –355.http://dx.doi.org/10.1037/0882-7974.9.3.339
Lindenberger, U., & Ghisletta, P. (2009). Cognitive and sensory declines in old age: Gauging the evidence for a common cause. Psychology and
Aging, 24, 1–16.http://dx.doi.org/10.1037/a0014986
McBain, R., Norton, D., & Chen, Y. (2010). Is Visual Motion Processing Vulnerable to Early Aging? The Open Behavioral Science Journal, 4, 26 –30.http://dx.doi.org/10.2174/1874230001004010026
McCabe, D. P., Roediger, H. L., McDaniel, M. A., Balota, D. A., & Hambrick, D. Z. (2010). The relationship between working memory capacity and executive functioning: Evidence for a common executive attention construct. Neuropsychology, 24, 222–243.http://dx.doi.org/10 .1037/a0017619
Nasreddine, Z. S., Phillips, N. A., Bédirian, V., Charbonneau, S., White-head, V., Collin, I., . . . Chertkow, H. (2005). The Montreal Cognitive Assessment, MoCA: A brief screening tool for mild cognitive impair-ment. Journal of the American Geriatrics Society, 53, 695– 699.http:// dx.doi.org/10.1111/j.1532-5415.2005.53221.x
Newman, L. M., Trivedi, M. A., Bendlin, B. B., Ries, M. L., & Johnson, S. C. (2007). The relationship between gray matter morphometry and neuropsychological performance in a large sample of cognitively healthy adults. Brain Imaging and Behavior, 1, 3–10.http://dx.doi.org/10.1007/ s11682-007-9000-5
National Institute of Aging. (2015). National institute on aging. Baltimore, MD: Author. Retrieved fromhttps://www.nia.nih.gov/
Norman, J. F., Payton, S. M., Long, J. R., & Hawkes, L. M. (2004). Aging and the perception of biological motion. Psychology and Aging, 19, 219 –225.http://dx.doi.org/10.1037/0882-7974.19.1.219
Owsley, C., McGwin, G., Jr., & Seder, T. (2011). Older drivers’ attitudes about instrument cluster designs in vehicles. Accident Analysis and
Prevention, 43, 2024 –2029.http://dx.doi.org/10.1016/j.aap.2011.05.021
Park, D. C., & Reuter-Lorenz, P. (2009). The adaptive brain: Aging and neurocognitive scaffolding. Annual Review of Psychology, 60, 173–196. http://dx.doi.org/10.1146/annurev.psych.59.103006.093656
Parkin, A. J., & Lawrence, A. (1994). A dissociation in the relation between memory tasks and frontal lobe tests in the normal elderly.
Neuropsycholo-gia, 32, 1523–1532.http://dx.doi.org/10.1016/0028-3932(94)90124-4
Peterzell, D. H., & Kennedy, J. F. (2016). Discovering sensory processes using individual differences: A review and factor analytic manifesto.
Electronic Imaging, 2016, 1–11.
http://dx.doi.org/10.2352/ISSN.2470-1173.2016.16.HVEI-112
Pichora-Fuller, M. K. (2003). Cognitive aging and auditory information processing. International Journal of Audiology, 42(2, Suppl. 2), 26 –32. http://dx.doi.org/10.3109/14992020309074641
Pilz, K. S., Bennett, P. J., & Sekuler, A. B. (2010). Effects of aging on biological motion discrimination. Vision Research, 50, 211–219.http:// dx.doi.org/10.1016/j.visres.2009.11.014
Pilz, K. S., Kunchulia, M., Parkosadze, K., & Herzog, M. H. (2015). Ageing and visual spatiotemporal processing. Experimental Brain
Re-search, 233, 2441–2448.http://dx.doi.org/10.1007/s00221-015-4314-9
Pilz, K. S., Miller, L., & Agnew, H. C. (2017). Motion coherence and direction discrimination in healthy aging. Journal of Vision, 17(1), 31. http://dx.doi.org/10.1167/17.1.31
Raz, D., Perlman, I., Percicot, C. L., Lambrou, G. N., & Ofri, R. (2003). Functional damage to inner and outer retinal cells in experimental glaucoma. Investigative Ophthalmology & Visual Science, 44, 3675– 3684.http://dx.doi.org/10.1167/iovs.02-1236
Raz, N., Lindenberger, U., Rodrigue, K. M., Kennedy, K. M., Head, D., Williamson, A., . . . Acker, J. D. (2005). Regional brain changes in aging healthy adults: General trends, individual differences and modifiers.
Cere-bral Cortex, 15, 1676 –1689.http://dx.doi.org/10.1093/cercor/bhi044
Roinishvili, M., Chkonia, E., Stroux, A., Brand, A., & Herzog, M. H. (2011). Combining vernier acuity and visual backward masking as a sensitive test for visual temporal deficits in aging research. Vision
Research, 51, 417– 423.http://dx.doi.org/10.1016/j.visres.2010.12.011
Roudaia, E., Bennett, P. J., & Sekuler, A. B. (2013). Contour integration and aging: The effects of element spacing, orientation alignment and stimulus duration. Frontiers in Psychology, 4, 356.http://dx.doi.org/10 .3389/fpsyg.2013.00356
Salthouse, T. A. (2009). When does age-related cognitive decline begin?
Neurobiology of Aging, 30, 507–514. http://dx.doi.org/10.1016/j
.neurobiolaging.2008.09.023
Salthouse, T. A., & Czaja, S. J. (2000). Structural constraints on process explanations in cognitive aging. Psychology and Aging, 15, 44 –55. http://dx.doi.org/10.1037/0882-7974.15.1.44
Salthouse, T. A., Hancock, H. E., Meinz, E. J., & Hambrick, D. Z. (1996). Interrelations of age, visual acuity, and cognitive functioning. The Jour-nals of Gerontology: Series B: Psychological Sciences and Social
Sci-ences, 51, 317–330.http://dx.doi.org/10.1093/geronb/51B.6.P317
Schulze-Bonsel, K., Feltgen, N., Burau, H., Hansen, L., & Bach, M. (2006). Visual acuities “hand motion” and “counting fingers” can be quantified with the freiburg visual acuity test. Investigative Ophthalmology & Visual
Sci-ence, 47, 1236 –1240.http://dx.doi.org/10.1167/iovs.05-0981
Spear, P. D. (1993). Neural bases of visual deficits during aging. Vision
Research, 33, 2589 –2609.
http://dx.doi.org/10.1016/0042-6989(93)90218-L
Spencer, J. M. Y., Sekuler, A. B., Bennett, P. J., Giese, M. A., & Pilz, K. S. (2016). Effects of aging on identifying emotions conveyed by point-light walkers. Psychology and Aging, 31, 126 –138.http://dx.doi.org/10.1037/ a0040009
Stratta, P., Daneluzzo, E., Mattei, P., Bustini, M., Casacchia, M., & Rossi, A. (1997). No deficit in Wisconsin Card Sorting Test performance of schizophrenic patients’ first-degree relatives. Schizophrenia Research,
26(2–3), 147–151.http://dx.doi.org/10.1016/S0920-9964(97)00047-9
Strauss, E., Sherman, E. M. S., Spreen, O., & Spreen, O. (2006). A compendium of neuropsychological tests: Administration, norms, and commentary. New York, NY: Oxford University Press.
Taylor, M. M., & Creelman, C. D. (1967). PEST: Efficient estimates on probability functions. The Journal of the Acoustical Society of America,
41(4A), 782–787.http://dx.doi.org/10.1121/1.1910407
Thorpe, S. J., & Fabre-Thorpe, M. (2001). Neuroscience. Seeking categories in the brain. Science, 291, 260 –263. http://dx.doi.org/10.1126/science .1058249
Tibber, M. S., Guedes, A., & Shepherd, A. J. (2006). Orientation discrim-ination and contrast detection thresholds in migraine for cardinal and oblique angles. Investigative Ophthalmology & Visual Science, 47, 5599 –5604.http://dx.doi.org/10.1167/iovs.06-0640 This document is copyrighted by the American Psychological Association or one of its allied publishers. Content may be shared at no cost, but any requests to reuse this content in part or whole must go through the American Psychological Association.
Treutwein, B. (1995). Adaptive psychophysical procedures. Vision Research,
35, 2503–2522.http://dx.doi.org/10.1016/0042-6989(95)00016-X
Tucker-Drob, E. M. (2009). Differentiation of cognitive abilities across the life span. Developmental Psychology, 45, 1097–1118.http://dx.doi.org/ 10.1037/a0015864
Ward, J., Rothen, N., Chang, A., & Kanai, R. (2017). The structure of inter-individual differences in visual ability: Evidence from the general population and synaesthesia. Vision Research, 141, 293–302.http://dx .doi.org/10.1016/j.visres.2016.06.009
Wesemann, W. (2002). Sehschärfebestimmung mit Freiburger Visustest, Bailey-Lovie-Tafel und Landoltring-Tafel. Klinische Monatsblätter für
Augenheilkunde, 219, 660 – 667.http://dx.doi.org/10.1055/s-2002-35168
Wood, A. G., Saling, M. M., Abbott, D. F., & Jackson, G. D. (2001). A neurocognitive account of frontal lobe involvement in orthographic lexical retrieval: An fMRI study. NeuroImage, 14, 162–169.http://dx .doi.org/10.1006/nimg.2001.0778
Yesavage, J. A., Brink, T. L., Rose, T. L., Lum, O., Huang, V., Adey, M., & Leirer, V. O. (1982). Development and validation of a geriatric depression screening scale: A preliminary report. Journal of Psychiatric
Research, 17, 37– 49.http://dx.doi.org/10.1016/0022-3956(82)90033-4
Received January 10, 2018 Revision received March 12, 2019
Accepted March 14, 2019 䡲 This document is copyrighted by the American Psychological Association or one of its allied publishers. Content may be shared at no cost, but any requests to reuse this content in part or whole must go through the American Psychological Association.