Power conversion and luminous efficiency performance of
nanophosphor quantum dots on color-conversion LEDs for
high-quality general lighting
Talha Erdem
a, Sedat Nizamoglu
a, Hilmi Volkan Demir*
a,ba
Department of Electrical and Electronics Engineering, Department of Physics, UNAM – National
Nanotechnology Research Center and Institute of Materials Science and Nanotechnology, Bilkent
University, Ankara 06800, Turkey;
b
Luminous! Center of Excellence for Semiconductor Lighting and Displays, School of Electrical and
Electronic Engineering, and School of Physical and Mathematical Sciences, Nanyang Technological
University, Nanyang Avenue, Singapore 639798, Singapore
ABSTRACT
For high-quality general lighting, a white light source is required to exhibit good photometric and colorimetric performance along with a high level of electrical efficiency. For example, a warm white shade is desirable for indoors, corresponding to correlated color temperatures ≤4000 K, together with color rendering indices ≥90. Additionally, the luminous efficacy of optical radiation (LER) should be high, preferably ≥380 lm/Wopt. Conventional white LEDs cannot
currently satisfy these requirements simultaneously. On the other hand, color-conversion white LEDs (WLEDs) integrated with quantum dots (QDs) can simultaneously reach such high levels of photometric and colorimetric performance. However, their electrical efficiency performance and limits have been unknown. To understand their potential of luminous efficiency (lm/Welect), we modeled and studied different QD-WLED architectures based on layered
QD films and QD blends, all integrated on blue LED chips. The architecture of red, yellow and green emitting QD films (in this order from the chip outwards) is demonstrated to outperform the rest. In this case, for photometrically efficient spectra, the maximum achievable LE is predicted to be 327 lm/Welect. Using a state-of-the-art blue LED reported with a
power conversion efficiency (PCE) of 81.3%, the overall WLED PCE is shown to be 69%. To achieve LEs of 100, 150 and 200 lm/Welect, the required minimum quantum efficiencies of the color-converting QDs are found to be 39, 58 and
79%, respectively.
Keywords: Quantum dot integrated white LEDs, nanoluminophores, power conversion efficiency, luminous efficacy of
optical radiation, luminous efficiency, color rendering index, correlated color temperature, photometry
1.
INTRODUCTION
In 2011, the US Department of Energy announced that 133 TWh of electrical energy can be saved annually by replacing general illumination sources entirely with light emitting diodes (LEDs)1. To realize such a “lighting revolution” at this
scale, however, high photometric performance also needs to be reached by white LEDs, especially for indoor lighting. One of the photometric performance criteria important for general lighting is the luminous efficacy of optical radiation (LER), which is a figure of merit for the perception efficiency of the generated light considering the spectral sensitivity of the human eye. LER is calculated using Eq. (1), where s(λ) is the spectral power distribution of the emitted light and V(λ) is the human eye sensitivity function.
( ) ( ) 683 ( ) opt s V d lm LER W s d λ λ λ λ λ =
∫
∫
(1)Theoretically the highest possible LER is 683 lm/Wopt, while 408 lm/Wopt is the targeted level in practice for
photometrically efficient white LEDs2. Experimentally the highest LER ever reported to date is 357 lm/W
opt, which is
based on using nanophosphors made of semiconductor quantum dots (QDs)3. On top of the LER, a good white light
color rendering index (CRI), which is defined by International Commission on Illumination (CIE). The maximum possible CRI is 100, whereas a good color rendition calls for CRIs over 90. Another important photometric performance criterion results from the need for a warm white hue for indoors, corresponding to a low correlated color temperature (CCT <4000 K). A photometrically efficient white LED should therefore exhibit high performance in all these aspects simultaneously to make a competitive light source against the conventional ones. As important as these photometric requirements, it is essential for a white LED to possess a power conversion efficiency (PCE) around 70% and above to satisfy the requirements of an ultra-efficient source as explained in Ref. 2. This corresponds to a luminous efficiency (LE) of 286 lm/Welect, which shows the amount of radiated power useful to the human eye per supplied electrical power.
This is also equivalent to the product of LER and PCE. LE is calculated using Eq. (2). To satisfy all these criteria at the same time, white light spectrum needs to be designed with great care using at least four color components of narrow emitters placed at the strategic wavelengths at right ratios2,3.
( ) ( ) 683 opt elect s V d lm LE LER PCE W P λ λ λ =
∫
= × (2)High production cost of multichip LEDs (providing every color from a different LED chip) and the green gap problem make multichip approach less competitive against conventional light sources. Today, most commonly used white LEDs are based on the energy down-conversion of blue photons within rare-earth ion based phosphor powders. However, these phosphors lack high photometric performance simultaneously in all criteria at once, although they can exhibit LER ≥270 lm/Wopt4, CRI ≥905, CCT ≤4000 K6 and LE ≥140 lm/Welect7 individually in different implementations. A strong
alternative to the rare-earth phosphors is the semiconductor QD nanophosphors because of their narrow emission bands and tunable wavelengths, which allow for optimization of the photometric performance. It has been shown that LER ≥380 lm/Wopt, CRI ≥90 and CCT ≤4000 K can be achieved using QD color convertors at the same time if the correct
combinations of such QDs are used8. As their in-film quantum efficiencies have reached levels above 70%9, high PCE
and correspondingly high LEs are also possible using these QD nanophosphors as the color converters on a blue (or near-UV) LED chip. However, to date PCE and LEs of such photometrically efficient QD-integrated white LEDs (QD-WLEDs) have not been investigated and their potential for ultra-efficiency high-quality lighting has not been evaluated. In this work, to address these missing points, we modeled and studied power conversion and luminous efficiency performance of QD nanophosphors for high-quality general lighting in different architectures for varying QD efficiencies.
2.
COMPUTATIONAL METHODOLOGY
Our computational models assume four-color mixing QD integrated white LEDs, consisting of green, yellow and red emitting QDs on top of a blue LED chip. In our analysis, only the resulting spectra providing CRI ≥90, LER ≥380 lm/Wopt and 1500 K ≤CCT ≤4000 K are considered in the calculations to ensure high photometric performance for
indoor lighting8. For the device architectures, we modeled the cases where the QD films are placed on a blue LED chip
in the order of red, yellow and green from bottom to top, dubbed Architecture A, and the blend of QDs placed on the LED, called Architecture B (see Figure 1). In addition, Architecture A with a reversed QD order (referred to as Architecture Arev) is also modeled for comparison purposes (although it is clear that it will demonstrate worse performance than A as a result of the absorption of higher energy photons). The emission spectra of the QDs and the blue LED are modeled to be Gaussian, and the corresponding photon transfer equations are derived using the system approach in control theory. In our calculations, we used two different blue LEDs, an ideal one having a perfect PCE of unity and another one with a state-of-the-art performance reported with a PCE of 81.3%10. Considering the near unity extraction
efficiencies obtained recently11,12, the model also assumes all the generated photons manage to be outcoupled from the
device unless absorbed. Another assumption is that there is a mirror at the bottom of the device (e.g., a metal film) so that all the photons are reflected from the bottom part.
Figure 1. Illustration layered architectures A and Arev, and blend architecture B.
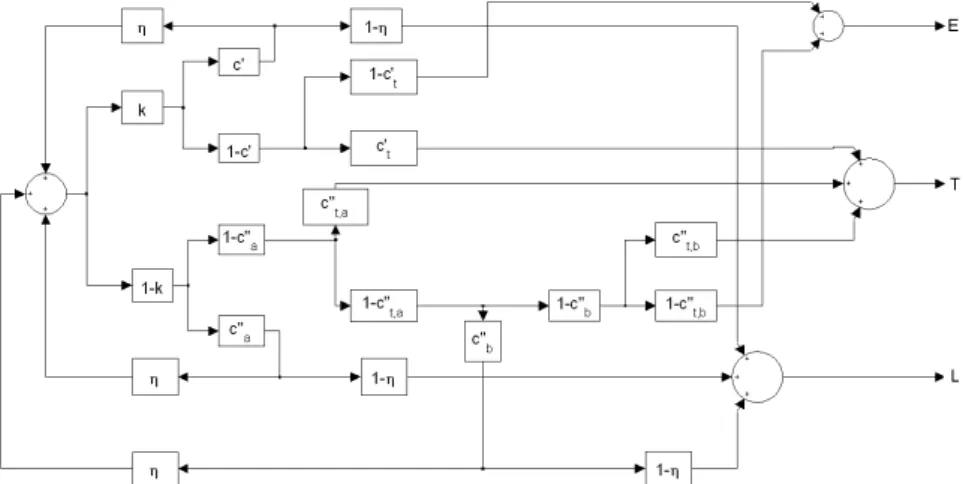
Figures 2 and 3 show white light generation pathways modeled for the layered architectures. In the model during the color conversion process, some of the blue photons from the LED excite red QDs, while some excite yellow QDs and some excite green QDs. The remaining ones are outcoupled. The generated green photons are either extracted or absorbed in yellow and red QDs. Similarly, the generated yellow photons can transfer their energies to red QDs or they are outcoupled. Finally, the generated red photons are outcoupled from the device. In addition to the energy transfer of high energy photons to QDs emitting at longer wavelengths, the generated photons can be self-absorbed by the QD film in which they are generated. Since the photon conversion paths are different in the architectures A and Arev, their governing photon energy transfer equations are also different. These corresponding system box models are sketched for the architectures A and Arev in Figures 2 and 3, respectively. Every box represents the absorbed fraction of the associated photons. These models are applied to each color component and finally the number of blue photons required for obtaining the desired spectra is found. Conclusively, the PCE and LE of various QD integrated white LEDs modeled here are computed. In the next section we present the results and analyses of the QD integrated white LEDs using these models. Further details of the calculations can be found in Ref. 13.
In the system model boxes in Figures 2 and 3, E represents the fraction of photons corresponding to a color component, which remains after self-absorption and radiative energy transfer processes and succeeds to be extracted. T stands for the fraction of photons whose energies are transferred to other QD layers and finally L, for the fraction of photons, which are lost during the self-absorption process due to the non-unity quantum efficiency (η) of the QDs. In these models k is the fraction of the photons that are emitted into upward half-space. This is taken to be ½ for isotropic emission in our calculations. c' denotes the fraction of photons that are self-absorbed following the upward emission whereas c''a and c''b stand for the fraction of self-absorbed photons following the downward emission and also following the reflection from the bottom mirror and upward emission, respectively. Finally, ct and c''t stand for the fraction of the photons that transfer their energy to other QD layers following upward and downward emission, respectively.
Figure 3. Illustration of optical mechanisms using a system box model for the architecture Arev (i.e., the layered QD films in the
reverse order).
The quantum dot blends, however, cannot be modeled in the same way as the layered architectures modeled above. In the case of blends, we modeled the color conversion process to take place in the infinitesimally thin QD columns, which radiate both into upward and downward half-spaces and transfer their energies while propagating in both of these directions as opposed to the layered QD architectures where the energy transfer of a highly energetic photon is only possible following either upward or downward emission. The corresponding optical mechanisms are illustrated in Figure 4 using the system boxes. The notation of this model is very similar to the previous two cases, except for some minor differences. In this case c't denotes the fraction of the photons that transfer their energies after the upward emission. In addition, c''t,a and c''t,b are the fractions of photons that transfer their energies to other QDs following the downward emission and after being reflected by the bottom mirror, respectively. For further details, please refer to Ref. 13.
Figure 4. Illustration of optical mechanisms using a system box model for the architecture B (i.e., the QD blends).
3.
ANALYSES
In our calculations, we used two different blue LEDs, an ideal one having a perfect PCE of unity and another one being state of the art with a reported PCE of 81.3%10. Using the ideal LED, our analyses showed that Stoke’s shift causes a
fundamental loss of at least 15% in the optical power for the photometrically efficient spectra, inevitable due to the nature of down-conversion process, even in the case of unity quantum efficiency (η) of QDs. As a result, the maximum
obtainable LE is 326.6 lm/Welect, corresponding to an overall device PCE of 85% for the integrated chip. However,
considering the state-of-the-art blue LED, this level decreases down to 265.5 lm/Welect, where the corresponding overall
PCE becomes 69%, almost at the ultra-efficiency limit stated in Ref. 2. These results are summarized in Table 1.
Table 1. Maximum, minimum, average, and standard deviation of PCE (taking unity PCE of the blue LED) and LE (taking a PCE of 81.3% for the blue LED) for the photometrically efficient spectra.
max. min. aver. st.
dev.
PCE (%)
(with 100% PCE of blue LED)
84.9 78.4 81.6 1.2 LE (lm/Welect)
(with 81.3% PCE of blue LED)
265.5 242.3 254.2 4.1
In addition, we computed minimum quantum efficiencies for the limiting LE values (with the state-of-the-art PCE of the blue LED taken as 81.3%) assuming the same quantum efficiency for each QD layer. We found that the efficiency needs to be at least 39% and 44% for the architectures A and B, respectively, to obtain a LE of 100 lm/Welect. Increasing the LE
limit to 150 lm/Welect increases the minimum required quantum efficiency levels to 58% and 62% in the film for the
architectures A and B, respectively. Further increase of the LE limit to 200 lm/Welect increases the corresponding
minimum quantum efficiencies to 76% and 78% in the film for the architectures A and B, respectively. The minimum efficiencies for Arev are higher than those of A and B. We made the same analyses for the architecture Arev, in which the QD layers are ordered in the reverse order. This architecture expectedly performed less efficiently in comparison to other architectures and, therefore, the required quantum efficiencies turned out to be higher.
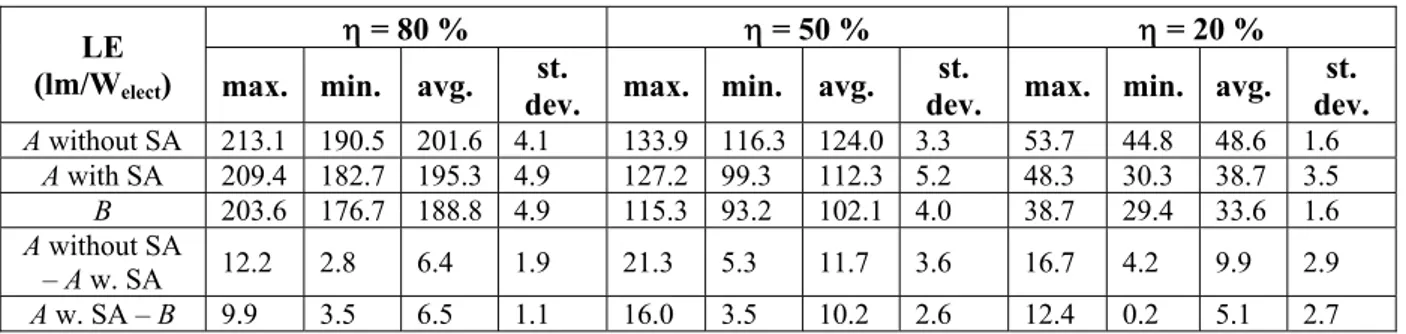
Another investigation has been carried out to examine the effect of quantum efficiencies on LE for different QD integrated white LED architectures. Here η of the two QD-WLED architectures are fixed and their corresponding LEs and PCEs are calculated. The results are summarized in Tables 2 and 3. We found out that the layered QDs in A perform better compared to the blend QDs in B also at the quantum efficiency levels lower than unity. Moreover, LE and PCE are observed not to have a significant change as far as the photometrically efficient spectra are considered. However, we observed that an increased standard deviation of the self-absorption (SA) of the photons causes an increase in the standard deviations of both LE and PCE.
Table 2. Maximum, minimum, average and standard deviation of LE (including PCE of the realistic blue LED) in lm/Welect for the
photometrically efficient designs at QD quantum efficiency levels of η = 80%, 50% and 20% for two different architectures: A and B (SA: self-absorption).
LE
(lm/W
elect)
η = 80 %
η = 50 %
η = 20 %
max. min. avg.
dev.
st.
max. min. avg.
dev.
st.
max. min. avg.
dev.
st.
A without SA 213.1 190.5 201.6 4.1 133.9 116.3 124.0 3.3 53.7 44.8 48.6 1.6 A with SA 209.4 182.7 195.3 4.9 127.2 99.3 112.3 5.2 48.3 30.3 38.7 3.5 B 203.6 176.7 188.8 4.9 115.3 93.2 102.1 4.0 38.7 29.4 33.6 1.6 A without SA – A w. SA 12.2 2.8 6.4 1.9 21.3 5.3 11.7 3.6 16.7 4.2 9.9 2.9 A w. SA – B 9.9 3.5 6.5 1.1 16.0 3.5 10.2 2.6 12.4 0.2 5.1 2.7 We also investigated the photon transfer fractions in the architectures A and B at the quantum efficiency levels of 100% and 50%. In the case that η=100%, the red QD film is the one where most of the blue photons are absorbed. In the architecture A, the yellow QDs follow the red ones in terms of blue photon absorption. However, the green and yellow QDs absorb almost the same number of blue photons in the architecture B. An interesting point is that most of the green photons manage to be extracted without being absorbed in contrast to blue photons for both of the architectures. The same trend is observed for yellow photons as well; most of them outcouple and only a small fraction is absorbed by the
red QDs in both of the designs. A deeper investigation also reveals that more yellow photons are absorbed by the red QDs in the blend case compared to the layered architecture A. When the quantum efficiencies of the QDs are decreased to 50%, any important change in the photon transfer fractions is not observed for the architecture A. However, in the architecture B, some changes are observed in the photon transfer fractions to the QDs. In this case, we observe that green photons transfer their energies almost equally to the other QDs in contrast to the case of η=100%. Another point worth paying attention is about the energy transfer of blue photons in B. In the case of η=50%, blue photons are mostly absorbed by the yellow QDs whereas they are absorbed mostly by the red QDs if η is 100%.
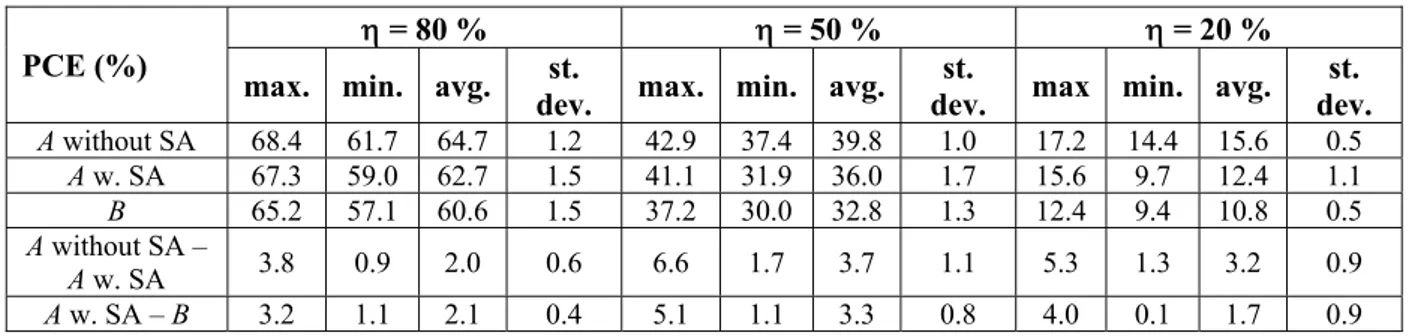
Table 3. Maximum, minimum, average and standard deviation of PCE (with PCE of the blue LED taken as 100%) in percentages for the photometrically efficient spectra with QD’s η = 80%, 50% and 20% for two different architectures. The effect of self-absorption (SA) is also investigated for the architecture A.
PCE (%)
η = 80 %
η = 50 %
η = 20 %
max. min. avg.
dev.
st.
max. min. avg.
dev.
st.
max min. avg.
dev.
st.
A without SA 68.4 61.7 64.7 1.2 42.9 37.4 39.8 1.0 17.2 14.4 15.6 0.5 A w. SA 67.3 59.0 62.7 1.5 41.1 31.9 36.0 1.7 15.6 9.7 12.4 1.1 B 65.2 57.1 60.6 1.5 37.2 30.0 32.8 1.3 12.4 9.4 10.8 0.5 A without SA – A w. SA 3.8 0.9 2.0 0.6 6.6 1.7 3.7 1.1 5.3 1.3 3.2 0.9 A w. SA – B 3.2 1.1 2.1 0.4 5.1 1.1 3.3 0.8 4.0 0.1 1.7 0.9 A final analysis has been carried out to understand the effect of the quantum efficiency variation of the QDs in the architectures A and B. For this purpose, while the efficiency of two of the QDs is fixed, the other one is varied between 20% and 100%. As the test spectra, we chose the ones giving the highest PCE when three η values are equal. If η is fixed at 100%, 80% and 50%, the red component has the strongest effects on PCE and LE of the device in all architectures. The main reason of the criticality of the red QD efficiency is the dominance of the red color component in the photometrically efficient spectra8. However, decreasing the fixed quantum efficiency to 20% makes the efficiency of
the green QDs the most effective one for A and B. This is mainly due to the fact that green photons are the most energetic photons that are generated by the QDs in these architectures.
4.
CONCLUSION
In conclusion, in this work we studied power conversion and luminous efficiencies of nanophosphor QD integrated white LEDs through our computational models to predict their potential luminous and power conversion efficiency performances for varying quantum efficiencies in different architectures. These results indicate that QD-WLEDs offer the potential to surpass the performance of phosphor-based WLEDs both photometrically and electrically when high enough quantum efficiencies of the QDs and LEDs together with high extraction efficiencies are realized. In addition to these, we also found that putting red, yellow and green QD layers on blue LED (the architecture A) is the most efficient one for color conversion QD-WLEDs compared to the QD blends (the architecture B) whereas reversing the order of the QD layers in B causes the power conversion efficiency to be the lowest among these three different designs. We also found that, to obtain representative luminous efficiencies of 100, 150 and 200 lm/Welect, the required quantum
efficiencies of the QDs are 39%, 58% and 76%, respectively, in the case that a state-of-the art blue LED having a PCE of 81.3% is used and the efficiencies of the QDs are the same.
ACKNOWLEDGEMENTS
We acknowledge the financial support in part by ESF EURYI, EU FP7 Nanophotonics4Energy NoE, and TUBITAK under the Project No. EEEAG 109E002, 109E004, 110E010, and 110E217, and in part by NRF-CRP6-2010-02 and NRF RF 2009-09. HVD acknowledges additional support from TUBA-GEBIP and TE acknowledges TUBITAK-BIDEB.
REFERENCES
[1] Energy Savings Estimates of Light Emitting Diodes in Niche Lighting Applications, Building Technologies Program, Office of Energy Efficiency and Renewable Energy, U.S. Department of Energy (2011).
[2] Phillips, J. M., Coltrin, M. F., Crawford, M. H., Fischer, A. J., Krames, M. R., Mueller-Mach, R., Mueller, G. O., Ohno, Y., Rohwer, L. E. S., Simmons, J. A. and Tsao, J. Y. “Research challenges to ultra-efficient inorganic solid-state lighting,” Laser & Photon. Rev. 1(4), 307-333 (2007).
[3] Nizamoglu, S., Erdem, T., Sun, X. W. and Demir, H. V. “Warm-white light-emitting diodes integrated with colloidal quantum dots for high luminous efficacy and color rendering,” Opt. Lett. 35(20), 3372-3374 (2010). [4] Krames, M. R., Shchekin, O. B., Mueller-Mach, R., Mueller, G. O., Zhou, L., Harbers, G. and Craford, M. G.
“Status and future of high-power light-emitting diodes,” J. Display Technol. 3(2), 160-175 (2007). [5] http://www.zenigata.de (accessed on August 17, 2011).
[6] http://www.cree.com/press/enlarge.asp?i=1174480795673 (accessed on August 17, 2011). [7]
http://www.osram- os.com/osram_os/EN/Press/Press_Releases/Solid_State_Lighting/2011/From_the_OSRAM_laboratory_-_efficiency_record_for_warm_white.html (accessed on August 17, 2011).
[8] Erdem, T., Nizamoglu, S., Sun, X. W. and Demir, H. V. “A photometric investigation of ultra-efficient LEDs with high color rendering index and high luminous efficacy employing nanocrystal quantum dot luminophores,” Opt. Express 18(1), 340-347 (2010).
[9] Jang, E., Jun, S., Jang, H., Lim, J., Kim, B. and Kim, Y. “White-light-emitting diodes with quantum dot color converters for display backlights,” Adv. Mater. 22(28), 3076-3080 (2010).
[10] Narukawa, Y., Ichigawa, M., Sanga, D., Sano, M. and Mukai, T. “White light emitting diodes with super-high luminous efficacy,” J. Phys. D: Appl. Phys. 43(35), 354002 (2010).
[11] Matioli, E., Rangel, E., Iza, M., Fleury, B., Pfaff, N., Speck, J., Hu, E. and Weisbuch, C. “High extraction efficiency light-emitting diodes based on embedded air-gap photonic-crystals,” Appl. Phys. Lett. 96, 031108 (2010).
[12] Tsai, M.-A., Wang, H.-W., Yu, P., Kuo, H.-C. and Lin, S.-H. “High extraction efficiency of GaN-based vertical-injection light-emitting diodes using distinctive indium–tin-oxide nanorod by glancing-angle deposition,” Jpn. J. App. Phys. 50, 052102 (2011).
[13] Erdem, T., Nizamoglu, S., and Demir, H. V. “Power conversion and luminous efficiency performance of semiconductor quantum dot nanophosphors on light-emitting diodes,” submitted.