COMMUNICATIONS
The Communications section is for short contributions which are not of such urgency as to justifY publication in Applied Physics Letters and are not appropriate for regular Articles. They should not generally exceed in length five double-spaced typewritten pages or three printed columns including allowances for illustrations, references, and tables. Communications shoulds be reasonably self-contained and not mere announcements of proposed research or of more comprehensive studies to be published later. Substantive comments or addenda to previously published articles may possibly fit these criteria. Manuscripts intendedfor this section should be accompanied by a brief abstract for information-retrieval purposes. Accepted manuscripts will follow the same publication schedule as articles in this journal, and galleys will be sent to authors.
A physical model for acoustic signatures
Abdullah AtalarEdward L. Ginzton Laboratory, Stanford University, Stanford, California 94305
(Received 1 June 1979; accepted for publication 10 July 1979)
A physical model is presented to explain the interference phenomenon that gives rise to the material-dependent signature obtained from an acoustic reflection microscope. An approximate formula is derived for the peak separation of the characteristic response, and it agrees well with the experimental results.
PACS numbers: 43.20.Fn, 43.20.Bi, 68.25.
+
j, 62.20.DcIt was found that the characteristic response of the acoustic microscope treated as a "signature" gives informa-tion about the elastic properties of the material under exami-nation. 1.2 The signature is obtained by recording the output
of the microscope as the spacing between the acoustic lens and the object is varied. An angular spectrum approach can be exploited to predict this characteristic response for single crystals as well as for layered media.3
,4
terms of the incident field at the same plane (ul+), the
reflec-tor parameters, and the position:
In a recent article,5 Weglein explores the period of acoustic signatures for a number of materials and successful-ly finds an empirical formula that predicts AZ, the charac-teristic period of the response. However, the physical model given has some serious inaccuracies. There the "Schoch dis-placement" is assumed to be proportional to the axial trans-lation of the object from the focal plane-which has no justi-fication. Moreover, in the suggested ray model, the phase shift between the specularly reflected and the displaced wave is related to the size of the displacement. It can be seen that this phase shift is independent of the displacement (in fact, it is a constant: 180°) when the extra path in the liquid traveled by the specularly reflected wave is included.
In this paper we will present a model to describe the interference phenomenon and find an expression for the peak separation. For this purpose we will refer to an earlier work3 and use some of the expressions derived there.
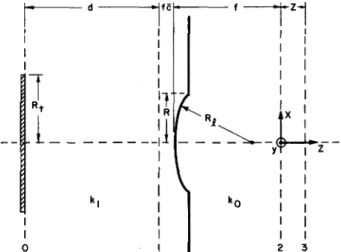
The geometry of the acoustic microscope and the co-ordinate system used for analysis are depicted in Fig. 1. The planes labeled 1 and 2 represent the back and front focal planes of the lens. Plane 3 is the plane ofthe reflector, and it is a distance Z from the front focal plane. R is the radius of the pupil function P of the lens. In the discussion that fol-lows, the superscripts
+
and - refer to fields propagating in the+
z and - z direction, respectively. Further details of the acoustic microscope can be found elsewhere.6Equation (11) of Ref. 3 uses a paraxial approximation to express the reflected field at the back focal plane (u 1-) in
ul-(x,y)~ul+( -x, - y)PI( -x, - y)P2(x,y)
X exp [ - j(koZ /f2)(X2
+
i)
]~(x/J,y/f) ,where a constant phase factor is neglected. The exponential factor must be replaced by
explj2koZ [1 - (X/f)2 - (y/f)2]
112]
for the nonparaxial case. If circular symmetry exists and PI
~P2 ~P is assumed, we can write
u l- (r)
=
u l+ (r)p2(r)xexplj2koZ [1 - (r/f)2p/2]~(r/f).
In this equation ~(sinO) is the reflectance function of the liquid-solid interface. If water is used as the liquid medium, the amplitude of ~ is very close to unity for most materials due to high impedance mismatch. The results would not be
FIG. 1. Geometry and coordinate system of the acoustic microscope as used in analysis.
8237 J. Appl. Phys. 50(12), December 1979 0021-8979/79/128237-03$01.10 © 1980 American Institute of Physics 8237
[This article is copyrighted as indicated in the abstract. Reuse of AIP content is subject to the terms at: http://scitation.aip.org/termsconditions. Downloaded to ] IP: 139.179.111.10 On: Fri, 18 Oct 2013 16:35:01
altered appreciably if we set
I
f!Ill=
lover the entire range. On the other hand, the phase of f!Il is crucial and it has a transition which varies considerably from material to mate-rial This large phase variation occurs at the Rayleigh criti-cal angle that is determined largely by the Rayleigh wave velocity in the medium. If this velocity is less than the sound velocity in liquid, there is no transition in the phase and the function f!Il can be considered to be unity for our purposes.Now, let us assume that u\+ is a plane wave and ut = 1. This is equivalent to assuming an infinite size trans-ducer. For a circular pupil of radius R, P (r) = circ(r/R), we find that
u\-(r)
=
circ(r/R) exp{j2koZ [1 - (rljf]1I2}f!Il(r/j). First consider the case where the reflectance function can be neglected, i.e., the Rayleigh velocity in the solid medi-um is less than the sound velocity in the liquid. For Z = 0, the wave fronts of the reflected wave are parallel to the trans-ducer. In this situation the transducer output is maximum. But for Z #0 the wave fronts have a curvature given by the exponential factor. The output voltage is reduced since wave fronts are tilted with respect to the transducer. The acoustic signature, expressed as V (Z), can be easily found fromV (Z) = 21T
1
00ru \+ (r)u \- (r) dr
to give V(Z) = 1TR 2 exp( - jx)(sinx/x), where
x = 1TR 2Z /}.J2. Therefore the separation between the peaks is given by LiZ
=
}.J2/ R 2 which depends only on lens parameters and the wavelength in the liquid.Now consider the case when the Rayleigh velocity is high enough so that the critical angle is within the angles covered by the lens. This requires the Rayleigh velocity VR
be at least V J I R where Vo is the sound velocity in the liquid. Under these circumstances, the phase of the reflected wave is affected by two factors: reflectance function phase and the exponential defocusing factor. When the object is located at the focal plane (Z
=
0), the exponential factor is unity and thus the wave fronts of the reflected wave take the shape of the reflectance phase function. This is demonstrated byFIG. 2. The shape of the reflected wave fronts at the back focal plane of the lens (plane I) for a single-crystal reflector. Wave front A is for Z =
o.
Wave fronts B and C are for increasingly negative values of Z.8238 J. Appl. Phys., Vol. 50, No. 12, December 1979
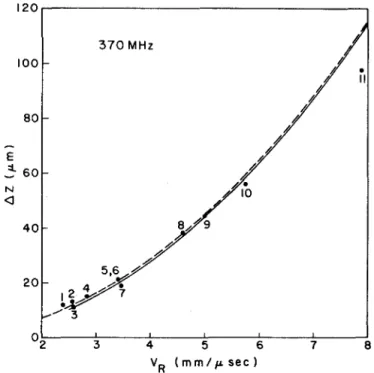
120r---, 100 80 E .:- 60 N <l 40 20 370 MHz °2~----~3---4~----~5~----~6----~7~--~8 V R (m m / p. se c )
FIG. 3. Periodicity of the acoustic signatures versus mean Rayleigh velocity of the materials. Experimental points (dots) (I. W, 2. GaAs, 3. 7059 Glass, 4. AI, 5, F.Q., 6. LiNb03 , 7. Quartz, 8. Si [1I1], 9. Si [100], 10. AI, 03 , 11.
Be), theoretical curve (solid line) and Weglein's empirical formula (dashed line) are shown.
curve A in Fig. 2. We note that a phase shift of 21T corre-sponds to a whole wavelength}.. In this case the output ofthe transducer is large since most of the wave front is parallel to the transducer. There is not appreciable contribution to out-put from the region corresponding to the transition. If the object is brought closer to the lens (Z
<
0), the exponential factor comes into play and adds a curvature to the wave fronts as illustrated in Fig. 2 by wave front B. For this case the main contribution to the output comes from the region where the wave fronts are more or less parallel to the trans-ducer. There are two contributions: one is around r::::;:O [la-beled by (1)], and the other around r::::;:jsin(}R [la[la-beled by (2)]. The second region is created by the fact that the wave-front tilt due to the reflectance function is partially compen-sated by the wavefront tilt due to the exponential factor. The transducer output can be found by adding the contributions vectorially. Therefore the phase relationship between these two quantities must be considered. If they are in phase they will add up to give a peak, but if they are out of phase there will be a dip. To have a peak, the phase difference between (2) and (1) should be 2n1T (n=
1,2, ... ). Hence we write2koZ
[1 -
(rlj)2] 1I2lr=tsin6R-2koZ[I-(rlj)2]1I2Ir=o =2n1T. From this we arrive at the result
- n}.o
Z= , n = 1,2, ...
2(1 - COS(}R)
for the position of the peaks. Therefore the distance between the successive peaks (or nulls) is predicted as
Communications 8238
[This article is copyrighted as indicated in the abstract. Reuse of AIP content is subject to the terms at: http://scitation.aip.org/termsconditions. Downloaded to ] IP: 139.179.111.10 On: Fri, 18 Oct 2013 16:35:01
(1) We note that this interference phenomenon occurs only for negative Z. For Z positive, the dominant function is the sinc function described earlier. Equation (1) is plotted as a solid line in Fig. 3 along with Weglein's experimental measure-ments.s We add that
LiZ = Aof2(1 - cosOR):::::Aofsin20R = ARfsinOR ,
where the last result is the empirical formula quoted by Weg-lein. This is also plotted in Fig. 3 as a dashed line for comparison.
For tungsten (material 1 ) the Rayleigh velocity is lower than Vof fR, and hence the acoustic signature is not very sensitive to material parameters. The peak separation is dominantly determined by the sinc function7:
LiZ = Aof2fR 2~1O lim, VR
<
Vol fR .This value agrees with Weglein's measurements for tungsten.
For Lucite (not shown), the Rayleigh velocity is less than Vo , hence there is no transition in the phase of the reflection corresponding to the Rayleigh velocity. But the impedance of this material is low enough to give rise to a considerable change in phase at the "critical angle for longi-tudinal waves (0 L)'" This phase change can cause the inter-ference phenomenon described earlier. Therefore, we can include materials like Lucite in our model if we interchange
OR by OL in Eq. (1).
For layered media, there may be several transitions in the reflectance function phase. The number of transitions increase as the layer thickness increases. These fast phase
8239 J. Appl. Phys., Vol. 50, No. 12, December 1979
variations arise from various modes excited in the layer. A combined effect of all the transitions determine the nature of the acoustic signature. However, one finds that for a layer thicker than a few Rayleigh wavelengths, the substrate has-for most cases-negligible effect on the microscope output. In other words, the sensitive penetration region is approximately one Rayleigh wavelength deep.
Since the acoustic signatures are the dominant mecha-nism that determines the contrast in final acoustic images, one hopes that the signatures are strongly dependent on the material properties. This requires the Rayleigh velocity of the material to be higher than twice the/number times the sound velocity in the liquid. Finally we add that the given model is only approximate, and one has to carry out the exact integration if an accurate result is desired.
The author would like to thank Professor C.F. Quate for drawing his attention to this problem and for valuable suggestions. This research was supported by the Advanced Research Projects Agency of the Department of Defense and was monitored by the Air Force Office of Scientific Research under Contract No. F49620-78-C-0098.
'Ao Atalar, C.F. Quate, and H.K. Wickramasinghe, Appl. Phys. Lett. 31, 791 (1977).
'R.D. Weglein and R.G. Wilson, Electron. Lett. 14, 352 (1978). 'A. Atalar, J. Appl. Phys. 49, 5130 (1978).
'H.K. Wickramasinghe, Electron. Lett. 14,305 (1978). 'R.D. Weglein, Appl. Phys. Lett. 34, 179 (1979).
'R.A. Lemons and C.F. Quate, Physical Acoustics, edited by R.N. Thurston (Academic, New York, 1979), Vol. 14.
'C.F. Quate (private communication).
Communications 8239
[This article is copyrighted as indicated in the abstract. Reuse of AIP content is subject to the terms at: http://scitation.aip.org/termsconditions. Downloaded to ] IP: 139.179.111.10 On: Fri, 18 Oct 2013 16:35:01
View publication stats View publication stats