'■ :?.ft,n .'
Ф ^ 'і í^ Q A b -í ¿ .S á iSÂ iy- '■ S ,Ä }”'fclv ^FV■^Wΐí^^;YV ^ T ï W i ' T ^ ■■ ' '
PERSONAL COMPUTER PURCHASE CRITERIA AND DIFFERENCES BETWEEN EXPERT AND QUASI-EXPERT
UNIVERSITY STUDENTS
MASTER THESIS SUBMITTED TO THE DEPARTMENT OF MANAGEMENT AND GRADUATE SCHOOL OF BUSINESS ADMINISTRATION
EBRU GULCU JUNE 1994
W f
I certify that I have read this thesis and in my opinion it is fully adequate, in scope and quality, as a thesis for the degree of Master of Business
Administration.
Assoc. Prof Gtiliz Ger
1 certify that 1 have read this thesis and in my opinion it is fully adequate, in scope and quality, as a thesis for .the degree of Master of Business
Administration.
Assoc. Prof Dilek Onkal
I certify that I have read this thesis and in my opinion it is fully adequate, in .scope and quality, as a thesis for the degree of Master of Business
Administration.
Assoc. Prof Can §imga Mugan
Approved for the Graduate School of Business Administration. Prof Sjibidey Togan
A B ST R A C T
PERSONAL COMPUTER PURCHASE CRITERIA
BY
EBRU GÜLCÜ
SUPERVISOR: Assoc. Prof. Güliz GER
Computers have become a part o f our daily life at offices, schools,
hospitals, and even at home. Whether it fosters increased personal
productivity, raises creativity or helps to organize, more people are
planning to own a personal computer in Turkey. This study
analyses Turkish consumers' personal computer purchase criteria.
It aims to help PC marketer with their marketing strategy in such a
fast paced and growing market.
Keywords : Personal Computer, purchase, criteria, tangible-intangible, attribute, importance, marketing, high-technolog\>, industrial product , microcomputer, choice, computer, buying , role, computer selection, factor analysis, hypothesis testing, complex products,! product life cycle, buyer behavior, marketing strategy^ attitude, usage, evaluation, depth intenuews, cptalitative analysis
ÖZET
KİŞİSEL BİLGİSAYAR SATIN ALMA KRİTERLERİ
EBRU GÜLCÜ
TEZ DANIŞMANI : Doç. Dr. Güliz Ger
Bilgisayarlar,
bürolarda,
okullarda,
hastanelerde
ve
nihayet evlerde hayatımızın bir parçası haline gelmiştir.
Sebep
ister
üretkenliği,
yaratıcılığı
arttırmak,
İster
organize olmak olsun, her geçen gün daha fazla İnsan PC
almayı planlamaktadır. Bu çalışma, Türk tüketicilerinin
kişisel bilgisayar satın alma kriterlerini incelemektedir.
Çalışmanın amacı
PC
pazarlamacılarına,
çok
hızlı
değişen ve büyüyen bu pazarda, planlama stratejilerini
hazırlamada yardımcı olmaktır.
Anahtar Kelimeler: Kişise! Bilgisayar, satın ainıa, kriier, fıziksei-fızikseJ olmayan,
özellikler, önemlilik, yüksek teknoloji, endüstri ürünü, mikrobilgisayar, seçenek, seçim, faktör analizi, hipotez testi, kompleks ürünler,, ahcı davranışları, tavır, kullanım,
ACKNOWLEDGMENTS :
1 gratefully acknowledge patient supemsion and helpful comments of Assoc. Prof Guliz Ger, throughout the preparation of this study. 1 would also like to express my thanks to the other members of the examining committee, Assoc. Prof Dilek Onkal and Assoc. Prof Can §imga Mugan, for their contribution and valuable suggestions.
I would also like to thank Osman Tuzun for his invaluable support and encouragement throughout the study.
TABLE OF CO N TEN TS
A B ST R A C T ...i
Ö Z E T ... ii
ACKNOW LEDGMENTS... iii
TABLE OF CONTENTS... iv
LIST OF TA B LES...v
I) INTRODUCTION ;...I II) LITERATURE REVIEW;... 2
A) HISTORY OF COMPUTERS;...2
B) ADOPTION PROCESS AND DIFFUSION OF INNOVATION ; ... 3
■ C) WH Y DO PEOPLE BUY PCs?... 5
D) HOW DO PEOPLE BUY PCs ? ... 7
E) WHAT INFORMATION SOURCES DO BUYERS U SE?... 10
III) PRESENT RESEARCH ; ... 12
A) PURPOSE OF THE STUDY ; ... 12
B) RESEARCH DESIGN AND METHODOLOGY;... 13
i) Sample ; ...13
ii) Questionnaire Design and Application ; ...14
C) ANALYSIS AND RESULTS ;... 16
i) Qualitative Data Analysis;... 16
ii) Comparisons of Experts Vs Quasi-Experts Using Descriptive Analysis and Hypothesis Testing;... 17
a) Usage of Information Sources;...1,8 b) Model Selection;...18
c) Brand/Vendor Selection;... 21
d) Computer Literacy and Computer U sag e ;...24
iii) Reduction of the variables and Factor A nalysis;...25
IV) CONCLUSION ; ...27
APPENDIX 1 ; ... 33
APPENDIX 2 ; ...42
APPENDIX 3 ; ...31
LIST OF TABLES
TABLE 1. Demographical Data For the Sample ...32
TABLE 2. Information Sources Used Before Buying a P C ... 55
7’ABLE 3. Oneway and T-Test Results For Information S o u rces...56
TABLE 4a. Reliability of Information Sources... 57
1 ABLE 4b. Efii'ectiveness of Infonnation S ources...58
TABLE 5. Factors Considered While Buying A PC ; When deciding about the M odel... 59
TABLE 6. What Did The Sample First Decide On While Buying A P C ?...60
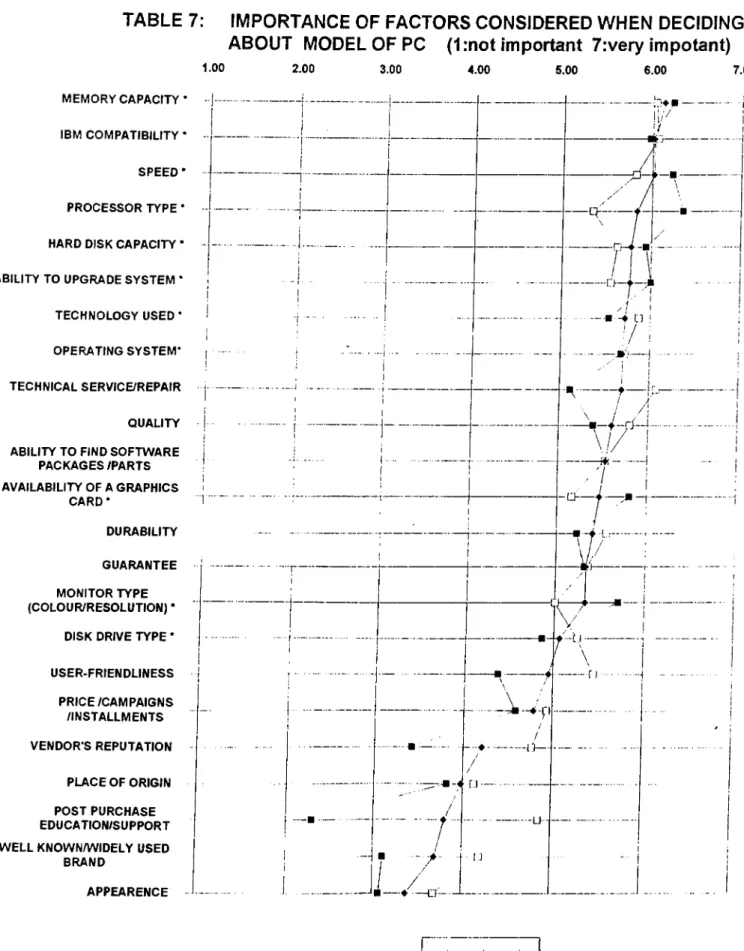
TABLE 7. Importance Profile of Factors Considered. When deciding about the Model ... 61
TABLE 8. Oneway and T-Test Results For Factors Considered While Buying A PC : When Deciding About The M o d e l...62
1 ABLE 9. Factors Considered While Buying A PC : When deciding about Brand/Vendor... 63
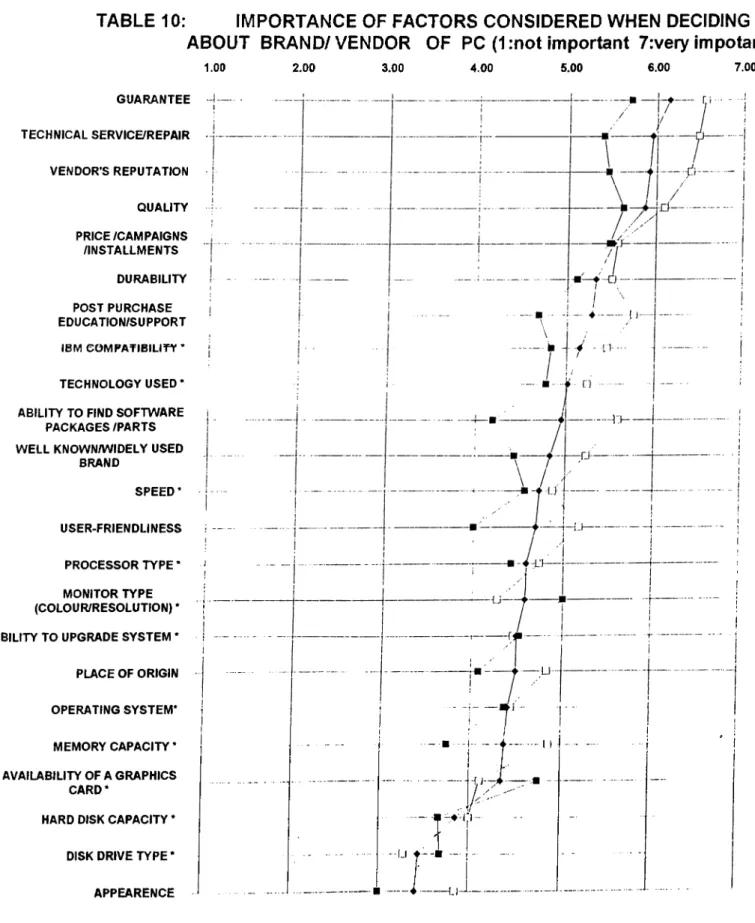
TABLE 10. Importance Profile of Factors Considered: When deciding about the Brand/Vendor... 64
TABLE 11 Oneway and T-Test Results For Factors Considered While Buying A PC ; When Deciding About The B rand/V endor... 65
TABLE 12. Rates Given To PCs From Different O rig in s... 66
TABLE 13a. Computer Literacy Levels : For E xperts...67
TABLE 13b. Computer Literacy Levels : For Q uasi-Experts...68
TABLE 15a. For What Purposes Do You Use Your P C ? ...70
TABLE 15b. How Long Have You Been Using Com puters?...70
TABLE 16a. How Often Do You Use Your Computer?...71
TABLE 16b. How Many Hours Do You Use Your Computer In a W eek ?...71
TABLE 17a. Faetor Structure of Decision Criteria : Choosing M o d el... 72
TABLE 17b. Factor Structure of Decision Criteria ; Choosing B rand/V endor.... 73
TABLE 18a. Oneway and T-test results of Factor Variables: Choosing Model .. 74
TABLE 18b. Oneway and T-test results of Factor Variables: Choosing Brand/Vendor ...75
n INTRODUCTION
Besides their extensive use in offices, j3ersonal computers are also becoming part of our daily life at home. For one reason or another, more people in Turkey , now are considering to have a personal computer (PC) at home. As a result, Turkey is witnessing a growing personal computer market.
There are a variety of different brands of personal computers available to the Turkish market, with huge price and quality discrepancies. The information on the quality and other characteristics of each brand may be unknoum or meaningless to the individual buyer, however despite these drawbacks the decision has to be made.
The decision to purchase a PC involves acquiring basic knowledge, determining generic software (SW) needs, selecting appropriate hardware (HW), determining costs, selecting a vendor, and purchasing and implementing the system.
The aim of this study is to explore the personal computer purchase criteria of individuals (university students) who are about to buy or have bought a personal computer recently. Studying this sample is important for the PC marketers to anticipate the purchase criteria of their target market and to alter their strategies to position themselves in such a competitive industry. In 1992, number of PC sales in Turkey was 103 thousand, while it was over 2 million in Germany. The PC market in Turkey is unsaturated and is expected to grow rapidly.
This study also attempts to provide some background on which infonnation sources are used before buying a personal computer, and how' reliable and effective these sources are anticipated.
In order to explore more deeply about the PC buyers' behavior, demographic data, reasons for buying a PC, and computer literacy levels of the respondents are also gathered. University students with different educational backgrounds and with different expertise levels of work wnth computers are investigated with the buyer behaviors.
ID LITERATURE REVIEW:
The literature on the evolution of the PC market in the world, adoption process of innovation, diffusion of innovation together w th why and how do people buy PCs, what information sources they use are summarized below for both individual and industrial buvers.
A) HISTORY OF COMPUTERS:
The grou4h of personal computer industry has been spectacular. The industry began with MITS, a small compan>' that sold kit calculators. MITS was , nearly driven out of business when a competitor marketed a fully assembled calculator for less than half the selling price of MITS model. MITS, developed a kit computer called Altair 8800 in early 1975. It was expected to sell 500 and instead it was deluged with 5000 paid orders within three months. The softw'are language BASIC w^as written for Altair in 1975 and the first computer clubs were founded. Apple computer was founded in 1976: in 1978 the application spreadsheet program Visicalc was introduced, which brought the PCs into the office. In 1984 5.2 million PCs were sold in USA ,(NOLD,1985)
In many world markets, the computer for the consumer is still in the introduction stage of its product life-cycle, so as it is in Turkey. The level of economic development is one of the critical factors determining the need for computers. It also indicates the country's ability to purchase the equipment. Many less developed countries are not yet able to use complex computer systems efficiently and hence they have limited needs for such equipment. The speed at which an economy industrializes indicates the rate of increasing need for computers (Samli & Willis, 1989).
In 1992, the number of personal computers in the world was 123 million, of which 0.4 % or 520,000 were in Turkey. Jn the same year, Turkey's per capita data processing expenditure was USD 10. However, growth of nearly 30% in the infomiics sector over recent years indicates that Turkey is a countn' W'hich will rapidly overcome the limited infonnation economy stage within the next few years. The boom in personal computer sales from 103,000 in 1992 to an
eslinialcd 150,000-180,000 in 1993 are evidence of a signiiicanl growth rate in this industiy. The forecast sales of personal computers for 1994 is over 200,000 (Curses, 1994)
B) ADOPTION PROCESS AND DIFFUSION OF INNOVATION :
An iwiovation is "any idea, practice or material artifact perceived to be new by the relevant adopting unit" (Loudon, Della Bitta, 1988). A personal computer is usually pul into the category of discontinuous innovations since this type of innovation involves the establishment of new products with new behavior patterns.
The acceptance and continued use of a product or brand by an individual is refeiTcd to as "adoption". The adoption process consists of 6 stages :
- Awareness ; potential adopter finds out about the existence of a product but has veiy little information and no well-formed attitudes about it
- Comprehension ; this stage represents the consumer's having knowledge and understanding of what the product can do
- Attitude ; consumer develops favorable or unfavorable predisposition toward the product
- Legitimation ; consumer becomes convinced that the product should be adopted
- T ria l; the consumer tests or tries the product to determine its utility
- Adoption : consumer determines whether or not to use the product in a full-scale way.
People do not adopt an innovation all at the same time. Consumers can be classified on the basis of time of adoption. Five adopter categories have been identified : innovator, early adopter, early majority), late majority’, and
While mass media is found to be more eifective in the early stages of the adoption process, at tlie later stages personal sources of information like personal selling, word of mouth are more important. There are six product characteristics that seem to iniluence the rate and extent of an adoption of an innovation ;
1) r·^dative advantage is the degree to which an innovation is perceived as superior to preceding products or those wdh which it wnll complete. This might be reflected in longer life, easier maintenance, or other measures. Products that have a strong relative advantage will be adopted more rapidly. The greater tlie perceived relative advantage of using a PC (e g. preparing income taxes and keeping financial records), the more quickly the PC udl be adopted.
2) Compatibility is the degree to which an innovation is consistent with existing consumer values and past experiences of adopters. Acceptance wnll be retarded for new products that are not compatible with consumers' norms. For example, PCs are highly compatible with the life styles found in upper- middle-class homes.
3) Complexity refers to how difficult the innovation is to understand and use. Diffusion will tend to be slow for more complex items. PCs are complex and will therefore take a longer time to penetrate into home use.
4) Triabilitv (or divisibility) is the extent to which an innovation may be tried on a limited basis. Where an item cannot be sampled on a small, less expensive scale, diffusion is retarded. The availability of rentals of PCs with an option to buy increases rate of adoption.
5) Observability (or communicability) refers to the conspicuousness of' the innovation. New products that are highly visible in social situations are those that will be communicated most readily to other adopters. The fact that PCs lend themselves to demonstration and description helps them to diffuse faster in the social system.
6) Cost refers to the magnitude of the financial resources recjuired to obtain and operate this innovation. Innovations high in cost would be expected to diffuse more slowly. However, one study indicates that cost does not appear to be significantly correlated \Mth rate of adoption.
People who are more likely to adopt a newly introduced PC first, are people who are not cost-conscious (high level of income) and who have some previous experience \vith computers. They arc likely to believe in what computers are able to do for them, as well as fond of following innovations and trends in the high-lech market.
While adoption is and individual phenomenon, the diffusion of innovation refers to a group phenomenon, -indicating how an innovation spreads among consumers. Since the product life cycle of a PC is short, the marketers will desire to secure the largest amount of adoption with the shortest period of time, which means they will desire a quick diffusion of innovation.
In order to be able to compete efiectively in a dynamic and growing market such as the PC market, it is essential to understand the buyers' behavior. Also important is the decision making process that is used to decide what to buy and how to use it. The effort to focus on particular aspects of the PC purchasing process can be attributed to the need to isolate and determine :
-why the purchase choice was made - how the purchase is made
- who is involved in the purchase decision
C) WHY DO PEOPLE BUY PCs?
Why should someone buy a personal computer'.^ Because the personal computer (PC) fosters increased personal productivity. It forces users to organize themselves, yet offers a new & powerful outlet for productivity and creativity. The PC can be used to communicate with other information sources (Nold, 1985).
For some owmers, PC may be communicating personal attributes like prestige, being dynamic, innovative, ahead of time, modern .
It may also be correct to talk about fashion in the PC market. The appearance, size and capability of PCs var>' wdth models and time. Desktops, tower-cases, laptops, notebooks, and palmtops are nowadays available widely and it is hard to keep up with the fast pace of the market.
Most popular reasons for obtaining home-used PCs among American users, in the order of importance are (Narus & Guimaraes, 1986):
- word processing
- personal financial planning - tax preparation
- investment analysis for stocks, bonds and real estate - education for all family members
- home security
- communication with other databases
Most popular reasons for obtaining business used computer systems are ; - billing customers
- accounts receivable management - sales analysis
D) HOW DO PEOPLE BUY PCs ?
Many first time buyers are overwhelmed by the complexities and variables involved in purchasing a PC. More than 100,000 software packages and hundreds of hardware configurations are available. The PC market is fast paced. New products are released continually, making other products on the market obsolete. Prices have been volatile, and , as a result hardware and software companies enter and leave the market regularly.
For many people, a PC can be their third large.st purchase after their home and car. Many buyers develop "analysis-induced paralysis" : they determine their basic system but wait for the next upgrade or price cut, so the purchase is delayed. The net result is that the individual waits for an extended period of time and ends up not purchasing anything. (Nold, 1985)
A number of surveys have been \witten to guide the overwhelmed first time buyer on his decision.
One argument is ;
Before doing anything else, decide what the needs of your practice are. Identify the problems you hope to solve and then carefully examine all possible solutions. (Batson, 1983)
i.e.; - identify the needs - choose software
- find the hardware that meets the software A second approach i s :
Beginners do not know what software they may want two years from now and computers can be used for many purposes, not just one. (Raymond, 1984) The purchase should follow first hardware then software and vendor selections.
The advice given to first time personal computer buyers in this volatile market by Nold, is to avoid the wTong decision using the followng guidelines;
1) Plan for system growth : It is better to purchase a basic system and become acquainted wdth the PC before making any further purchases.
2) Never decrease flexibility ; Parts, software and repair should be readily available, if not the computer may quickly become obsolete.
3) Try' before you buy : Software and hardware operate differently when they are fully loaded; they should be tested beforehand.
4) Buy facts, not promises Make sure to secure the salesperson's promises in writing.
5) Plan to need assistance : An ongoing learning process is required, to take full advantage of innovations in the market.
As well as the literature on individual buyers, there has been a number of models centered about issues that influence industrial buyers as they undertake the decision of buying technically complex and costly industrial products. Articles on industrial buyers will be reviewed here since the questionnaire design and methodology in this survey are adaptations of these articles to individual buyers. The life cycle of high-tech products is typically short, meaning that often there is time to sell in depth to only a small portion of a potential adopter population, which makes the identification of appropriate prospects, particularly important. Frederick A. Johne (Johne,1984) has examined the buying behavior of fimis when adopting high technology, to identify variables by which potential buyers can be segmented.
Expertise and experience yield differences in the degree of importance of computer/supplier characteristics. (Kassicich & Rogers, 1986) This argument is supported with results of a survey designed by Kassicieh and Rogers, on industrial buyers of microcomputers (mid-range computers).
The same survey analyzed the importance of 17 attributes during the decision process. Factor analysis of 17 attributes has decreased this number to 5 of which "seiyice and sales support characteristics" were found to be the most important to the whole sample.
In a similar sun'ey that explored individual beha\'ioral variables and démographie variables of adopters and non-adopters of computers, computer experience and education stood out to be the main diflerences ot' demographic variables. (Peters & Venkatesan, 1973)
A survey on relative importance of supplier / product selection criteria, conducted by Abratt (Abratt, 1986) produced similar results :
"An important part of this research dealt w th the supplier / product selection criteria. Respondents were asked to rank nine attributes on the scale one to seven , in order of importance . The results indicate that, "the quaJity
o f technical sennce offered by the supplier" is one of the most important
considerations, followed by "product reliohility", "after sales support" etc.., that the prospective purchaser takes into account. Product price was ranked well down on the list." (Abratt, 1986)
Yet another suix^ey designed to test the attribute importance for industrial products shows "overall reputation o f the supplier" is the most important attribute, while financing terms is the second attribute.
When examining complex, expensive high technolog>' products, veiy little current information is available on psychological and intangible product attributes. Research on issues relating to buyer choice criteria and buying behavior has tended to focus on the buying groups and the eifects of risk in product purchasing. (Chakrebarti, f einman & Fuentevilla, 1982) Both Mayer (Mayer, 1983) and Kassicieh and Rogers (Kassicieh & Rogers, 1986) suggest that service and sales support, as well as communications efiectiveness and supply assurance are important characteristics in industrial marketing.
The cognitive criteria used to evaluate a product or product attributes may conform to the usual technical and physical (tangible) attributes used to describe complex technical products. However, non-tangible product characteristics may prove to be as important or even more important in terms of the decision makers' conscious and subconscious decision criteria. (Shaw, Giglierano & Kallis, 1979) The survey results report that vendor-related intangible attributes are more important than product performance attributes on industrial buyers. Second, the vendor attributes that are important are related to uncertainty over future product development and migration paths.
E) WHAT INFORMATION SOURCES DO BUYERS USE?
In their article about marketing approaches used by high-tech firms, sales and sales management activities are found to be the most important promotional activities followed by advertising in trade magazines and by participation in trade shows (Traynor&Traynor,1989). Other tools used include, technical seminars/presentations, sales promotional materials, direct mail advertising, packaging, newspaper and TV- radio advertising etc.
On the other side, the sources of information at two stages of buying process, the interest/awareness stage and evaluation/selection stages are investigated for purchasers of high technology.
The most important source of information is the sales representative, however exhibitions and trade shows play a ver>/ important role at the interest / awareness stage as well as the evaluation and selection stage. Other important sources of information include professional / technical conferences and word of mouth. (Abratt, 1986)
In Türkiye, the personal computer for the consumer is still at the introductory stage of the product life cycle. There are hundreds of brands and a wide variety of models for each brand available to the Turkish consumer. In a very short period of lime, many new brands enter and many others leave the market, yet there is no study on PC consumers in Türkiye that will guide the PC marketers in such a fast paced market.
This study, designed in the light of the above literature wdll attempt to provide PC marketers with both qualitative and quantitative data on PC purchase criteria of actual and potential PC owners.
The sample includes actual and potential buyers because the purchase criteria of a PC is not very clear to the consumer when he has bought or has an intention to buy a computer. This is also the reason for choosing the sample from frequent users of computers.
The study also compares two subgroups \\dthin the sample : experts and quasi experts. The groups are divided according to their expertise levels w th computers and searched for any differences, for all data. The two groups are compared in order to see any similarities and diff erences of purchase criteria and whether expertise level on PCs effect their criteria. This information is believed that may help with marketing mix, since the PC is a complex product.
Ill) PRESENT RESEARCH :
A) PURPOSE OF THE STUDY :
This research study is undertaken to ;
1) To explore the personal computer purchase criteria of university students who have bought or about to buy a PC. Also to gather some general purpose data about the sample (computer literacy, education level, income level, types of computer owned, purpose to buy a computer, information sources used before the purchase etc.) and look for any relations to emphasized attributes.
2) Test the hypothesis :
Hq ; Physical attributes (specifications) are more important than the additional service and benefits for experts (individual buyers), during the decision making process of personal computers; while the reverse is true for
quasi-experts. Decision criteria of for PC is divided into two sections : model
selection, brand/vendor selection.
Experts are defined to be the computer and electronics engineering
students and MBA students with engineering backgrounds; quasi experts defined to be the business administration and economics undergraduates, and non-expert MBA students. Both segments are frequent users of computers. Due to their departmental studies, computer and electronics engineering students have a lot of experience with various types of computers, so they are called experts. This assumption was proved by the computer literacy test results obtained from the questionnaire (Table 13a,b).
The physical attributes are defined as the computer specifications such as: the speed, microprocessor, fixed disk (hard disk) capacity, availability of a graphics card etc..
On the other hand, the additional service and benefits are provided by either the brand, vendor or the product itself such as : quality, image, brand name, service, guarantee, maintenance, promotions (ads, campaigns, software provided), distribution, novelty etc..
B) RESEARCH DESIGN AND METHODOLOGY:
i) Sample :
The sampling is done such that the respondents have either bought or are considering to buy a personal computer for his/her owm use. Respondents are university students from METU and Bilkent. Although the sample size was planned to be 150. only 64 surveys were conducted due to the difriculty in finding as many computer owners at the previously selected departments ol' two universities.
The university students were chosen from below departments : - Bilkent Electronics Engineering
- Bilkent Computer Engineering - Bilkent MBA
- Bilkent Business Administration - METU Computer Engineering - METU Business Administration - M E l’U Economics
- METU MBA
These departments are chosen in order to be able to include both experts and quasi experts in the survey, for comparison of objectives.
Sample size is 64 and the return rate of the survey is 100 %, since the surveys were administered face to faee.
Fifty-eight (58) % of the sample is from Bilkent and 42 % from METU
{Table 1 Demographic data of the sample). Students from difterent departments were selected as respondents ; 22 % of the sample is from computer engineering, 8 % electronics engineering, 3 % economics and 67 %
from MBA & BA departmenls. Rather than pre-determining the percentage inclusion of the above departments in this survey, as many computer owners as possible were included from these departments.
The age range is between 19 and 36 , mostly clustered around 22 to 25 years old students. The sample consists of 48 % experts and 52 % quasi experts.
Although the respondents were asked for their family's income level, the numbers are now obsolete, since the survey was conducted during the period Januaiy-May 1992. An adjustment of income levels with consumer price index was not used since the ratio of personal computer prices to income levels may have changed.
in Questionnaire Design and Application :
Through the use of focused group interview s with 10-12 students who are current users of PCs, the most important attributes in the buyers' preference structure are identified, for later use in the questionnaire. These interviews are also used to develop the hypothesis in the planning process of the marketing research.
In the light of these focus interviews, the first questionnaire is developed to obtain more detailed facts on types of infomiation sources and product / vendor criteria of buyers. {App. 1 : First Questionnaire)
This questionnaire consisted mainly of projective tests and depth interview' techniques. The respondents were asked to complete sentences like 'People
who buy IBM are seeking for...', 'People perceive the quality o f a computer as....'. The respondents were also shov/n pictures of difrerent situations and
asked to put themselves in the picture or imagine they are the person in the picture (Thematic Apperception Tests) and asked to tell a .story about what was going on. In an eftbrt to learn more about their opinions, respondents were asked to list both the most and the least important criteria if they were to select a PC. Respondents were also asked to select from a list of attributes that they think should be considered during the selection process. ' What is a
)W}i-compuier‘:^ ' is a question asked to get the respondents' idea of what a
computer is. (App. 2 : Some interesting answers to the first questionnaire) The above described survey was conducted on 12 people, in a relaxed environment, while sitting down and each lasted about 40 minutes.
The results of the first questionnaire were used to explore the PC buying process, buyers' thoughts and perceptions of different brands/vendors in the market and to design the present questionnaire (App. 3 : Questionnaire).
This questionnaire was intended to gather data of mainly four types : 1) General and demographical information
2) Usage of 8 information sources. Reliability of these information sources and how effective they were at respondents decision.
3) Importance of 23 criteria in the selection process of model and brand / \ endor of PCs
4) Computer literacy level of respondents and history / expertise with PCs Computer literacy level of a respondent is analyzed using the answ'ers to the questions on fifth part of the survey. Weights are assigned to the alternative choices of each question. If a respondent chooses the most w'eighted choice for each question, the total of all 5 answers adds up to 100.
Questions on infonnation sources in part II of the questionnaire are likert- type, 5-point scale and the respondents were asked to indicate how reliable/effective these sources were. Importance of attribute questions in part IV are likert-type, 7-point scale and the respondents were again asked to indicate how important these criteria had been during the decision process.
The questionnaire was pretested on 5-6 respondent by personal inter\iews and the necessary corrections were made to overcome any misinteipretations.
C) ANALYSIS AND RESULTS :
The data from first and second questionnaires are analyzed in this chapter, through qualitative and quantitative data analysis. The similarities and
differences between two groups wdthin the sample are highlighted together with the purchase criteria of the whole sample. In the last part of the analysis chapter, the purchase criteria are looked into, to have any correlation with each other.
it Qualitative Data Analysis:
The purpose of the first questionnaire was to analyze the psychological and emotional aspects of the PC purchase process. A summary of the findings are stated below :
IBM is perceived as the leader of the PC market. The firm is thought of as innovative with its products and provides the best service. Although the price of IBM PCs are high, they are believed to worth it. The sample mostly prefers IBM or IBM compatible products. The European brands are thought to be as good as IBM in quality with lower price while far Eastern products are perceived as cheap, poor in quality and service. Quality of a computer is usually linked with performance/durability as well as the service/suppoit facilities from the vendor. Therefore IBM name is linked with quality by a few respondents. Uncertainty of what to do in the market is reduced by following what IBM (the leader) does.
Majority of the sample believes that prices of new products are high and price campaigns are important on potential buyers. People wait for these discounts to buy new models or to exchange the old with new. I'herelbre cost factor slows down the rate of adoption of a newly introduced model. When the price concerns a majority of buyers, the rate of diffusion of innovation increases only at the later stages of the short PLC.
The diffusion of PCs is much faster among younger population. Younger people wath experience (nowadays PCs are used very commonly at schools) with PCs are thought to be the potential market for PCs while the older were
thought to be afraid of even touching the computers. So the complexity factor works against the marketers. This brings out the need for the promotion to stress wauanties and post-purchase service/education facilities.
Information sources are mostly friends, word of mouth, and the salesmen, although salesmen are not thought to be trustworthy all the time. The sample would ask for friends' advice or would go first to previousl}' known vendor while searching for the products at market.
The choice of the PC is usually in the favor of the most popular brand because it is thought to be the best in the market. On the other hand, most widely used brand may also be adopted to reduce cost and risk. The speed, memory and disk capacity, service and guarantee, price and durability are the common attributes mentioned during these interviews.
Complaints about PCs concentrate around malfunctioning of parts, low capacity , slow processor and obsolete and worthless PCs in the long run . Since high capacity and high speed ensure the satisfactory usage of newly available programs on the market, people tend to buy higher capacity than needed at the time of purchase. In light of these complaints, the system upgrade (extension), high capacity and high speed, as well as a good service/support from the vendor seem to be veiy^ desirable attributes.
The data collected with the first questionnaire infonns the marketer about the images of different brands on the market, the diffusion adoption process, how price and quality and price campaigns anticipated, as well as the usage of information sources and the most common complaints about PCs. Thé marketer should keep the above findings in mind and concentrate on improving the marketing mix of a specific new brand/model accordingly.
lit Comparisons of Experts Vs Quasi-Experts Using Descriptive Analysis and Hypothesis Testing:
In this section, the quantitatix e data from the questionnaire are analyzed. Comparison of two groups within the sample are made through descriptive analysis. The significant differences in each attribute are tested with Chi- square and T-tests as well as the hypothesis.
a) Usage of Information Sources:
The percentage of people who used the information sources is higher for quasi experts. The reason is; experts rely more on their own knowledge about computers and less on the technical advice from consultants, conferences, ads, etc. (Table 2). On the other hand, experts follow press releases more, since these releases will help with their profession.
From the point of reliability of these eight information sources, there are significant differences for two of the eight sources: "word o f nwulh" and
"your own knowledge" are significantly different between t\\ o groups at O.O.'i
p-level. Again, when the effectiveness of information sources is the concern,
"your own knowledge" is significantly different between two groups(Table 3).
Experts rate "your own knowledge" as the most reliable information source, but quasi experts rate "technical consultants" to be most reliable. Same motive is seen with the effectiveness of information sources (Table 4a, 4b). This result is expected since the level of knowledge on computers is much higher for experts.
The sample rated journal advertising to be the least reliable and least effective infomiation source. This may be because the sample consists of people at the later stages of adoption phase (computer owmers or potential buyers). At this phase personal selling is found to be more effective, so it is advisable for marketers to concentrate on personal selling for this type of consumer.
bt Model Selection:
If the decision to be made is the selection of a model for a PC, then the attributes to be considered should be mostly the specifications (i.e. tangible attributes). This is why the percentages of specifications are higher in Table 5, compared to the additional benefits. If we look at the time for decision of model or brand/vendor selection, almost 60 percent of the sample made the decision o f a model for PC first. Only 32.8 percent decided about the model and the vendor at the same time (Table 6). O f course, this tendency is more sharply seen for experts. Therefore experts first decide what the capacity, etc. of the PC will be and then look for any brand that provides these specifications.
Speed and type o f monitor (preferably colored \\dth high resolution) are
commonly thought that should be considered for model selection. All experts were also sharing the same idea on the consideration of hard disk capacity,
processor type, memoiy capacity and availability o f graphics card during
model selection. On the other hand, quasi experts were concemed about IBM
compatibility of the model (Table 5).
While experts rated jmocessor type, memoiy capacity and speed as the first three most important attributes, quasi experts decided on technical
senice/repair, IBM compatibility, and memoiy capacity. The motive for
more capacity and speed is obvious for experts.
.lust like the answers to the qualitative analysis, ability to upgrade the
system is a major concern for both groups because a PC worths thousands of
dollars today may be worthless and useless within 3-4 years. If the vendor provided the service to buy back the obsolete parts/models or were to update/replace the model, the customer would feel the relief of a long relationship with vendor and also the relief of a longer use of his PC.
Significant differences between two groups are for attributes: processor
type, vendor's reputation, well known/widely used brand, user friendliness, post purchase education/support. While processor type is more important for
experts, vendor's reputation, well known/widely used brand, user friendliness and post purchase education and support are more important to quasi experts (Table 7,8).
One point should be mentioned here : Among the attributes w th signilicanf differences "vendor's reputation" is hardly a factor in model selection. A little portion of experts and some quasi experts may have selected "not important" instead of "irrelevant" case at the fourth part of the questionnaire.
User friendliness and post purchase education/support are two factors
influenced by expertise level and are proved to be significantly different with Oneway analysis and T-tests. Quasi-experts are more concerned about the complexity and ease-of-use of the product.
As we have seen before, 50% quasi experts made the decision of model and brand/vendor at the same time. On the other hand, majority of experts made the decision of a model first, l^he significant difference in favor of quasi
experts (rated higher) for attributes "vendor's reputation" and "well known-
widely used brand" also supports the above mentioned decision process.
Hypothesis Testing For Model Selection :
Lets, now, examine the means of tangible and intangible attributes of two groups for model selection, using T-test analysis. The results are as follows:
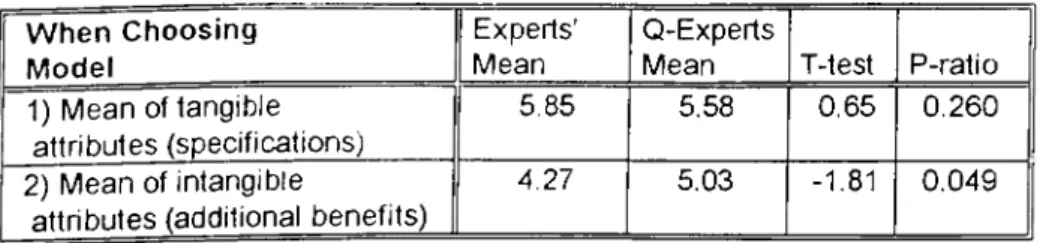
FIGURE 1. T-test analysis of means when choosing model.
W h e n C hoosing M o d el
Experts’ Mean
Q-Experts
Mean T-test P-ratio 1) Mean of tangible
attributes (specifications)
5.85 5.58 0.65 0.260
2) Mean of intangible
attributes (additional benefits)
4.27 5.03 -1.81 0.049
7'hc hypothesis tested by the above analysis can be stated as
1) Ms-E = Ms.QE
Ha '· Ms-E ^ Ms-QE
reject Hq if t > where a = 0.05 (One-tail)
where Mg.E is the weight (mean) of specifications (tangible attributes) given by I'ixperts and Ms.qe is the weight of specifications given by Quasj Experts, when choosing the model.
Figure I. shows th a t, p-value of the t-test for specifications is greater than 0 05 so we cannot reject Hq , which states that weights given to
specifications by experts and quasi experts, when choosing model, are equal.
2) Hq : Ma-e = Ma-qe
Hq : Ma-e ^ Ma-qe
where is the weight (mean) of additional benefits (intangible attributes) given by Experts and M^-qe is weight of additional benefits given by Quasi Experts.
As can be seen from Figure 1 the t-ratio for intangible attributes have a p- value of 0.049, which is smaller than 0.05. This means that we can reject Hq
and accept H(j which states that quasi experts weighs additional benefits more than experts do when choosing the model.
Although there has been proved to be significant differences in means of attributes, between the two groups for model selection, the aggregation of these attributes masked the differences. This aggregation is done for hypothesis testing purposes.
In summary, expertise levels about computers showed differences in factor importance profiles (Table 7) of the two groups and majority of specifications were rated to be more important for both groups during model selection. Since the specifications are more important and decision of specifications are mostly done prior to brand/vendor selection, marketers should concentrate on communicating specifications of models, especially to experts.
r.) BrandA/endor Selection:
The decision of a brand/vendor should normally be made with consideration of additional benefils/service provided by brand/vendor. This motive can be seen on Table 9 where the specifications (marked with *) are far down on the list. Some specifications like "IBM compatibility" for example, are factors that can be relevant both at the model selection and at brand/vendor selection.
just like the inferences of qualitative data analysis, quantitative analysis supports the brand selection criteria mentioned previously. Both Experts and Quasi-Experts rale PCs from different origins in the order IBM, European, Far East and Turkish brands (Table 12).
Technical sen'ice/repair, guarantee, price campaigns and vendor's reputation are the four most eommonly considered factors w thin the sample.
The decision of brand/vendor brings attributes technical senuce/repair,
vendor's reputation, guarantee, price/campaign, well known/widely used brand (in the order of importance) to the majority of experts' mind. On the
other hand, same decision involves the attributes technical senuce/repair,
post purchase education/support for quasi experts (Table 9). There are
significant differences for post purchase education and user friendliness between the two groups.
Again, the importance profile of the factors for brand/vendor selection, show similarities for both groups (Table 10). Guarantee and technical
sennee/repair are the first two on the list of importance of factors for the total
sample.
Most important attributes for experts are ; guarantee, cpjality, vendor's
reputation and technical senuce/repair (in the order of importance). This
order is : guarantee, technical sennee/repair, vendor's reputation and quality for quasi experts. Therefore the first four attributes are the same tor both groups with differences in order. However, all the four attributes are rated to be of higher importance for quasi experts.
Significant differences between two groups are seen with factors
'technical sennce/repaii\ 'ability to fin d SJV packages/parts', 'guarantee', 'vendor's reputation', 'user friendliness', 'post purchase education/support',
where all are rated to be more important by quasi experts (Table 11). These significant differences again underline the difference of knowledge on computers. All six factors concern quasi experts more since they have questions on mind such as "What happens when the PC does not work?", "What happens if the guarantee period is over and 1 cannot get any service/repair?", "What if the vendor does not provide new software and does not give any education?", "What if I cannot use the PC fully?".
Hypothesis Testing For Brand/Vendor Selection :
Statistical test results for the weights given by the sample when choosing brand/vendor is given below. Again, it should be kept in mind that aggregation of the attributes masks the ditf'erence of individual differences between two groups.
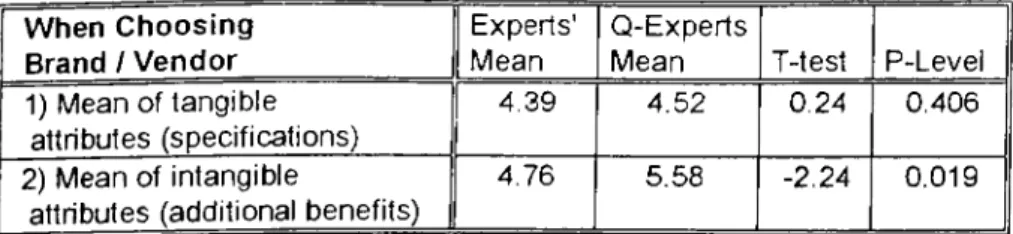
FIG URE 2. T-test Analysis of Means When Choosing Brand / Vendor.
W h en C h o o sin g Brand / V e n d o r
I Experts' 1 Mean
Q-Experts
Mean T-test P-Level 1) Mean of tangible
attributes (specifications) 1
4.52 0.24 0.406 2) Mean of intangible
attributes (additional benefits)
4.76 5.58 -2.24 0.019
The hypothesis tested by the above analysis is the same as before :
1) Ms-E = Ms_QE
H( , : Ms-E > Ms-QE
reject Hq if t > t„ where a = 0.05 (One-tailed)
where Ms-e weight (mean) ol' speciiications (tangible attributes) given by Experts and Ms-qe is the weight of specifications given by Quasi Experts, when choosing brand/vendor..
The p-lcvels of both oneway and t-tests are even greater than the ones in choosing model. So , we cannot reject Hq which states that weights given to
specifications by experts and quasi experts, when choosing hrand/vendor, arc equal.
2)
Hq .M
a-
e= M
a-
qeHa .
M
a-
e< M
a-
qewhere is the weight (mean) of additional benehts (intangible attributes) given by Experts and is the weight of additional benefits given by Quasi Experts.
This time the p-level of the statistical tests for analyzing the mean of intangible attributes is below 5 % which means that we can reject Hq and
accept Hq which says the weights given to additional benefits by quasi experts are greater than weights given by experts, when choosing the
hrand/vendor.
In summar>', additional benefits are more important at the brand/vendor selection for both groups. Therefore, marketers should concentrate on communicating the availability of guarantee and guarantee period, as well as serv'ice/repair provided, and quality of the products, to both groups. Post purchase education and software availability from vendor and user Iriendliness should also be communicated, especially to quasi experts.
H) Computer Literacy and Computer Usage:
Although the selection of experts and quasi experts in the sample are made according to the departments of students at universities or according to professions, the sample were also tested for computer literacy level at the fifth part of the questionnaire. A comparison of rates given by themselves with rates found by test scores shows experts over-rated their computer literacy level and quasi experts undervalued it. Mean of the computer literacy level of experts found from the 5th part of the suwey is 76.61 and the mean is 66.09 for quasi-experts (Table 13a, 13b).
According to the data from the 5th part of the questionnaire : experts bought a PC for home and academic study, while Quasi-Experts bought it for home study and speeding up mostly (Table 14). Forty-four percent of the sample (students) bought the PC for home study. This shows that the university students use PCs very frequently for course works and eager to buy one for usage, during the university education.
Experts use their PCs for word processing and programming, quasi-experts and total sample use it for word processing and games (Table 15a). The usage of computers is over 4 years for experts and 0-2 years for quasi experts (Table
15b).
Forty-eight percent of experts use PCs everyday and thirty-nine percent of quasi-experts use 4-5 times a week (Table 16a). Fifty-eight pereenl of the experts and fifty-one percent of quasi-experts use PCs over 10 hours per weekCfable 16b).
iii) Reduction of the variables and Factor Analysis:
While the respondents indicated a range of importance for 23 attributes at the fourth section of the questionnaire, it seemed unlikely that any one respondent would have considered all eriteria for evaluation of PCs.
Additionally, even if the criteria decision were representative of computer characteristics deemed important, it is unlikely that all 23 criteria were independent characteristics. All respondents could have a common set of dimensions on which to evaluate ever>' brand of PC, but they would evaluate the brands differently. This argued strongly for the use of factor analysis for the 23 criteria. The rotation of the resultant matrix was guided by the VARIMAX option, where rotation preserx^es orthogonality of the faetors and maximizes the differences in variance between factors.
The results of factor analysis are shown in Table 17a and Table 17b. The procedure used was to identify factors where each variable "loaded" the best (factor loading was the highest). The variables in factors were selected by rather "clean" (greater than 0.4 on only one factor) loadings on the rotated factor matrix. The number of factors were limited to 3 based on the eigen values and scree test, in both runnings for model and brand/vendor selection. The grouped variables were then supported to help "name" the factor (Table 17a, 17b).
Although the factor groupings do not consist of only specifications or additional benefits (except factor 3), majority of each group are observed to gather in one. The hypothesis testing were to be carried out w th the resultant grouped factors, but some specifications and additional benefits are observed
in one factor, (5 out of 6 cases), so hypothesis testing were carried out for all 23 attributes individually (see Model and Brand/Vendor Selection).
The attribute groupings \^dthin one factor, namely factor 1, consists of attributes provided by vendor even though disk drive type is also included but negatively correlated. On the other hand, Factor 3 and Factor 4 include only the speciikations (except the appearance, which may also be thought of a tangible attribute).
7'he analysis of six factors, with Oneway and T-tests, showed that only one out six factors, namely factor 5 has statistically different weights given by experts and quasi experts. Factor 5 consist mostly of additional benefits when choosing brand/vendor (Table 18a, 18b). Among the attributes in Factor 5,
technical sen'icc/repair, post purchase education/snpport, vendor's reputation, ahilit}· to fin d software packages were individually checked and
found significantly different for two groups (Table 11).
Although only factor 5 had a statistically different weight, the other five factors have some common points. Factors 3 (when choosing model) and lactor 4 (when choosing brand/vendor), which consist of specifications, have greater weights given by experts than weights given by quasi experts. This observation supports the hypothesis that specifications are more important for experts than for quasi experts when choosing model and brand/vendor.
IV) CONCLUSION :
The qualitative and quantitative analysis in this research, attempted to answer questions like 'Who buys a PC?, Hom> do people buy a PC?, Whal
information sources does he use?, Whal information sources does he find reliable/effective in his decision?. What are his purchase criteria?. How important are these criteria for mode! and brand/vendor selection?. How frequently and fo r what purposes is the PC used? How does computer literacy effect the decision process?.
Computer purchase requires careful planning and research due to the existing variety of brands / models, complexity of products and high cost. It presupposes a whole set of consumer learnings and values. I ’hese mentioned aspects of purchase as well as innovations (newly introduced models) that have not tried before increase the adopters' risk.
A consumer's decision to modify, postpone or avoid a purchase decision is heavily influenced by perceived risk about cost, attribute uncertainty, amount of consumer self-confidence. Risk, in return stops or slows down the adoption o f an innovation, in this case adoption of newly introduced models of PCs. PC marketers on the other hand can not wait around, but have to accelerate the rate of early adoption.
If the risk in adoption is high, consumer might avoid the decision, gather more information from reliable sources, buy from a friend, buy something tried before, ask for money back guarantee, buy the most expensive and elaborate model, prefer national brands, ask for warranty ,go for low cost or buy the most popular brand.
During the decision process, experts are likely to go for high capacity/good quality with less emphasis on brand image. The risk of adoption is less for this subgroup because they are confident about their knowledge on the product. Therefore when the computer literacy is high, importance of product performance is high and there is less need for sales and support service. However, this group is concerned about cost and they are not ready to pay too much for service, brand name and other intangible benefits. Majority of
experts chose the model first which also shows that brand/vendor selection is less important.
Quasi expert students in this sample are likely to gather more information from friends and other reliable infonnation sources perceived to be reliable before purchase. The risk due to complexity of product is higher for quasi experts with respect to experts.
The analysis showed that experts and quasi experts differ in usage ol' infomiation - especially on reliability and effectiveness of their own knowledge. Experts rely more on their knowledge for the purchase decisioir while the technical consultants are the most reliable information source for quasi experts.
Consumers apply different evaluation procedures to make a choice among multiattribute objects. The two groups in this study show' differences in their judgment process. The 23 attributes selected for the two phases of the decision process (model and brand/vendor selection) are not distincth different in each phase for quasi experts. This subgroup makes less distinction between the brand/vendor and model selection, but rather makes the two decisions together.
The attribute importance results found in this research aid marketers on which product / brand / vendor attributes to emphasize. A lack of w'arranty may be a dissatisfier but availability of the warranty may not satisfy the customer. On the other hand a color monitor may be a satisfying factor. The most important attributes found in this research are memoiy' capacity, IBM compatibility, speed, processor type for model selection and guarantee, technical sem'ce and vendor's reputation for brand/vendor selection. Therefore major salisfiers or motivations of purchase for the target market should be identified and supplied by the seller and dissatisfying factors should be avoided.
Experts rated majority of product specifications to be more important during model selection and quasi experts rated majority of additional benefits (especially the education and technical service provided by vendor) to be more important, during brand/vendor selection of a PC.
The results for the research also showed that young people who are ready to adopt innovations, who are also able to use complex high-tech products are keen to buy PCs. The price is a vei^ important factor for the young, where lease and buy-back method may help with the diffusion of innovation. I ’hey would like a high quality/liigh capacity with the newest technology, but cannot afford a brand new model with the desired specifications.
Post-purchase satisfaction is also an important factor of PC purchase. If there is a large gap between buyer's expectations and the products perceived performance, the customer is dissatisfied. The qualitative analysis shows that major post-purchase dissatisfaction areas are malfunctioning of parts and obsolescence of models in time. Therefore service and support facilities as well as a long term relationship with the vendor is ver>' important.
The sample used for this research consist of innovators and early adopters, because they are among the 1% who has purchased a PC in Turkey, in 1992 (520,000 among 50,000..()t)0 population). Marketers should first approach the innovative, early adopters because they rely on their own knowledge to assess new products, they can influence others easily, they are educated better, read scientific magazines more, have higher income level, and have high product categoiv' usage, and their main concern is the performance, not cost. Secondly, he should approach the heavy users whose expertise level is high and who are already using the older versions of the product.
The described target market of early adopters can be young university students from science and engineering departments, young firm directors and other frequent users of PCs at other departments as schools, high-tech lovers, people wlio feel smart, who has high career objectives, people who like sophistication and convenience.
In summary, this focused research on the buyers and potential buyers of PCs gives an insight to the total purchase cycle of PC, so PC marketers may want to use the findings here to re-examine their marketing mixes and approach their potential buyers accordingly. They have to keep in mind that, it is a fast paced industry and the life-cycle of every new PC is ver>^ short.
V) LIMITATIONS :
First of all, income level of the sample was not used for anah sis purposes since the questionnaire was conducted in the period Januar>-May 1992. Consumer price index for Ankara could have been used to update the income levels but, the ratio of PC prices to income levels might have changed.
'fhe sample chosen for the study consist of only students, horn one city (Ankaraj, from two selected universities (Bilkent, MF/fU). Ifom four departments (economics, business administration, electronics and computer engineenngj.
'fhe sample consist of innovators and early adopters who are the lirst to buy new models of PCs
Due to the rapid change in the PC market, criteria like disk drive type may have become an irrelevant variable to the decision process in the past two years.
The sample is only made up of potential buyers or actual buyers. This study docs not analyze non-adopters.
The sample size is 64. Factor analysis performed in order to decrease the number of 23 variables in the fourth section of questionnaire and later to analyze interrelationships between variables may have proved better results if the sample size were at least 100.
'fhe qualitative questionnaire referred to brand name IBM frequently and made comparisons of others with respect to this brand. This may have prevented respondents' thoughts on other brands like Compaq, Olivetti etc.. Also, if the sample consisted of respondents from artsy departments the name Apple may have come up more frequently.
VI) RECOMMENDATIONS FOR FURTHER
RESEARCH:
More students from a variety of universities, departments, cities could be included in the study.
A llirther study could provide more information if it also tested the individuals outside the universities.
The PC adopters for business purposes may also be included to provide a more through potential market research to the marketer.
Also recommended is the inclusion of non-adopters in order to understand their awareness level of the product, what it communicates to them as well as what it cannot and why they do not purchase the product.
“i A LlL '1 ;
DEMOGRAPHICAL DATA FOR THE SAMPLE
EXPERTISE LEVEL WITH COMPUTERS
le v e l fre q u e n c y p e rc e n ta g e Experts 31 48.4 Q u asi-experts 33 51.6 T O T A L 64 100.0 A G E R A N G E O F TlHE SA M PLE age fr^guency c u m . % 19 1 1.6 20 5 9.4 21 7 20.3 22 11 37.5 23 10 53.10 24 10 68.8 25 10 84.4 26 6 93.8 27 1 95.3 28 2 98.4 36 1 100.0 m ean = 25 SEX
sex frequency percentage
Male 46 71.88 Fem ale 18 28.13 T O T A L 64 100.00 UNIVERSITY u n iv e r s ! ^ fre q u e n c y p e rc e n ta g e B ilk e n t 37 57.81 O D T U 27 4 2 .1 9 T O T A L 64 1 0 0 .0 0 DEPARTMENT d e p a rtm e n t p ercen tag e c o m p u ter eng. 14 21.88 econom ics 2 3.13
electro n ics eng. 5 7.81 b u sin ess adm . 43 67.19
T O T A L 64 ^ 100.00 in c o m e fre q u e n c y p e r c e n ta g e 0 .0 -3 .5 m illions 8 12.50 3 .6 -7 .0 24 37.50 7 .0 -1 0 .5 14 21.90 1 0 .5 - 18 28.10 T O T A L 64 100.00