PROCEEDINGS OF SPIE
SPIEDigitalLibrary.org/conference-proceedings-of-spie
Plasmonic enhanced terahertz
time-domain spectroscopy system for
identification of common explosives
Yiğit Demirağ, Bayram Bütün, Ekmel Özbay
Yiğit Demirağ, Bayram Bütün, Ekmel Özbay, "Plasmonic enhanced terahertz
time-domain spectroscopy system for identification of common explosives,"
Proc. SPIE 10210, Next-Generation Spectroscopic Technologies X, 1021012
(5 May 2017); doi: 10.1117/12.2264953
Event: SPIE Commercial + Scientific Sensing and Imaging, 2017, Anaheim,
California, United States
Plasmonic enhanced terahertz time-domain spectroscopy system for
identification of common explosives
Yi˘git Demira˘g
a, Bayram B¨ut¨un
b, and Ekmel ¨
Ozbay
a,b,ca
Department of Electrical and Electronics Engineering, Bilkent University, Ankara, Turkey
bNanotechnology Research Center, Bilkent University, Ankara, Turkey
c
Department of Physics, Bilkent University, Ankara, Turkey
ABSTRACT
In this study, we present a classification algorithm for terahertz time-domain spectroscopy systems (THz-TDS) that can be trained to identify most commonly used explosives (C4, HMX, RDX, PETN, TNT, composition-B and blackpowder) and some non-explosive samples (lactose, sucrose, PABA). Our procedure can be used in any THz-TDS system that detects either transmission or reflection spectra at room conditions. After preprocessing the signal in low THz regime (0.1 − 3 THz), our algorithm takes advantages of a latent space transformation based on principle component analysis in order to classify explosives with low false alarm rate.
Keywords: Terahertz, spectroscopy, classification, algorithm, explosive
1. INTRODUCTION
Terahertz technology has advanced over last decades to be able to extensively study various kind of materials and examine the optical properties of many dielectrics.1,2 By exploiting their unique and distinct molecular vibration patterns in low terahertz regime, several exploits are previously foreseen as detectable and identifiable.3–5 On the other hand, despite advanced antenna technologies, acquired spectrum signatures are subject to experimental noise and ambient incoherence such as humidity, thermal fluctuations and sample conditions. Considering diversity and variance of each samples spectral signatures, it is unrealistic to study individual properties of acquired spectrum. Hence, it is required to classify signatures based on their common transmission and reflection characteristics.
This paper introduces a unsupervised classification algorithm that combines time and frequency domain preprocessing of raw signal, principle component analysis for latent space transformation and dimensionality reduction and Gaussian Mixture Model to make classification on the latent space.
Various explosive (C4, HMX, RDX, PETN, Composition B, TNT and blackpowder) and non-explosive (Lactose and Sucrose) samples are all trained and tested with the same procedure. Each material shown in Figure1has 3 samples of 3,5 and 10 mm thickness that are consisting of 5% wt PE.
likmasisaarhautotir
ct
ç .
i Computer LabVIEW+ MARAB Delay Stage .. I PCA DR.Figure 1. Each material has three samples with different thicknesses in order to study increscent absorption effect in spectral signature.
2. TERAHERTZ-TIME DOMAIN SPECTROSCOPY SYSTEM
2.1 System Description
Terahertz Time Domain Spectroscopy (THz-TDS) system uses a 780 nm wavelength, ultrafast, frequency-doubled fiber laser, that has sub-100 fs pulses with 80 MHz repetition rate and ≤ 140 mW average power. Output of laser is fed to emitter photoconductive antenna (PC Antennas) through a retro-reflector mounted on a 100 mm linear delay stage for scanning 2. PC antennas, which are used both in THz emitter (E1,2) and detector units (D1,2), are fabricated on low temperature grown GaAs (LT-GaAs) epitaxial layer on GaAs, which has ≤ 1 ps recombination lifetime. They have 20 m long dipoles and stripline geometry. Emitter antenna was biased at 0 V −25 V, with a modulation frequency of 27.73 KHz (which is supplied from lock-in amplifier as TTL signal) and a 10 mW incident average power is applied to both emitter and detector antennas during the experiments. Detector current output is amplified by a Lock-In Amplifier with a time constant of 30 ms and digitized using an ADC. THz region in the set-up consists of adjustable hyper-hemispherical high-resistive float-zone silicon lenses, which are mounted on the back of ∼400 m thick GaAs substrates and 4x2 off-axis parabolic mirrors. Total length of THz path is about 40 cm, and this region is filled with dry air. The terahertz time domain signals were taken for 100 ps with ∼33 fs steps then processed for analysis. The set-up also includes an auxiliary path for reflection measurement.
Reflection Transmission Delay ADC Delay Controller Laser
Figure 2. THz-TDS system reflection/transmission set-up diagram and THz path region in transmission mode is shown above.
Myatt n I Fre4ans(Tl2) F. aa.mrnoaáamn do. rrrçn.anuh,ya Mami a
...I
07520 14107 07507 1.9 79682.-040E017 8.8 867 18022 1.6021 1.1411.4 YabuyunFnl5m =MM3. COMMON EXPLOSIVE IDENTIFICATION ALGORITHM
3.1 Preprocessing
The raw data from detector usually includes an echo of the THz pulse due to possible internal reflections occurring in the sample. This secondary harmonic peak when occurred show similarity to main peak with a conspicuously lower amplitude. Although there have been several proposed filtering methods for echo removal,6 those methods are prone to mistakenly filter our sample information particularly when the absence of an echo. In order to confirm the existence of an echo, we first removed DC offset of the raw signal and then searched for an basic empirical model of main peak in the time domain signal to filter out if similarities are above a threshold. Second, we applied Fast Fourier Transform (FFT) and eliminated water absorption peaks due to typical humidity conditions.7 We concentrated on the set of frequencies that are published by HITRAN 2012 database.8 We also observed that these absorption peaks are well aligned with the absorption peaks observed in our THz-TDS system (Figure3).
Measurement Water Absorption Peaks
Frequency (THz) Save Calibrate Save Calibration Factor Calibration Values
LiteratureMeasurement Difference Frequency 1 Frequency 2 Frequency 3 Frequency 4 Figure Time Frequency FFT Resolution Refresh Marker Grid Measure Measurement Distance Long (200 ps) Frequency Calibration
Figure 3. MATLAB GUI compares humidity peaks that are observed by the system and HITRAN database records for matching corresponding absorption frequencies.
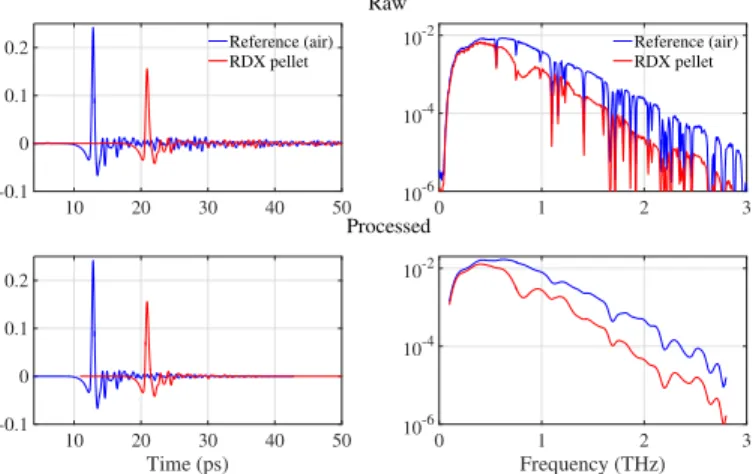
In order to eliminate present system and environment fluctuations, we applied noise-floor measurement and calculated absorption signal with Iabs = −2logIIin
ref. We applied a further asymptotic Blackman-Harris window to resolve the FFT
spectral components of system electronics. Finally, the dynamic range of signal is cropped between 0.2-3 THz (Figure4) where our detection SNR is at the highest.
10 20 30 40 50 -0.1 0 0.1 0.2 Reference (air) RDX pellet 10 20 30 40 50 Time (ps) -0.1 0 0.1 0.2 0 1 2 3 10-6 10-4 10-2 Raw Reference (air) RDX pellet 0 1 2 3 Frequency (THz) 10-6 10-4 10-2 Processed
4-3.2 Latent Space Construction
Each common explosives in our experiment has a different spectral signatures due to unique vibrational modes of their intramolecular bonds.2 Additionally, every spectral measurement of given sample varies due to experimental and environ-mental effects. Observations are correlated, yet different. Therefore instead of studying the high dimensional spectral data itself, it is convenient to use a latent model that captures lower dimensional ’essence’ of the data.
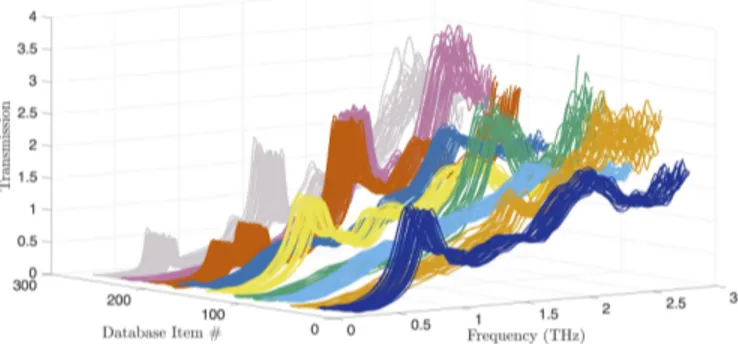
Principle component analysis (PCA) is one of the many latent linear models. It reduces the higher dimensional data to small number of degree of variability corresponding to latent factors. Hence, it emphasises variation and brings out strong patterns in a dataset. Our dataset is constructed such that each common explosives’ spectral signatures are represented with 30 preprocessed measurements (see Figure5).
Figure 5. This is a 3D representation of our training set. Training set includes 210 preprocessed spectral information of 7 different explosive compounds.
Principle component coefficients and scores are calculated via applying PCA. Each principle component captures some amount of variation in the database and they are shown in descending order of importance in Figure6. Those principle components have no physical meaning by their own but they are orthogonal set of uncorrelated linear base vectors of our latent space. Calculated scores can be inferred as a point coordinate in the latent space representing a single spectral measurement. Considering that PCA emphasizes the sources of variances in a given dataset, scores belong to one explosive are expected to position together in the latent PC space.
1 2 -20 0 20 PC #1 1 2 -20 0 20 PC #2 1 2 -20 0 20 PC #3 1 2 -20 0 20 PC #4 1 2 -20 0 20 PC #5 1 2 -20 0 20 PC #6 1 2 -20 0 20 PC #7 1 2 -20 0 20 PC #8 Frequency (THz)
Figure 6. 8 different principle components that are sorted according to variance in the signal captured are shown. The goal of principle component analysis is to explain the maximum amount of variance with the fewest number of principal components in order to reduce dimensionality. The optimum number of principle components can be selected by looking at explained variance of individual components. In our dataset, we used 5 principle components that explains 99, 1% of total variance in dataset (see Figure7).
V ar ia n ce E xpl ai ne d (%) Knee Point
Number of Principle Components
Figure 7. Variance explained by individual principle components. The knee point is the point where there is a significant drop in the explained variance.
To model latent variables (represented explosive signatures in PC space), we used a simple form of Gaussian Mixture Model (GMM), out of various unsupervised classification algorithms.9The advantage of GMM is that no initial parameters are needed. In this model, each labeled distribution in the mixture is a multivariate Gaussian with mean µkand covariance
matrix Σk. Thus the model is expressed as:
p(xi|θ) = K
X
k=1
πkN (xi|µk, Σk), (1)
where πk is a weight that associates with our confidence, determined by the number of training samples for each of K
explosives, satisfying 0 ≤ πk ≤ 1 andP K
k=1πk = 1. The maximum likelihood estimation of Gaussian mixture model,
p(xi|θ) = p(xi|µk, Σk) are calculated by expectation maximization (EM) algorithm. The classification of latent variables
in two-dimensional PC space can be seen in Figure8.
PC 1 P C 2 RDX B.Powder C4 PABA PETN HMX Lactose Sucrose TNT
Figure 8. Each dot represents one common explosive spectral data in the latent space. Here, we used two-dimensional PC space for better visualisation of separation of different explosives and fitted Gaussian distributions.
3.3 Identification
Each raw spectrum data is preprocessed and transferred into PC space as a point by xi=P L
k=1Zkek, where Zkrepresents
the preprocessed spectrum data and ek’s are previously calculated L principle components. After locating a spectrum data
in PC space, we computed p(zi = k|xi, θ), for zi ∈ {1, ..., K}, posterior probability of particular point i belonging to
cluster k using Bayes Rule as follows:
rik, p(zi= k|θ)p(xi|zi= k, θ) K P k0=1 p(zi= k0|θ)p(xi|zi= k0, θ) , (2)
p(Dm(xi) ≤ 2) = p(
q
(xi− µk)TΣ−1k (xi− µk) ≤ 2). (3)
4. RESULTS
We presented an unsupervised algorithm for classification and identification of common explosives that can be used with any THz-TDS system that detects either absorption or reflection of chemical compounds. Our algorithm is designed over the fact that measured spectrum data of a single explosive are correlated because they arise from hidden unique vibrational modes of their intramolecular bond. By applying PCA as a linear latent model after preprocessing the raw spectral data, we successfully demonstrated that different explosives are separated in high-dimensional latent space. It is observed that using 5 principle components that captures 99.1% of explained variance, maximizes the seperation between Gaussian distributions which can be verified with measuring KL divergences. Our extensive experiments on 7 common explosives and 2 non-explosive samples with different thicknesses, confirmed method’s validity and usefulness. Furthermore, the proposed trainable algorithm is a generic method that can be applied to any spectral data and we anticipate future research on more diverse task such as drug identification.
ACKNOWLEDGEMENTS
This work is supported by the projects DPT-HAMIT, NATO-SET-193 and TUBITAK under Project 114E374. One of the authors (E.O.) also acknowledges partial support from the Turkish Academy of Sciences.
REFERENCES
[1] Davies, A. G., Burnett, A. D., Fan, W., Linfield, E. H., and Cunningham, J. E., “Terahertz spectroscopy of explosives and drugs,” Materials Today 11(3), 18–26 (2008).
[2] Burnett, A., Fan, W., Upadhya, P., Cunningham, J., Linfield, E., Davies, G., Edwards, H., Munshi, T., and Neil, A. O., “Analysis of drugs of abuse and explosives using terahertz time- domain and Raman spectroscopy,” 6120, 1–7 (2005). [3] Chen, J., Chen, Y., Zhao, H., Bastiaans, G. J., and Zhang, X., “Absorption coefficients of selected explosives and
related compounds in the range of 0 . 1-2 . 8 THz,” 15(19), 12060–12067 (2007).
[4] Liu, H.-b., Chen, Y., and Bastiaans, G. J., “Detection and identification of explosive RDX by THz diffuse reflection spectroscopy,” 14(1), 415–423 (2006).
[5] Stephani, H., Herrmann, M., Wiesauer, K., Katletz, S., and Heise, B., “Enhancing the Interpretability of Terahertz Data Through Unsupervised Classification,” XIX IMEKO World Congress Fundamental XIX IMEKO World Congress Fundamental, 2329–2334 (2009).
[6] Stephani, H., Jonuscheit, J., Robin´e, C., and Heise, B., “Automatically detecting peaks in Terahertz time-domain spectroscopy,” Proceedings - International Conference on Pattern Recognition , 4468–4471 (2010).
[7] Slocum, D. M., Goyette, T. M., Slingerland, E. J., Giles, R. H., and Nixon, W. E., “Terahertz atmospheric attenuation and continuum effects,” Proc SPIE 8716, 871607 (2013).
[8] Rothman, L. S., Gordon, I. E., Babikov, Y., Barbe, A., Chris Benner, D., Bernath, P. F., Birk, M., Bizzocchi, L., Boudon, V., Brown, L. R., Campargue, A., Chance, K., Cohen, E. A., Coudert, L. H., Devi, V. M., Drouin, B. J., Fayt, A., Flaud, J. M., Gamache, R. R., Harrison, J. J., Hartmann, J. M., Hill, C., Hodges, J. T., Jacquemart, D., Jolly, A., Lamouroux, J., Le Roy, R. J., Li, G., Long, D. A., Lyulin, O. M., Mackie, C. J., Massie, S. T., Mikhailenko, S., M??ller, H. S. P., Naumenko, O. V., Nikitin, A. V., Orphal, J., Perevalov, V., Perrin, A., Polovtseva, E. R., Richard, C., Smith, M. A. H., Starikova, E., Sung, K., Tashkun, S., Tennyson, J., Toon, G. C., Tyuterev, V. G., and Wagner, G., “The HITRAN2012 molecular spectroscopic database,” Journal of Quantitative Spectroscopy and Radiative Transfer 130, 4–50 (2013).
[9] Murphy, K., [Machine Learning: A Probabilistic Perspective ], Adaptive computation and machine learning, MIT Press (2012).