alutary effects of hormone replacement therapy (HRT) on lipids and li-poproteins are well-examined in scholarly literature. There are sound theoretical reasons as well as numerous empirical reasons supporting these effects. Evolutionarily, a decline in favorable lipid and lipoprotein pro-files as a function of menopause can be interpreted as part of the coupling of reproductive and somatic senescence. As Croft et al. have argued, the phenomenon of prolonged post-reproductive lifespan (PRLSs) is relatively rare, primarily occurring in humans and certain insects and cetaceans.1 Se-veral possible reasons for prolonged PRLSs in human females have been proposed, including the role played by grandmothers when caring for their offspring and by contemporary advances in medicine.2-4
Regardless of the reasons for prolonged PRLSs in human females, rep-roductive senescence occurs after a steady decline in fertility and is also as-sociated with declines in many markers of health, including bone health.5-8 Yun and Lee have described declining health post menopause, with refe-rence to the phrase “diseases of post-reproductive senescence”.9Available biological evidence and the logic of evolutionary biology suggest that post-menopausal women are less protected from disease.10
Effect of HRT on Serum Lipid, Apolipoprotein AI,
Apolipoprotein B, and Lipoprotein (a) in
Postmenopausal Women: Added Benefits of
Dietary and Exercise Improvement
AABBSS TTRRAACCTT OObbjjeeccttiivvee:: In this quasi-experimental study, we aimed to measure the effect of hormone replacement therapy (HRT) on serum lipid, apolipoprotein AI, apolipoprotein B, and lipoprotein (a). The study had three objectives: to replicate previous studies’ findings on the effect of HRT on lipid and lipoprotein profiles; to integrate possible effects of dietary and exercise improvements (con-sidered as independent predictors), covariates, and interaction variables; and to report effect sizes capable of estimating the impact of HRT on each outcome variable of the study. MMaatteerriiaall aanndd M Meetthh--ooddss:: The effect of HRT on serum lipid, apolipoprotein AI, apolipoprotein B, and lipoprotein (a) was determined in a case group of 86 postmenopausal women compared with that in a control group of 97 age-matched women who were not receiving HRT and who were not menopausal. RReessuullttss:: HRT had the expected salutary effect on all measured variables, except for apolipoprotein AI. The largest effect size was observed for high-density lipoprotein cholesterol, suggesting the need for replica-tion and if necessary, further investigareplica-tion of why HRT might be particularly beneficial for high-density lipoprotein cholesterol levels of postmenopausal women. CCoonncclluussiioonn:: Finally, the study found neither an independent nor interactive effect of diet or exercise on the effect of HRT. KKeeyywwoorrddss:: Hormone replacement therapy; postmenopausal; lipids; lipoprotein; apolipoprotein Pelin ERGENEKONa
aClinic of Obstetric and Gynecology,
Medipol University Sefaköy Hospital, İstanbul, TURKEY
Re ce i ved: 02.05.2018
Received in revised form: 24.10.2018 Ac cep ted: 25.10.2018
Available online: 15.01.2019 Cor res pon den ce: Pelin ERGENEKON
Medipol University Sefaköy Hospital, Clinic of Obstetric and Gynecology, İstanbul, TURKEY
Cop yright © 2018 by Tür ki ye Kli nik le ri
DOI: 10.5336/jcog.2018-61286
In women, a decline in estrogen represents an increasing vulnerability to diseases, such as cardio-vascular disease and osteoporosis.11-13 In fertile women, estrogen provides protection against car-diovascular disease as well as other diseases;the exis-tence of such a protective hormonal effect is not unique to humans and indicates how evolutionary forces would select for traits, feedback mechanisms, and structures that would enhance the chances of the young to live long enough to reproduce.1,14-16
The availability and increasing use of HRT af-fords women renewed protection against cardio-vascular and other forms of disease.17In particular, HRT in postmenopausal women is associated with improvements in lipid and lipoprotein profiles.18 Despite the extensive scholarly work on the use-fulness of HRT with respect to lipid and lipopro-tein profiles, there remain important gaps in the literature. One such gap is the failure of previous researchers to calculate and report effect sizes, in-cluding classic measures such as Cohen’s d and Hedges’ g.19-21Effect sizes are particularly useful in clinical settings because they convey information that is not conveyed by a pvalue, that is, the prac-tical impact of an intervention.21Another gap in the literature is the absence of measurements of the lipid- and lipoprotein-protective effects, if any, of improved diet and exercise. In the context of anti-aging medicine, in particular, and also in the con-text of general medicine, physicians who admi nister HRT should make lifestyle recommendati-ons for patients; such physicians would be particu-larly interested in a quantification of the added lipid- and lipoprotein-protective effects, if any, of improved diet and exercise.22Finally, physicians and researchers would benefit from reported effect sizes, for the added components of improved diet and exercise as well as for any changes in lipid and li-poprotein profiles. One point of lingering theoretical interest, for example, is why HRT might improve certain lipid or lipoprotein profiles to a greater ex-tent than others. Such an effect, if it exists, can be identified through effect size estimations as well as through comparisons of the 95% confidence inter-vals of tstatistics and related measures.
Bayrak et al. measured the effect of HRT on lipid and lipoprotein profiles of 60 women who were divided into groups that received estrogen only and estrogen plus progesterone replacement. They found that both forms of HRT were asso-ciated with lipid and lipoprotein profile impro-vements. However, Bayrak et al. did not include a control group, measures of effect size, and co-variates that could have helped to explain (for example, through moderation) the effects of both forms of HRT.23
Kim et al. found evidence on the effectiveness of HRT for reducing lipoprotein (a) and lipids in post-menopausal women.24In addition, Kim et al. found that HRT was associated with improvements in triglyceride, low-density lipoprotein cholesterol, high-density lipoprotein cholesterol, and total cho-lesterol profiles. They were interested in different treatment conditions, including (a) the addition of medroxyprogesterone acetate and (b) possible effects of hysterectomy. To assess the effects of these cova-riates, Kim et al. divided the case group into three groups. By doing so, however, Kim et al. lost poten-tial statistical power as there was no need to place women with a hysterectomy into a separate case group; instead, the hysterectomy status could have been treated as a covariate and subsequently turned into an independent predictor [in ANOVA or analy-sis of covariance (ANCOVA)] or an interaction vari-able (such as hyste rectomy * MPA) using an ANCOVA approach. Beca use of Kim et al.’s use of a repeated-measures t-test approach, they were not able to accommodate covariates in their model, re-sulting in the creation of an unnecessary case group and a corresponding loss of statistical power. The in-clusion of appropriate covariates in an ANCOVA can address this kind of gap in the previous literature on the effects of HRT on the lipid and lipoprotein pro-files of postmenopausal women.
This study has been structured as follows. First, a review of literature surveys and discussion on re-cent or notable findings on the effect of HRT on li-pids and lipoproteins among postmenopausal women was done. Second, the methods of the study have been described. Third, the results have
been presented. Finally, the results have been dis-cussed with reference to past findings, implicati-ons, and directions for future research.
MATERIAL AND METHODS
PROCEDURE
This was quasi-experimental study. Eighty-six women who had undergone HRT treatment vo-lunteered to participate in data collection for this study. Of these women, 23 had had hysterecto-mies and the remaining 63 had intact uteruses. Each of these 86 women, who constituted the case group, received continuous 0.625 mg conju-gated equine estrogen (CEE). Before each wo-man’s first CEE treatment, her body mass index (BMI); VO2max; uterine status; and total choles-terol, triglyceride, low-density lipoprotein cho-lesterol, high-density lipoprotein chocho-lesterol, apolipoprotein AI, apolipoprotein B, and lipop-rotein (a) were measured. Each participant in the study underwent re-measurement of each of these variables at 6, 12, and 18 months after ba-seline. Each participant was, at baseline, offered a detailed brochure with exercise and diet recom-mendations; however, no active dietary or exer-cise intervention was staged. BMI and VO2 max were treated as proxy variables for dietary im-provement and exercise imim-provements, respecti-vely, based on the hypothesis that impro-vements in BMI would reveal dietary
improve-ments, whereas improvements in VO2would
re-veal exercise improvements
The control group included 97 age-matched women who were not postmenopausal. These women were patients who agreed to have their BMI; VO2 max; uterine status; and total choles-terol, triglyceride, low-density lipoprotein cho-lesterol, high-density lipoprotein chocho-lesterol, apolipo- protein AI, apolipoprotein B, and lipop-rotein (a) collected at baseline, 6 months, 12 months, and 18 months. Originally, 108 women were sampled for the control group; 11 became menopausal by the 18-month data collection pe-riod. Therefore, the final number of control group members was 97.
VARIABLES AND CODING
Variables of the study, accompanied by their names for statistical analysis using Stata software, were as follows:
Menopausal status (meno): Dichotomous no-minal variable, with 0=not menopausal and 1=post-menopausal. No peri-menopausal women were included in the study.
Uterine status (hyst): Dichotomous nominal variable, with 0=uterus intact and 1=uterus removed. Body mass index (BMI): Interval variable, measured to two significant figures.
Dietary improvement (diet): Measured as % decline in BMI from baseline. This variable was polytomous, with the following possible values: 1 = BMI increased by ≥5% vs. baseline, 2=BMI increa-sed by up to 5% vs. baseline, 3=BMI decreaincrea-sed by up to 5%, and 4 = BMI decreased by >5%. These va-lues were not intended to be ordinal; they only existed as category separators during data analysis. Exercise improvement (VO2): Measured as % increase in VO2 max measured from baseline to the points of data collection. This variable was polytomous, with the following possible values: 1=VO2 max increased by ≥5% vs. baseline, 2 = VO2 max increased by up to 5% vs. baseline, 3 = VO2 max decreased by up to 5%, and 4 = VO2 max dec-reased by >5%. These values were not intended to be ordinal; they only existed as category separators during data analysis.
Total cholesterol (Cho): Measured as % change in total cholesterol (mg/dl), from baseline to the points of data collection.
Triglyceride (Trig): Measured as % change in triglycerides (mg/dl), from baseline to the points of data collection.
Low-density lipoprotein cholesterol (LDL-c): Measured as % change in low-density lipopro-tein cholesterol (mg/dl) from baseline to the points of data collection.
High-density lipoprotein cholesterol (HDL-c): Measured as % change in high-density lipopro-tein cholesterol (mg/dl), from baseline to the points of data collection.
Apolipoprotein AI (Apoai): Measured as % change in apolipoprotein AI (mg/dl), from baseline to the points of data collection.
Apolipoprotein B (Apob): Measured as % change in apolipoprotein B (mg/dl), from baseline to the points of data collection.
Lipoprotein (a) (Lipoa): Measured as % change in lipoprotein (a) (mg/dl), from baseline to the points of data collection.
DATA ANALYSES
ANCOVA was adopted as the base model for the study. There were seven ANCOVAs, with separate ANCOVAs conducted for each of the seven depen-dent variables-representing changes in total cho-lesterol, triglycerides, low-density lipoprotein cholesterol, high-density lipoprotein cholesterol, apolipoprotein AI, apolipoprotein B, and lipopro-tein (a). For better calculation of separate effect sizes of the relationship between HRT and each of these outcomes, a multiple analysis of covariance (MANCOVA) was rejected; the use of seven AN-COVA introduced a possible problem of Alpha in-flation into the study. Effect sizes were calculated separately from ANCOVAs on the basis of descrip-tive statistics of mean, standard deviation, and nfor each comparison group. All statistical analyses for the study were performed using Stata/SE 14.2 soft-ware. The level of statistical significance was 0.10.
RESULTS
The findings of the study have been divided into eight sections. The first section contains a single set
of comparisons with accompanying descriptive sta-tistics. The subsequent seven sections examined the impact of HRT administration-considered along-side the effects of dietary and exercise improve-ment-on changes in total cholesterol, triglycerides, low-density lipoprotein cholesterol, high-density lipoprotein cholesterol, apolipoprotein AI, apoli-poprotein B, and liapoli-poprotein (a).
DESCRIPTIVE STATISTICS
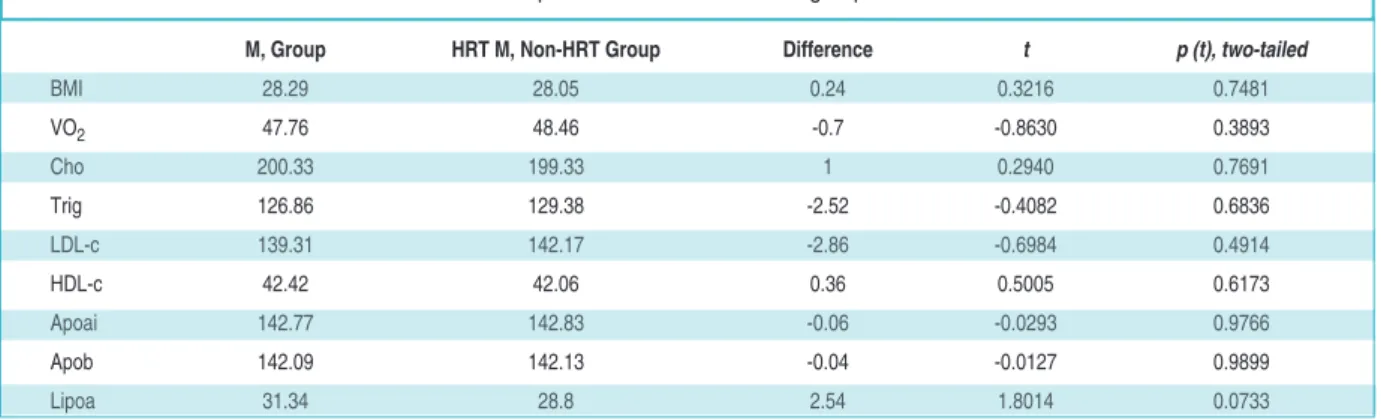
To determine the similarity between the HRT and non-HRT groups at baseline (that is, at month 0), independent samples t-tests were performed. Re-sults of these t-tests have been presented in Table 1.
At a two-tailed α of 0.05, the HRT and non-HRT groups were, at the baseline, statistically com-parable with respect to BMI, VO2 max, total cholesterol, triglycerides, low-density lipoprotein cholesterol, high-density lipoprotein cholesterol, apolipoprotein AI, apolipoprotein B, and lipopro-tein (a). Therefore, subsequent disparities in these measurements can be more validly ascribed to HRT than to pre-existing differences.
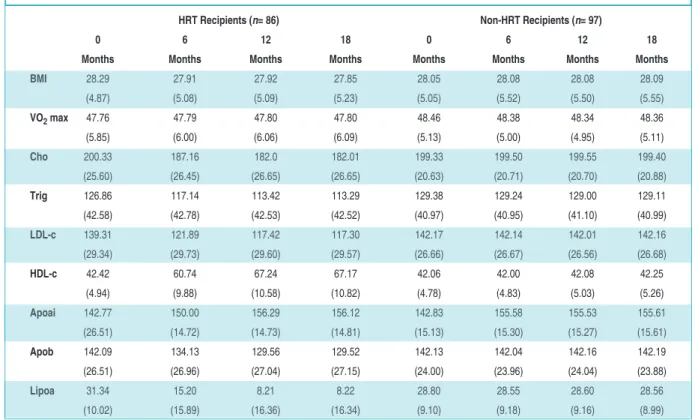
Table 2 below includes a comparison of group outcomes, with means reported and standard de-viations in parentheses.
COMPARATIVE FINDINGS t
t--TTeessttss aanndd AANNCCOOVVAAss.. Findings have been se-parately presented for total cholesterol, triglyceri-des, low-density lipoprotein cholesterol, high-density lipoprotein cholesterol, apolipopro-tein AI, apolipoproapolipopro-tein B, lipoproapolipopro-tein (a).
M, Group HRT M, Non-HRT Group Difference t p (t), two-tailed
BMI 28.29 28.05 0.24 0.3216 0.7481 VO2 47.76 48.46 -0.7 -0.8630 0.3893 Cho 200.33 199.33 1 0.2940 0.7691 Trig 126.86 129.38 -2.52 -0.4082 0.6836 LDL-c 139.31 142.17 -2.86 -0.6984 0.4914 HDL-c 42.42 42.06 0.36 0.5005 0.6173 Apoai 142.77 142.83 -0.06 -0.0293 0.9766 Apob 142.09 142.13 -0.04 -0.0127 0.9899 Lipoa 31.34 28.8 2.54 1.8014 0.0733
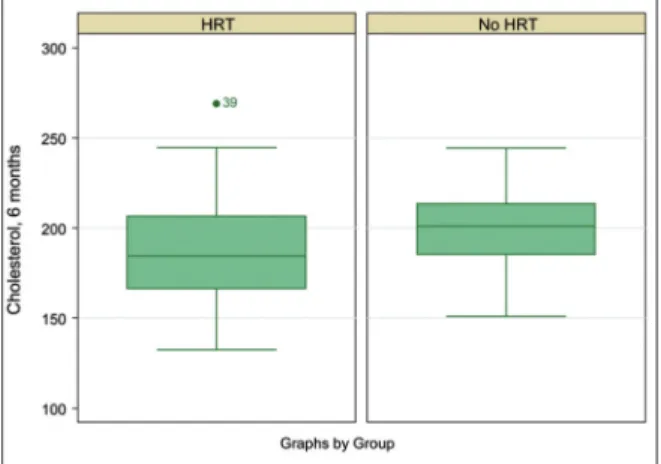
TToottaall cchhoolleesstteerrooll ffiinnddiinnggss. Total cholesterol of HRT recipients significantly decreased from the ba-seline to 6 months [−13.17 (SE = 3.96), t(170) = −3.3189; p=0.0006]. However, there were no furt-her significant reductions in total cholesterol of HRT recipients; therefore, the only comparison for total cholesterol between the HRT and non-HRT groups was at 6 months. At 6 months, the mean total cholesterol of the HRT group (M = 187.16,
SD=26.45) was significantly lower than that of the non-HRT group [(M=199.50, SD= 20.71), t(181) = −3.3538;p = 0.0003]. The effect of HRT treatment on cholesterol reduction remained significant [F(1) = 12.02; p=0.0007] when the dichotomous variables of major BMI loss [F(1)=0.06; p=0.8028] and major VO2 increase [F(1)=0.75; p=0.3862] were added. Another interpretation of ANCOVA was that when HRT treatment was taken into account, there were no beneficial effects of BMI loss (as a proxy measure of healthier diet) and VO2max gain (as a proxy measure of exercise improvement) on total cholesterol reduction (Figure 1).
TTrriiggllyycceerriiddeess ffiinnddiinnggss. Triglycerides of HRT recipients significantly decreased from the baseline to 6 months [-9.72 (SE= 6.51), t(170)=−1.4933; p= 0.0686]. However, there were no further signifi-cant reductions in triglyceride of HRT recipients; therefore, the only comparison for triglyceride bet-ween the HRT and non-HRT groups was at 6 months. At 6 months, the mean triglyceride of the HRT group (M=117.14, SD=42.78) was significantly lower than that of the non-HRT group [(M = 129.24, SD=40.95); t(181)=−1.9542; p=0.0261]. The effect of HRT treatment on triglyceride reduction remained significant [F(1)=3.86; p=0.0510] when the dichotomous variables of major BMI loss [F(1)=1.43; p=0.2326] and major VO2increase [F(1) = 0.36; p=0.5469] were added. Another interpreta-tion of ANCOVA was that, when HRT treatment was taken into account, there were no beneficial effects of BMI loss and VO2max gain on triglyce-ride reduction (Figure 2).
LLooww--ddeennssiittyy lliippoopprrootteeiinn cchhoolleesstteerrooll ffiinnddiinnggss. Low-density lipoprotein cholesterol of HRT
reci-HRT Recipients (n= 86) Non-HRT Recipients (n= 97)
0 6 12 18 0 6 12 18
Months Months Months Months Months Months Months Months
BMI 28.29 27.91 27.92 27.85 28.05 28.08 28.08 28.09 (4.87) (5.08) (5.09) (5.23) (5.05) (5.52) (5.50) (5.55) VO2max 47.76 47.79 47.80 47.80 48.46 48.38 48.34 48.36 (5.85) (6.00) (6.06) (6.09) (5.13) (5.00) (4.95) (5.11) Cho 200.33 187.16 182.0 182.01 199.33 199.50 199.55 199.40 (25.60) (26.45) (26.65) (26.65) (20.63) (20.71) (20.70) (20.88) Trig 126.86 117.14 113.42 113.29 129.38 129.24 129.00 129.11 (42.58) (42.78) (42.53) (42.52) (40.97) (40.95) (41.10) (40.99) LDL-c 139.31 121.89 117.42 117.30 142.17 142.14 142.01 142.16 (29.34) (29.73) (29.60) (29.57) (26.66) (26.67) (26.56) (26.68) HDL-c 42.42 60.74 67.24 67.17 42.06 42.00 42.08 42.25 (4.94) (9.88) (10.58) (10.82) (4.78) (4.83) (5.03) (5.26) Apoai 142.77 150.00 156.29 156.12 142.83 155.58 155.53 155.61 (26.51) (14.72) (14.73) (14.81) (15.13) (15.30) (15.27) (15.61) Apob 142.09 134.13 129.56 129.52 142.13 142.04 142.16 142.19 (26.51) (26.96) (27.04) (27.15) (24.00) (23.96) (24.04) (23.88) Lipoa 31.34 15.20 8.21 8.22 28.80 28.55 28.60 28.56 (10.02) (15.89) (16.36) (16.34) (9.10) (9.18) (9.16) (8.99)
TABLE 2: Means and standard deviations of outcomes by group.
Key: Total cholesterol (cho); Triglycerides (trig); Low-density lipoprotein cholesterol (ldl-c); High-density lipoprotein cholesterol (hdl-c); Apolipoprotein AI (apoai); Apolipoprotein B
pients significantly decreased from the baseline to 6 months [−17.42 (SE=4.50), t(170)=−3.8685; p = 0.0001]. However, there were no further signifi-cant reductions in low-density lipoprotein choles-terol of HRT recipients; therefore, the only comparison for low-density lipoprotein choleste-rol between the HRT and non-HRT groups was at 6 months. At 6 months, the mean low-density li-poprotein cholesterol of the HRT group (M = 121.89, SD=29.73) was significantly lower than that of the non-HRT group [(M=142.14, SD=26.67);
t(181)=−4.8564;p < 0.0001]. The effect of HRT tatment on low-density lipoprotein cholesterol re-duction was no longer significant [F(1)=0.50; p= 0.4794] when the dichotomous variables of major BMI loss [F(1)=0.05; p =0.8199] and major VO2 in-crease [F(1)=0.12; p=0.7248] were added. One pos-sible interpretation of this ANOVA is that missing
instrumental variables might be responsible for the loss of HRT’s significance when major BMI loss and major VO2increase were taken into account (Fi-gure 3).
H
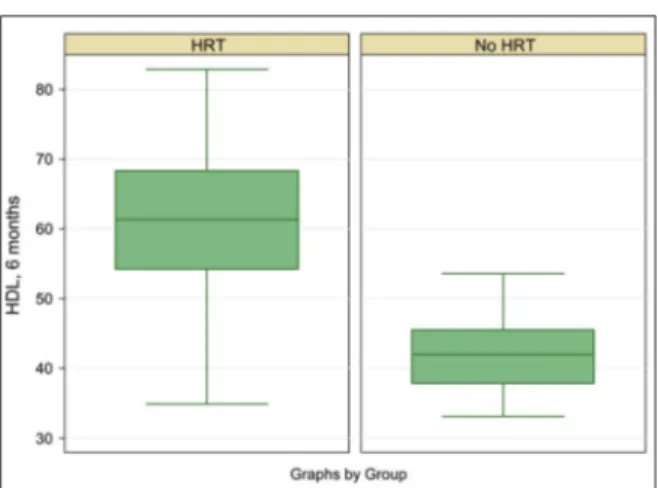
Hiigghh--ddeennssiittyy lliippoopprrootteeiinn cchhoolleesstteerrooll ffiinnddiinnggss. High-density lipoprotein cholesterol of HRT reci-pients significantly increased from the baseline to 6 months [18.29 (SE=1.19), t(170)=15.3601; p< 0.0001]. However, there were no further signifi-cant increases in high-density lipoprotein choles-terol of HRT recipients; therefore, the only comparison for high-density lipoprotein choleste-rol between the HRT and non-HRT groups was at 6 months. At 6 months, the mean high-density li-poprotein cholesterol of the HRT group (M=60.74,
SD=9.88) was significantly higher than that of the non-HRT group [(M=42.08, SD=5.03); t(181)= 16.5480;p<0.0001]. The effect of HRT treatment on high-density lipoprotein cholesterol reduction remained significant [F(1)=273.97; p<0.0001] when the dichotomous variables of major BMI loss [F(1)=1.81; p =0.1806] and major VO2 increase [F(1)=0.12; p 0.7332] were added. Another interp-retation of ANCOVA was that, when HRT treat-ment was taken into account, there were no beneficial effects of BMI loss and VO2max gain on high-density lipoprotein cholesterol increase (Fi-gure 4).
AAppoolliippoopprrootteeiinn AAII ffiinnddiinnggss. Apolipoprotein AI of HRT recipients significantly increased from the baseline to 6 months [7.22 (SE=2.18), t(170) =
FIGURE 1:Box plot of cholesterol at 6 months after HRT of the case and control groups.
FIGURE 2:Box plot of triglycerides at 6 months after HRT for the case and con-trol groups.
FIGURE 3:Box plot of low-density lipoprotein cholesterol at 6 months after HRT for the case and control groups.
−3.3144; p=0.0011]. At 6 months, the mean apoli-poprotein AI for the HRT group (M=150.00, SD= 14.72) was significantly lower than that for the non-HRT group [(M=155.59, SD=15.31); t(181) = −2.5141; p=.0064]. By 12 months, however, there was no significant difference in apolipoprotein AI of the HRT (M=156.29, SD=14.73) and non-HRT groups [(M=155.53, SD=15.27); t(181) =0.3644; p
=0.7287]. At 18 months as well, there was no sig-nificant difference in apolipoprotein AI between
the HRT (M =156.12, SD =14.81) and non-HRT
groups [(M=155.61, SD=15.61); t(181) =0.2247; p
=0.8225]. However, the effect of HRT treatment on apolipoprotein AI reduction became significant [F(1) =6.39; p=0.0123] when the dichotomous va-riables of major BMI loss [F(1) =0.61; p=0.4371] and major VO2 increase [F(1)<0.01; p =0.9843] were added, suggesting possible apolipoprotein AI-affecting properties of diet and exercise change or related variables (Figure 5).
AAppoolliippoopprrootteeiinn BB ffiinnddiinnggss. Apolipoprotein B of HRT recipients significantly decreased from the baseline to 6 months [−7.96 (SE=4.08), t(170)= −1.9510; p=0.0263]. However, there were no furt-her significant reductions in apolipoprotein B of HRT recipients; therefore, the only comparison for apolipoprotein B between the HRT and non-HRT groups was at 6 months. At 6 months, the mean apolipoprotein B of the HRT group (M= 134.13, SD
= 26.96) was significantly lower than that of the non-HRT group [(M=142.04, SD= 23.96); t(181) =
−2.1016;p=0.0185]. The effect of HRT treatment on apolipoprotein B reduction remained significant [F(1)=4.44; p= 0.0366] when the dichotomous va-riables of major BMI loss [F(1)=0.72; p=0.0366] and major VO2 increase [F(1)=0.10; p =0.7470] were added. Another interpretation of ANCOVA was that, when HRT treatment was taken into account, there were no beneficial effects of BMI loss and VO2max gain on apolipoprotein B reduction (Fi-gure 6).
LLiippoopprrootteeiinn ((aa)) ffiinnddiinnggss. Lipoprotein (a) of HRT recipients significantly decreased from the ba-seline to 6 months [−16.14 (SE=2.02), t(170)= −7.9696; p<0.0001]. However, there were no furt-her significant reductions in lipoprotein (a) of HRT recipients; therefore, the only comparison of
li-FIGURE 4:Box plot of high-density lipoprotein cholesterol at 6 months after HRT for the case and control groups
FIGURE 5:Box plot of apolipoprotein AI at 6 months after HRT for the case and control groups.
FIGURE 6:Box plot of apolipoprotein B at 6 months after HRT for the case and control groups.
poprotein (a) between the HRT and non-HRT gro-ups was at 6 months. At 6 months, the mean lipop-rotein (a) for the HRT group (M= 15.20, SD=15.89) was significantly lower than that for the non-HRT group [(M = 28.55, SD=9.18); t(181) =−7.0530; p
<0.0001]. The effect of HRT treatment on lipopro-tein (a) reduction remained significant [F(1)=50.88;
p<0.0001] when the dichotomous variables of major BMI loss [F(1)=0.52; p=0.4703] and major VO2 increase [F(1)=3.04; p=0.0829] were added. Another interpretation of ANCOVA was that, when HRT treatment was taken into account, there were no beneficial effects of BMI loss, but that the interaction of VO2max gain on the group was sig-nificant [F(1)=4.63; p=0.0327]. However, this effect was minuscule (Figure 7).
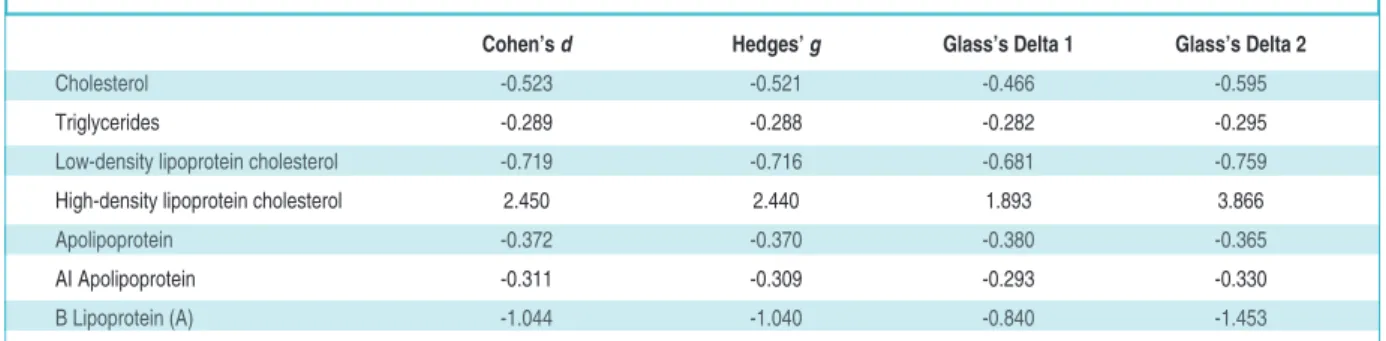
EFFECT SIZES
The effect sizes of the difference between the HRT and non-HRT groups at 6 months have been presen-ted in Table 3 below. The comparison of the effect
sizes indicates that the largest effect size in the study was that for high-density lipoprotein cholesterol, in-dicating that the salutary effect of estrogen adminis-tered to postmenopausal women might be greater for high-density lipoprotein cholesterol than for the other measures in Table 3. It should also be noted that 0 was not found in any of the 90% confidence intervals for the effect sizes. This point was particu-larly important with respect to apolipoprotein AI, for which no statistically significant difference was found between HRT and non-HRT groups.
DISCUSSION
The only unexpected finding in this study was the absence of a significant difference in apolipoprotein AI between the HRT and non-HRT groups. This re-sult could have been caused by a statistical error. One possibility was that a change in apolipoprotein AI as a result of HRT administration interacted with exercise and dietary change, but there were no sig-nificant interactions between (a) apolipoprotein AI, group, and major BMI decrease [F(1)=1.07;
p=0.3022]; (b) apolipoprotein AI, group, and major VO2max increase [F(1)=0.84; p = 0.3593]; and (c) (a) apolipoprotein AI, group, major BMI decrease, and VO2max increase [F(2)=0.72; p=0.4867]. For reasons discussed in the literature review and in-troduction, the absence of a significant difference in apolipoprotein AI between the HRT and non-HRT groups was unexpected, and this finding was also not aligned with the other changes in lipid and lipoprotein observed in the study. Therefore, the absence of a significant difference in apolipoprotein AI between the HRT and non-HRT groups should not be taken as a basis for interpreting existing
fin-FIGURE 7:Box plot of lipoprotein (A) at 6 months after HRT for the case and con-trol groups.
Cohen’s d Hedges’ g Glass’s Delta 1 Glass’s Delta 2
Cholesterol -0.523 -0.521 -0.466 -0.595
Triglycerides -0.289 -0.288 -0.282 -0.295 Low-density lipoprotein cholesterol -0.719 -0.716 -0.681 -0.759 High-density lipoprotein cholesterol 2.450 2.440 1.893 3.866 Apolipoprotein -0.372 -0.370 -0.380 -0.365 AI Apolipoprotein -0.311 -0.309 -0.293 -0.330 B Lipoprotein (A) -1.044 -1.040 -0.840 -1.453
dings or theories about the relationship between es-trogen and lipid/lipoprotein profiles.
The aspect of the study that deserves additio-nal interest is the difference in effect sizes. One question of immediate interest raised in Table 3 is why was the effect of HRT on high-density lipop-rotein cholesterol so much greater than that on the other tested outcome variables. Again, this result could be a statistical artifact more than a clinical clue; however, if future researchers apply effect sizes and find similar gaps in effect sizes, there would be more justification to re-focus research agendas on how and why estrogen replacement might be more beneficial to high-density lipopro-tein cholesterol than to other lipid and lipoprolipopro-tein profiles. In the absence of replication, it is not clear whether such a research agenda is even necessary. In particular, given that previous researchers have not generated effect sizes, there is a need for future studies to include such measures to determine whether HRT might be having different impacts on different lipid and lipoprotein profiles. Such dif-ferential profiles, if they exist, could point the way to identifying mechanisms and characteristics of estrogen that might be more protective for some lipid and lipoprotein profiles than others.
Another unexpected finding of the study was that major BMI loss and major VO2max increase were neither independently predictive of impro-vements in lipid and lipoprotein profiles nor, ex-cept in one case, significant moderators of the impact of HRT. There are several possible reasons for this finding. One possible reason is that the de-finition of major improvement utilized in this study (5% for BMI loss and 1% for VO2max gain) is insufficient as a measure of effect. Perhaps the lipid- and lipoprotein-protective effects of dietary and exercise improvement manifest themselves at greater magnitudes of improvement.
Another possibility is that of inaccurate mea-surement, particularly for BMI. BMI was calculated by weighing subjects and measuring their heights. Participants were weighed in their clothes, minus shoes; however, participants were not directed to wear the same clothing at the 6-, 12-, and 18-month marks, and it is also possible that they were
not weighed in the same conditions (for example, some participants might initially have been weig-hed before going to the bathroom and subsequently weighed after going to the bathroom). The possi-bility of such measurement errors suggests that procedures for obtaining BMI were deficient.
There is also a possibility that BMI loss is an inappropriate proxy variable for dietary improve-ment. Researchers have argued that the quantifica-tion of dietary improvement is difficult; while measuring BMI change is a means of avoiding the definitional and conceptual problems that attempts to measure the quality of diet, the drawback of a BMI-based approached is that BMI can fall for rea-sons, such as illness, that are unrelated to dietary quality.25-32
We were not experts in VO2max measurement, which admitted the possibility of measurement error. In addition, a 1% improvement in VO2max might have been an inappropriate threshold; one that failed to capture true improvements in cardiovascular exer-cise capacity. Finally, it should be noted that the measurement of VO2only captures changes in aero-bic exercise capacity-not anaeroaero-bic capacity, which is also an excellent, and independent, measure of ove-rall physiological health and exercise capacity.
CONCLUSION
The present study had two complementary agenda. The first agenda was to replicate past measure-ments of the effect of HRT on lipid and lipoprotein profiles among postmenopausal women. The se-cond, and more important, agenda was to demons-trate novel approaches to what is now a well-defined and well-studied research topic. Although effect sizes and ANCOVAs represent elementary statistical methods, they can add substantial value to studies on the relationship between HRT and lipid/lipoprotein profiles. ANCOVAs allow for the measurement of interaction between the effect of HRT and other variables. In this study, major BMI change and VO2max change were included as in-dependent predictors and group interaction vari-ables in ANCOVA models; however, future researchers can insert any number of covariates of interest in such models.
In addition, the benefit of calculating effect sizes is that researchers can go beyond determining whether the effects of HRT on lipid/lipoprotein profiles are statistically significant and generate more clinically useful information. As far as an ef-fect size is a measurement of the impact of a pre-dictor variable or an intervention, it provides clinicians and other practitioners with a useful, practical estimate of the outcome of an interven-tion. Although the study had numerous limitati-ons, it provided a demonstration of how going beyond t-tests can add both theoretical and empi-rical value to analyses of HRT effects on lipid/li-poprotein profiles, particularly in the case of estrogen when administered to postmenopausal women.
S
Soouurrccee ooff FFiinnaannccee
During this study, no financial or spiritual support was received neither from any pharmaceutical company that has a direct connection with the research subject, nor from a company that provides or produces medical instruments and materials which may negatively affect the evaluation process of this study. C
Coonnfflliicctt ooff IInntteerreesstt
No conflicts of interest between the authors and / or family members of the scientific and medical committee members or members of the potential conflicts of interest, counseling, ex-pertise, working conditions, share holding and similar situa-tions in any firm.
A
Auutthhoorrsshhiipp CCoonnttrriibbuuttiioonnss
This study is entirely author's own work and no other author contribution.
1. Croft DP, Brent LJ, Franks DW, Cant MA. The evolution of prolonged life after reproduction. Trends Ecol Evol 2015;30(7):407-16. 2. Hawkes K, Coxworth JE. Grandmothers and
the evolution of human longevity: a review of findings and future directions. Evol Anthropol 2013;22(6):294-302.
3. Kim PS, McQueen JS, Coxworth JE, Hawkes K. Grandmothering drives the evolution of longevity in a probabilistic model. J Theor Biol 2014;353:84-94.
4. Peccei JS. A critique of the grandmother hy-potheses: old and new. Am J Hum Biol 2001;13(4):434-52.
5. Finch CE. Evolution in health and medicine Sackler colloqium: evolution of the human lifespan and diseases of aging: roles of infec-tion, inflammainfec-tion, and nutrition. Proc Natl Acad Sci U S A 2010;107 Suppl 1:1718-24. 6. Gurven M, Kaplan H. Longevity among
hunter-gatherers: a cross-cultural examina-tion. Popul Dev Rev 2007;33(2):321-65. 7. Helle S, Lummaa V, Jokela J. Are
reproduc-tive and somatic senescence coupled in hu-mans? Late, but not early, reproduction correlated with longevity in historical Sami women. Proc Biol Sci 2005;272(1558):29-37. 8. Keefe DL, Niven-Fairchild T, Powell S, Bu-radagunta S. Mitochondrial deoxyribonucleic acid deletions in oocytes and reproductive aging in women. Fertil Steril 1995;64(3):577-83.
9. Yun AJ, Lee PY. Maldaptation of the link be-tween inflammation and bone turnover may be a key determinant of osteoporosis. Med Hy-potheses 2004;63(3):532-7.
10. Kirkwood TB. Evolution of ageing. Mech Age-ing Dev 2002;123(7):737-45.
11. Faubion SS, Kuhle CL, Shuster LT, Rocca WA. Long-term health consequences of pre-mature or early menopause and considera-tions for management. Climacteric 2015;18(4):483-91.
12. Lello S, Capozzi A, Scambia G. Osteoporo-sis and cardiovascular disease: an upda-te. Gynecol Endocrinol 2015;31(8):590-4.
13. Talsania M, Scofield RH. Menopause and rheumatic disease. Rheum Dis Clin North Am 2017;43(2):287-302.
14. Garcia M, Mulvagh SL, Merz CN, Buring JE, Manson JE. Cardiovascular disease in women: clinical perspectives. Circ Res 2016;118(8):1273-93.
15. Manson JE, Bassuk SS. Biomarkers of car-diovascular disease risk in women. Metabo-lism 2015;64(3 Suppl 1):S33-S9.
16. Manson JE, Woodruff TK. Reproductive health as a marker of subsequent cardiovas-cular disease: the role of estrogen. JAMA Car-diol 2016;1(7):776-7.
17. Giordano S, Hage FG, Xing D, Chen YF, Allon S, Chen C, et al. Estrogen and cardiovascular disease: is timing everything? Am J Med Sci 2015;350(1):27-35.
18. Nii S, Shinohara K, Matsushita H, Noguchi Y, Watanabe K, Wakatsuki A. Hepatic ef-fects of estrogen on plasma distribution of small dense low-density lipoprotein and free radical production in postmenopausal women. J Atheroscler Thromb 2016;23(7): 810-8.
19. Cohen J. Statistical Power Analysis for the Be-havioral Sciences. 2nded. New York:
Rout-ledge; 2013. p.567.
20. Hedges LV. Distribution theory for Glass’s esti-mator of effect size and related estiesti-mators. Jour-nal of EducatioJour-nal Statistics 1981;6(2):107-28. 21. Hedges LV. Estimation of effect size from a
series of independent experiments. Psychol Bull 1982;92(2):490-9.
22. Wegge JK, Roberts CK, Ngo TH, Barnard RJ. Effect of diet and exercise intervention on in-flammatory and adhesion molecules in post-menopausal women on hormone replacement therapy and at risk for coronary artery disease. Metabolism 2004;53(3):377-81.
23. Bayrak A, Aldemir DA, Bayrak T, Corakçı A, Dursun P. The effect of hormone replacement therapy on the levels of serum lipids, apolipoprotein AI, apolipoprotein B and lipoprotein (a) in Turkish postmenopausal women in Turkish. Arch Gynecol Obstet 2006;274(5):289-96.
24. Kim CJ, Jang HC, Cho DH, Min YK. Effects of hormone replacement therapy on lipoprotein (a) and lipids in postmenopausal women. Ar-terioscler Thromb 1994;14(2):275-81. 25. Alexy U, Libuda L, Mersmann S, Kersting M.
Convenience foods in children’s diet and as-sociation with dietary quality and body weight status. Eur J Clin Nutr 2011;65(2):160-6. 26. Gille D, Bütikofer U, Chollet M, Schmid A,
Al-tintzoglou T, Honkanen P, et al. Nutrition be-havior of the middle-aged and elderly: compliance with dietary recommendations of the food pyramid. Clin Nutr 2016;35(3):638-44.
27. Jakubowicz D, Froy O. Biochemical and meta-bolic mechanisms by which dietary whey pro-tein may combat obesity and Type 2 diabetes. J Nutr Biochem 2013;24(1):1-5.
28. Kozimor A, Chang H, Cooper JA. Effects of di-etary fatty acid composition from a high fat meal on satiety. Appetite 2013;69:39-45. 29. Pala V, Lissner L, Hebestreit A, Lanfer A, Sieri
S, Siani A, et al. Dietary patterns and longitu-dinal change in body mass in European
chil-dren: a follow-up study on the IDEFICS multi-center cohort. Eur J Clin Nutr 2013;67(10):1042-9.
30. Soltani S, Shirani F, Chitsazi MJ, Salehi-Abar-gouei A. The effect of dietary approaches to stop hypertension (DASH) diet on weight and body composition in adults: a systematic review and meta-analysis of randomized controlled clinical trials. Obes Rev 2016; 17(5):442-54.
31. Spiteri Cornish L, Moraes C. The impact of consumer confusion on nutrition literacy and subsequent dietary behavior. Psychol Mark 2015;32(5):558-74.
32. Vergati M, Krasniqi E, Monte GD, Riondino G, Vallone S, Guadagni D, et al. Ketogenic diet and other dietary intervention strategies in the treatment of cancer. Curr Med Chem 2017;24(12):1170-85.