Inertial Sensors and Systems 2018 Braunschweig, Germany
Reduction of Thermal Strain Induced Rate Error for
Navigation Grade Fiber Optic Gyroscope
B. Osunluk1,2, S. Ogut1,3, E. Ozbay1,3
1 Department of Electrical and Electronics Engineering Bilkent University
06800 Ankara TURKEY
2 Microelectronics, Guidance and Electro-optics Sector Aselsan Inc.
06011 Ankara TURKEY
3 Nanotechnology Research Center (NANOTAM) Bilkent University
06800 Ankara TURKEY
Abstract
In this paper, we present the latest efforts of developing a navigation grade fiber optic gyroscope coil in Turkey. One of the main precision limits for a fiber optic gyroscope coil is its sensitivity to thermally induced rate error. We used an advanced thermal modeling of a fiber optic gyroscope coil in order to obtain the strain fields along the coil and calculate the rate error. An intermediate validation step which compares the strain field calculations with the optical time domain reflectometer (OTDR) measurements of a laboratory fiber optic gyroscope setup is presented. In literature, there are several works indicating the relation between strain and rate error and trying to reduce the total strain as a whole [1], [2]. The strain analysis is separated into axial and radial gradients along the fiber coil. A new fiber coil structure using titanium as the spool material is designed and two fiber coils are produced. Fiber coils are tested under a temperature profile ranging from -40 °C to +60 °C. Simulation and experimental results are consistent. Proposed coil design is promising with 8-fold reduction in rate error.
1. Introduction
Fiber optic gyroscope (FOG) is a mature technology for high precision inertial navigation applications. The wide usage area of the technology brings the demand for better performance under environmental disturbances. One of the main performance limits is the thermally induced rate error. Most of the work in the literature propose to control the error by reducing the total stress along the fiber coil as a whole.
In this paper, we proposed an approach for stress analysis for a fiber coil. Although the total stress and strain fields do not change, rate error is reduced as stress homogeneity increases. Strain homogeneity measurement is not a straightforward application. We use finite element model (FEM) analysis to obtain the strain distribution along the fiber coil.
2. Theory
2.1 Shupe Equation and Elastooptic Interactions
Thermal fluctuations create nonreciprocal phase shift between counterpropagating waves in the fiber coil. Nonreciprocal phase shift is defined by Shupe [3], given in equation 1. Mohr [4] extends this analysis for elastooptical interactions (see equation 2). Temperature
Δ𝜙𝜙 =𝛽𝛽0
𝑐𝑐 ∫ (𝑛𝑛̇ + 𝑛𝑛𝜀𝜀𝑧𝑧̇ )(𝐿𝐿 − 2𝑑𝑑)𝑑𝑑𝑑𝑑 𝐿𝐿
0 (1)
𝑛𝑛̇ = −𝑛𝑛23[(𝑝𝑝11+ 𝑝𝑝12)𝜀𝜀𝑟𝑟̇ + 𝑝𝑝11𝜀𝜀𝑧𝑧̇ ] (2) Here 𝛽𝛽0 is the free space propagation constant, 𝑛𝑛̇ is the refractive index change, 𝜀𝜀𝑧𝑧̇ and 𝜀𝜀𝑟𝑟̇ are the strain changes along z-direction (the direction light wave travels) and r-direction (radial direction of fiber core), 𝐿𝐿 is the total fiber length and 𝑑𝑑 is the distance from one of the fiber coil ends. In this equation 𝑑𝑑𝑑𝑑 states the fiber segment which is three dimensional in space.
2.2 Phase Error Calculation Approach
We have developed a method for the calculation of the phase error. Fiber coil is a cylindrical structure and the integral can be represented in radius, azimuth and height (𝑟𝑟, 𝜃𝜃, 𝑧𝑧). Fiber coil consists of fiber core, cladding, coating and adhesive. Light travels only in the fiber core so integral is taken through fiber core which is only continuous through azimuth and discrete for axial and radial directions. We reduce the equation to two dimensions and discretize it for calculation.
Δ𝜙𝜙(𝑡𝑡) =𝛽𝛽0 𝑐𝑐 ∑ ∑ ∫ �𝑛𝑛̇�𝑟𝑟𝑖𝑖, 𝜃𝜃, 𝑧𝑧𝑗𝑗, 𝑡𝑡� + 𝑛𝑛𝜀𝜀𝑧𝑧̇ �𝑟𝑟𝑖𝑖, 𝜃𝜃, 𝑧𝑧𝑗𝑗, 𝑡𝑡�� (𝐿𝐿 − 2𝑑𝑑)𝑑𝑑𝜃𝜃 2𝜋𝜋 0 ∆𝑑𝑑 𝑁𝑁𝑎𝑎𝑎𝑎𝑎𝑎𝑎𝑎𝑎𝑎 𝑗𝑗=1 𝑁𝑁𝑟𝑟𝑎𝑎𝑟𝑟𝑎𝑎𝑎𝑎𝑎𝑎 𝑖𝑖=1 (3)
Where 𝑁𝑁𝑟𝑟𝑟𝑟𝑟𝑟𝑖𝑖𝑟𝑟𝑟𝑟, 𝑁𝑁𝑟𝑟𝑎𝑎𝑖𝑖𝑟𝑟𝑟𝑟 are the radial and axial layer numbers and 𝑁𝑁 = 𝑁𝑁𝑟𝑟𝑟𝑟𝑟𝑟𝑖𝑖𝑟𝑟𝑟𝑟× 𝑁𝑁𝑟𝑟𝑎𝑎𝑖𝑖𝑟𝑟𝑟𝑟 is the total number of turns. Here radial and axial subscripts define the axial and radial directions of the fiber coil cross-section. Combining the Sagnac relation with the equation,
Ω(𝑡𝑡) =𝜋𝜋𝑁𝑁𝑛𝑛 ∑ 𝑟𝑟1 𝑎𝑎2∑ ∫ �𝑛𝑛̇�𝑟𝑟𝑖𝑖, 𝜃𝜃, 𝑧𝑧𝑗𝑗, 𝑡𝑡� + 𝑛𝑛𝜀𝜀𝑧𝑧̇ �𝑟𝑟𝑖𝑖, 𝜃𝜃, 𝑧𝑧𝑗𝑗, 𝑡𝑡�� (𝐿𝐿 − 2𝑑𝑑)𝑑𝑑𝜃𝜃 2𝜋𝜋 0 ∆𝑑𝑑 𝑁𝑁𝑎𝑎𝑎𝑎𝑎𝑎𝑎𝑎𝑎𝑎 𝑗𝑗=1 𝑁𝑁𝑟𝑟𝑎𝑎𝑟𝑟𝑎𝑎𝑎𝑎𝑎𝑎 𝑖𝑖=1 (4)
Here 𝑑𝑑𝑖𝑖 is the diameter of each turn. Diameter of the fiber coil increases for each layer through radius. Using the relation ∆𝑑𝑑 =𝑁𝑁𝐿𝐿 =𝜋𝜋𝑟𝑟𝑎𝑎𝑁𝑁
𝑁𝑁 = 𝜋𝜋𝑑𝑑𝑖𝑖, , and taking the integral over 𝑑𝑑𝜃𝜃 results as Ω(𝑡𝑡) =𝑛𝑛𝑁𝑁∑ 𝑟𝑟1 𝑎𝑎∑ �𝑛𝑛̇�𝑟𝑟𝑖𝑖, 𝑧𝑧𝑗𝑗, 𝑡𝑡� + 𝑛𝑛𝜀𝜀𝑧𝑧̇ �𝑟𝑟𝑖𝑖, 𝑧𝑧𝑗𝑗, 𝑡𝑡�� (𝐿𝐿 − 2𝑑𝑑 − 𝑙𝑙𝑖𝑖) 𝑁𝑁𝑎𝑎𝑎𝑎𝑎𝑎𝑎𝑎𝑎𝑎 𝑗𝑗=1 𝑁𝑁𝑟𝑟𝑎𝑎𝑟𝑟𝑎𝑎𝑎𝑎𝑎𝑎 𝑖𝑖=1 (5)
where 𝑙𝑙𝑖𝑖 is the length of each fiber turn which is different for every radial layer. This equation is the 2-D approximation for calculation of the total phase error due to any disturbance (temperature, vibration, moisture…) that changes the strain field.
3. Modeling of Fiber Coil
In our previous work, we presented a model for thermally induced rate errors for a fiber optic gyroscope with quadrupole winding [5] (Figure 1). In that work, we have developed a simulation environment for calculation of the errors of a fiber coil design and verified the simulation environment with experimental results of three different fiber coils. We concluded that elastooptic effect is much stronger than the pure Shupe error for that coil design.
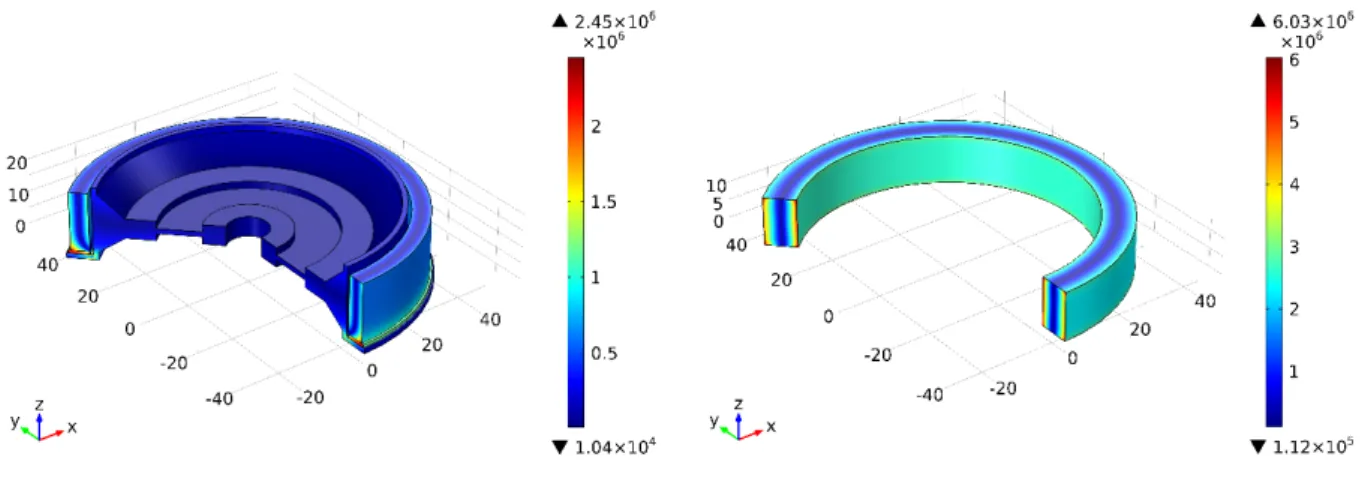
Figure 1. Finite element model simulation of the fiber coil with and without spool
The elastooptic effect is directly related to the stress-strain characteristics of the fiber coil. We run a simulation to obtain the total refractive index change and total elongation of a fiber coil under temperature variation. Refractive index change is found to be 7 × 10⁻⁶ ℃−1 which is close to the temperature coefficient of refractive index for fiber core material, 10−5 ℃−1. Total strain change due to thermal variation is calculated and compared with OTDR measurements of a fiber coil.
4. Strain Measurements
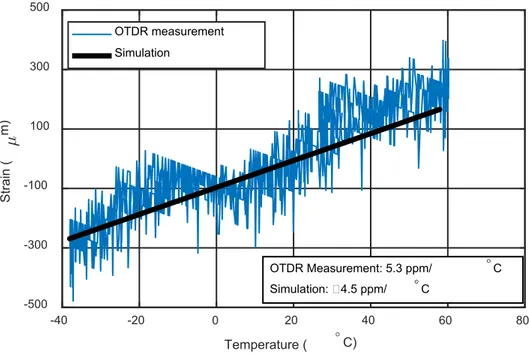
Fiber coil is subjected to a temperature change from -40 °C up to +60 °C and the flight time inside the fiber coil is measured continuously with the OTDR. The flight time includes
Figure 2. Comparison of OTDR measurement and simulation output
Consistent results provide an intermediate verification step for the strain calculations of our model. We use the verified model for further analysis.
5. High Performance Fiber Coil Design
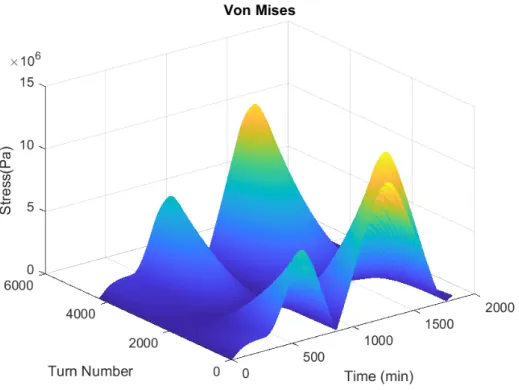
In order to reduce the elastooptic effects, we designed a new fiber coil without spool and with titanium spool, which has a temperature expansion coefficient much closer to fiber. We obtained stress and strain values from the model. Figure 3 shows the Von Mises stress distribution along the fiber coil with the aluminum spool and Table 1 gives the stress values of newly designed fiber coils. Although Von Mises stress characteristics and values stay same, bias error significantly reduced.
-40 -20 0 20 40 60 80 Temperature ( ° C) -500 -300 -100 100 300 500 Strain ( m) OTDR measurement Simulation OTDR Measurement: 5.3 ppm/ ° C Simulation: 4.5 ppm/ ° C
Figure 3. Stress distribution along the fiber coil while the temperature is changing Table 1: Von Mises stress values for different spool materials
Spool Material Maximum Von Mises Stress (Pa) Average Von Mises Stress (Pa)
Aluminum 1.34 × 10⁷ 2.15 × 10⁶
Titanium 1.32 × 10⁷ 2.14 × 10⁶
No Spool 1.31 × 10⁷ 2.14 × 10⁶
5.1 Strain Inhomogeneity
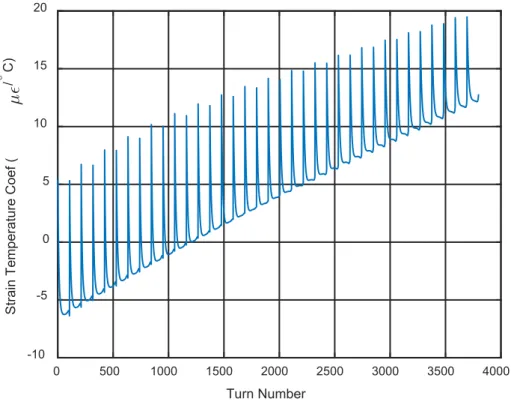
Equation 5 provides a basis for analysis of the strain gradients in axial and radial directions. We calculate the temperature coefficient of strain change for each fiber turn. Strain temperature coefficient versus fiber turn location is a serrated line, where serration indicates the axial strain and line indicates the radial strain (see Figure 4.). Although the change in the strain temperature coefficient is higher in the radial direction than the axial,
Figure 4. Strain temperature coefficient for each turn number
Strain coefficients of each turn in the same radius are averaged and named as axial strain coefficients. This gives the inhomogeneity in the fiber coil axial direction. The same method is carried out to obtain the radial strain coefficients. Calculated strain coefficients are given in Figure 5 for different spool materials. Radial strain temperature coefficient change is a straight line, while axial strain coefficient shows an asymmetric characteristic. Although the value of radial coefficient change is higher than the axial coefficient, the rate error of radial layers cancels out each other, thanks to quadrupole winding pattern.
Figure 5. Strain temperature coefficients for different spool configurations
0 500 1000 1500 2000 2500 3000 3500 4000 Turn Number -10 -5 0 5 10 15 20
Strain Temperature Coef (
/°
C)
0 10 20 30 40
Layer Number (1 is the inner layer) -10 -5 0 5 10 15
Strain Temperature Coef (
/°
C)
Radial Mean Strain Coefficients Aluminum
No Spool Titanium
0 20 40 60 80 100 120
Layer Number (1 is the inner layer) 3 4 5 6 7 8 9
Strain Temperature Coef (
/°
C)
Axial Mean Strain Coefficients
Aluminum No Spool Titanium
Strain temperature coefficient change for axial direction is limited. However, it is the main contributor to phase error if the winding pattern has an axial asymmetry, as for the practical quadrupole pattern. It is also seen from Figure 5 that, radial strain coefficients do not differ too much for different spool configurations. Axial strain coefficient asymmetry is higher for aluminum spool than titanium spool and no spool configurations.
5.2 Experiment
A closed-loop fiber optic gyroscope setup is built for laboratory experiments. This setup consists of one ASE light source, two MIOC - fiber coil pairs, and digital and analog electronic boards. The setup is placed in a temperature chamber during temperature tests. Temperature sensors are mounted on each coil spool to monitor the coil temperature.
Figure 6. Setup for fiber coil temperature experiments
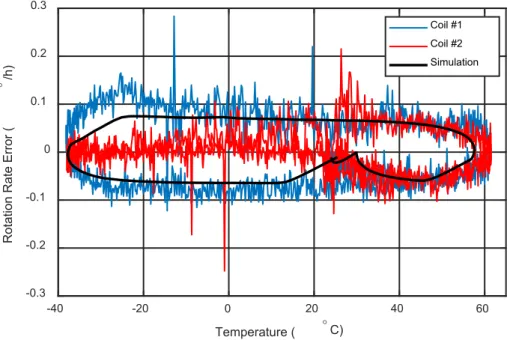
Temperature profile ranging from -40 °C to +60 °C is applied to fiber coils while temperature and rotation rate measurement data are collected. Collected rotation rate data is processed to eliminate the earth rotation and gyro noise. Experimental and simulation results are plotted in Figure 7. Thermal sensitivity coefficient of a fiber coil is defined as the ratio of the rate error to the temperature derivative. Calculated coefficients are given in Table 2.
Figure 7: Experimental data for two fiber coils and simulation result of the coil design Table 2: Thermal sensitivities of the fiber coils and the model
Coil No Thermal Sensitivity Coefficient �℃/𝒎𝒎𝒎𝒎𝒎𝒎�°/𝒉𝒉 Coil #1 -0.41 Coil #2 -0.16 Simulation -0.40
Rate error characteristics of the two fiber coils are consistent with the theoretical model. Coil-1 is nearly perfectly matched with the simulation result. Coil-2 also aligned with the simulation result above room temperature. However, Coil-2 thermal sensitivity reduces nearly to zero below room temperature. This phenomenon is called the racket effect in the literature.
6. Conclusion
We showed strain inhomogeneity can result in rate error for a fiber coil. We designed a new coil by using the simulation model with better performance. We verified the model with laboratory experiments. -40 -20 0 20 40 60 Temperature ( ° C) -0.3 -0.2 -0.1 0 0.1 0.2 0.3
Rotation Rate Error (
° /h)
Coil #1 Coil #2 Simulation
References
[1] S. Minakuchi, et. al., “Thermal strain in lightweight composite fiber-optic gyroscope for space application”, Journal of Lightwave Technology, vol. 33, no. 12, pp. 2658-2662, 2015.
[2] E. Quatraro, et. al., “High performance FOG for non temperature stabilized environment”, 2011 DGON Inertial Sensors & Systems, Germany, 2011
[3] D. M. Shupe, “Thermally induced non-reciprocity in the fiber optic interferometer,” Applied Optics, vol. 19, no. 5, pp. 654-655, 1980.
[4] F. Mohr, “Bias error fiber optic gyroscopes due to elastooptic interactions in the sensor fiber,” Proceedings of SPIE, vol. 5502, pp. 410-413, 2004.
[3] B. Osunluk, S. Ogut and E. Ozbay, “Thermally induced bias errors for a fiber coil with practical quadrupole winding”, Proc. IEEE Inertial Sensors and Systems, pp. 152-155, 2017