y Ä » "і 2 W4· 2 ■ •'^■’ » ^ ■ «tf- «·'·*» ¿;i/í '« Ai .^с*
— · «#··<·Μ··.»-*». «ίίϋϋ. 4 / i івй. i w * W л W ^
kDUXi
AN INVENTORY MANAGEMENT SYSTEM
FOR
ÖZALTIN CONSTRUCTION AND TRADING COMPANY
A T H E S IS
S U B M IT T E D TO TH E FACULTY OF M A N A G E M E N T AND
GRADUATE SC H O O L OF B U SIN E S S A D M IN IS T R A TIO N OF B IL K E N T U N IV E R S IT Y
IN PARTIAL F U L F IL L M E N T OF T H E R E Q U IR E M E N T S FOR THE DEGREE OF
MASTER OF B U SIN E S S A D M IN ISTR A TIO N
BY
AYTUG ÖZALTIN FEBRUARY, 1992
ÇQ
O-Oh
av ı
I certify that I have read this thesis and in my opinion it is fully adequate, in scope and quality, as a thesis for the degree of Master of Business Administration.
Assistant Prof. Dr. Erdal Erel
I certify that I have read this thesis and in my opinion it is fully adequate, in scope and quality, as a thesis for the degree of Master of Business Administration .<
Assistant Prof. Dr. Dilek Önkal
I certify that I have read this thesis and in my opinion it is fully adequate, in scope and quality, as a thesis for the degree of Master of Business
Administration. ---
0
L i i-U
Assistant Prof.KDr. Ümit Yüceer
Approved for the Graduate S c h ^ l of Business Admin
istration.
\
0
/ ·ABSTRACT
AN INVENTORY MANAGEMENT SYSTEM FOR
OZALTIN CONSTRUCTION AND TRADING COMPANY BY
AYTUG OZALTIN
SUPERVISOR : ASSISTANT PROF. DR. ERDAL EREL FEBRUARY 1992
♦
This study basically deals with establishing an inventory management system for Ozaltin Construc tion and Trading Company. It is aimed at improving the inventory control system through better alloca tion of operating funds and managerial efforts to the items in the inventory.
The study starts with a classification system, where items are ranked in descending order of
importance. The classification criteria are condi tions of supply, consumption and storage, and the monetary usage rate of the items. The categoriza tion highlights the items in inventory that really require the necessary attention.
The rest of the study deals with various decision systems for these items on when to place an order.
Considering the increases in inventory holding costs, as well as the penalties of delaying a job, it is clear that even small improvements will yield to considerable amount of savings.
Keywords : Inventory management, safety stock, reorder point.
ÖZET
ENVANTER YÖNETİM SİSTEMİ ÜZERİNE BİR UYGULAMA
ÖZALTIN İNŞAAT VE TİCARET A.Ş. AYTUĞ ÖZALTi n
YÜKSEK LİSANS TEZİ, İŞLETME ENSTİTÜSÜ TEZ YÖNETİCİSİ ; YRD. DOÇ. DR. ERDAL EREL
ŞUBAT 1992
Bu çalxşma, esas olarak, Özaltrn İnşaat ve Ticaret A.Ş.'nde bir envanter yönetim sisteminin kurulması üzerinedir. Amaç, malzemeler için harcanan para ve zamanın daha verimli bir biçimde dağıtılmasını sağlayarak, envanter kontrolünü geliştirmektir.
Çalışma, malzemelerin önem sırasına göre sıralandı- rıldığı bir sınıflandırma sistemiyle başlamaktadır. Bu sınıflandırmada esas alınan kriterler yıllık nakit kullanımı, tedarik ve talep durumları gibi faktörlerdir. Amaç, binlerce malzeme arasından, gerçekten önemli olanları bulup çıkarmaktır.
Çalışmanın devamında, önemli kabul edilen malzeme ler için, ne zaman sipariş verilmesi konusunda yardımcı olmak üzere, değişik karar verme sistem
leri tanxtxlmaktadır.
Parayx malzemeye bağlamanxn ve işi geciktirmenin artan maliyetlerini gözönüne alxnxrsa, envanter konusunda en ufak bir geliştirmenin dahi azrmsan- mayacak tasarruflar kaydedeceği açxktxr.
Anahtar sözcükler : Envanter kontrolü, emniyet stoğu, yeniden sipariş noktasr.
ACKNOWLEDGEMENTS
I am grateful to Assistant Prof. Dr. Erdal Erel for his supervision and helpful comments throughout the study. I would also like to express my thanks to the other members of the examining committee for their contribution.
I also thank to my family for their continuous support and encouragement during the preparation of this thesis.
TABLE OF CONTENTS ABSTRACT ... i ÖZET ... iii ACKNOWLEDGEMENTS ... V TABLE OF CONTENTS ... V İ LIST OF TABLES ... ix 1 - INTRODUCTION ... 1 1.1 - Inventory Concept ... l 1.1.1 - Definition ... 1 1.1.2 - Functions ... 2 1.1.3 - Types ... 4 1.1.4 - Costs ... 6 1.2 - Problem Definition ... 8
1.3 - Purpose of the Thesis ... 9
1.4 - Background of the Firm ... 11
1.5 - Outline of the Thesis ... 12
2 - INVENTORY CONTROL ... 14
2.2 - Objectives ... 14
2.3 - Steps in Developing an Inventory Control System ... 15
2.4 - Advantages ... 16
2.5 - Reguirements ... 18
3 - METHODOLOGY ... 21
3.1 - ABC Classification Method ... 21
3.1.1 - Making ABC Classification ... 21
3.1.2 - An Extension of ABC Classification . 25 3.1.3 - Control of A, B and C Class Items .. 30
3.1.4 - Usage of the Classification System . 31 3.2 - Reorder Point (ROP) Method ... 33
3.2.1 - Definition ... 33
3.2.2 - Types of Techniques ... 34
3.2.3 - Choice of a ROP Model ... 35
3.2.4 - Choice of a ROP Model for A Items .. 36
3.2.5 - Models for Fast Moving A Items ... 37
3.2.5.1 - Required Information ... 37
3.2.5.2 - Different Cases ... 38
3.2.6 - Models for Slow Moving A Items .... 41
3.2.6.1 - Poisson Models ... 41
3.2.6.2 - Laplace Models ... 44
4 - AN APPLICATION : OZALTIN CONSTRUCTION AND TRADING C O ... 46
4.1 - Current Situation in the F i r m ... 46
4.2 - Sample and Data Collection ... 47
4.3.1 - Based on Total Annual TL Usage ... 49
4.3.2 - Based on Situational Factors ... 51
4.3.3 - Determination of Weights ... 51
4.3.4 - Results of Classification ... 52
4.4 - Reorder Point Analysis for A Items .... 53
4.4.1 - Categorization of A Items as Fast and Slow Movers ... 53
4.4.2 - ROP for Fast Moving A Items ... 55
4.4.3 - ROP for Slow Moving A Items ... 57
4.4.3.1 - Poisson Models ... 57
4.4.3.2 - Laplace Models ... 62
5 - SUMMARY AND CONCLUSION ... 67
APPENDIX A ... 70
APPENDIX B ... 71
REFERENCES ... 75
LIST OF TABLES TABLE 1 ... 77 TABLE 2 ... 78 TABLE 3 ... 85 TABLE 4 ... 92 TABLE 5 ... 105 TABLE 6 ... 112 TABLE 7 ... 113
1. INTRODUCTION
1.1. The Inventory Concept :
1.1.1. Definition :
Inventories are stocks or store of goods at any point in time. Many firms stock hundreds or even thousands of items ranging from small things like pencils, paper, screws, bolts and nuts to large items like machines, trucks, construction equip ment, and aeroplanes depending upon the business they are in. Typically, manufacturing firms carry supplies of raw materials, purchased parts, parti ally completed items and finished goods as well as spare parts for machines and equipments.Hospitals carry drugs, surgical supplies, sheets and pillows and so on, whereas supermarkets fresh and canned foods, packaged and frozen foods, household sup plies, baked goods and other miscellaneous items.
Inventories tie up capital, use storage space, require handling, deteriorate, in some cases become obsolete, incur taxes, require insurance, can be stolen, and sometimes are lost.Despite all these drawbacks, firms continue holding inventories because of the functions they serve [1].
Inventories serve numerous functions. Among them, the most important ones are as follows :
Inventories meet anticipated demand
^
These inven tories are also called as anticipation stocks and are held to satisfy planned or expected demand.Inventories smooth production requirements j. Pre sence of inventories ensure smooth operation of a production line. Particularly, the firms that experience seasonal patterns in demand often build up inventories during off-seasonal periods so as to meet high demand that exists during seasonal per
iods .
Inventories decouple operations j. Inventories are kept in successive steps in a production or distri bution system to avoid interruption of operations. They serve as buffer to compensate a temporary break in the chain, such as a machine breakdown or poor weather conditions.
1.1.2. Functions of Inventory :
Inventories protect against stock-outs j. Delayed deliveries resulted from weather conditions, sup plier stock-outs, deliveries of wrong materials.
quality problems, etc. and/or unexpected increases in demand give rise to risk of shortage. The risk can be reduced by holding 'safety stocks', which are stocks in excess of anticipated demand.
Inventories take advantage of order cycles j. To minimize fixed purchasing and inventory costs, it is often necessary to buy quantities that exceed immediate usage requirements. The excess output will be stored for later use. Thus, inventory storage enables a firm to buy and produce in econo mic lot sizes, which results in 'periodic orders' or 'order cycles'. The resulting stock is known as
'cycle stocks'.
Order cycles are not always due to being economi cal; sometimes due to simply being practical in terms of ordering at fixed intervals.
Inventories hedge against price increases j. Especi ally if the firm is living in an inflationary environment like Turkey, items are purchased in larger amounts than currently needed and are kept as inventory. Aim is to achieve savings via pur chasing those items prior to substantial price
increases.
Inventories permit operations j. Inventories exist because materials must be moved between locations
and are unavailable for use while being moved.Thus, inventories must be available for use, while goods in transit [1,3].
1.1.3. Types of Inventories :
Inventories can be classified into three types depending upon the stage of production they exist : Raw materials and purchased parts, partially com pleted goods (work-in-process), finished goods inventories (manufacturing firms) or merchandise (retail stores) and supplies (maintenance, repair and operating supplies) [2,3]. Besides these gen eral classification, materials can also be classi fied into four categories depending upon the func tions they serve : Anticipation, lot size, fluctua tion, transportation and decoupling inventories.
Anticipâtion/seasonal/stabilization/hedge inventor ies are the inventories that are used to protect the organization against potential increased needs. The increased needs may be the result of increased sales in anticipation of special sales promotions, seasonal fluctuations, vacations and shutdowns, and as a hedge against potential price increases.Anti cipation inventories do increase cost, but the cost is generally less than that of the consequences of not having the material.
Lot size/cycle/working stock inventories are the materials that are kept in quantities larger than normally required for a production run. Fixed costs involved such as shipping and set up, quantity price breaks or simply the practicality are some of the reasons for purchasing or production of lot size inventories. Aim here is to spread these fixed costs or efforts to many items in the lot.
Fluctuation/buffer/safety stock inventories are items that are stocked to protect against changes in demand or supply. They act as a buffer in case of forecast errors : If the demand is underestima ted, these will be utilized to avoid stock-outs.
Transportâtion/pipeline/work-in-process inventories are the extra materials that are kept for use while goods are in transit. They permit operations to perform smoothly and without any interruption.
Decoupling inventories are the inventories accumu lated between dependent activities or stages to reduce the requirement for completely synchronized operations. They isolate one part of the system from the next to allow each to operate more inde pendently. Thus, they exist between stages of supply, production and distribution system [1,2].
Inventories involve various costs depending upon its nature. Basic categories are preparation, carrying, stock-out and capacity related costs.
Preparation/procurement costs are composed of two parts : The costs that has to be paid by the orga nization to the supplier of the ordered items, also called purchasing cost. and the costs incurred in the procurement process, also called ordering costs. The ordering cost is composed of costs involved during administration (paperwork, computer processing, telephone calls, fax, postage, etc.) and transportation of the items ordered, and during handling and inspection of the shipment after arrival.
Procurement costs can be regrouped into two in terms of dependability on order size : Costs per unit of item that depend on the amount ordered (such as administrative costs) and unit costs that do not depend on the order size (constant unit purchasing price assuming no quantity price break downs) .
1.1.4. Costs :
Carrying costs are the costs associated with the existence of inventories due to a number of causes: Storage, handling, property taxes, insurance.
spoilage, obsolescence, pilferage, rent of storing facilities, and capital costs. The capital cost represents either direct expenditures for funds or the rate of return that could be obtained by in vesting elsewhere (the money invested in inventory could be invested in an interest bearing account and could earn money for the organization).
Some of the carrying costs are dependent on the level of inventory and some are not( eg. amount spent on heating, lightning and security services for the warehouse).
Stock-out costs are the costs that occur when an organization cannot fill a customer or production order. Depending on the circumstances, costs in curred vary :
To meet the demand, a special order may be placed, in which case stock-out cost is the addi tional cost of the special order as compared to the cost of routine procedure.
- Demand is backordered and filled when stock becomes available by routine replenishment, in which case stock-out cost is related with loss of customer goodwill, and thus is less tangible in nature.
Demand is lost, in which case stock-out costs are both loss of goodwill and loss of profit on the units which were demanded, but were unavailable.
Moreover, in all of the above cases, there is a potential for the loss of future orders, which are again not very tangible.
Capacity related costs are the costs associated with expanding or contracting production capability in response to demand. Former includes costs such as hiring and training direct labor and supervi sors, adding service personnel, and latter such as unemployment and layoff costs, overhead costs (spreaded over smaller production quantities) [1,4].
1.2. Problem Definition :
Purchasing Department of Ozaltin Construction and Trading Co. is faced with an inventory management problem: In one hand, there is the problem of high carrying costs of inventories, particularly that of machine spare parts and, on the other hand, there
is the problem of stock-outs.
The firm is in dam construction business and uses heavy machines ( also called "earth moving equip
ments” ) , all of which are imported and thus have very expensive materials for maintenance, repair and operating. Therefore, holding costs of these items are very high.
The firm has to meet certain legal contractual obligations while building the dams. If it fails to meet those obligations, such as delaying the job, it has to pay considerable amount of penalties. Because of lack of a small spare part, an expensive piece of earth moving equipment stays idle.
Currently, the 52 73 items in the firm are con trolled and order placements are made on a judg mental basis. Apart from grouping those items with respect to the machines they belong to, no scienti fic inventory control technique has been employed. Therefore, the company is in desperate need of a systematic and effective inventory management system.
1.3. Purpose of the Thesis :
The purpose of the thesis is to aid Ozaltin Con struction and Trading Co. in their inventory man agement problem by developing and installing some classification and control techniques based on the data taken from old company records.
In this case, inventory management involves more than thousands of individual transactions each year. Inventory control procedure to be suggested should first identify those items requiring accur ate control from other items that can be controlled with less accuracy. Therefore, the thesis starts with an inventory classification system, namely ABC.
The "classical" ABC classification system categor izes items in descending order of importance with respect to their annual dollar usage. However, categorization on the basis of dollar usage value may be misleading and may yield erroneous results. Thus, the classification that will be made in this study is based on an extension of ABC method, which takes also many other conditional factors into account.
After deciding upon the items to concentrate on, a decision system based on the inventory system on hand will be recommended : In this case order for inventory is placed once, and is not repeated (single order), is manufactured outside the organi zations, i.e. it is purchased (outside supply), its demand rate is variable and independent, and its lead time (the time that passes between placement and receipt of order) is variable in most of the
time, and thus require a "single order quantity" inventory system.
In the light of discussions made with Purchasing Department personnel, it has been found out that there is a need for a decision system on when to order each item. Through the use of demand and lead time data, the thesis will also provide an answer to this question.
1.4. Background of the Firm :
Özaltin Construction and Trading Co. is in con struction business since 1972. Its resources include a large and experienced technical staff, financing and administrative specialists and a modern machinery pool, which enable them to under take construction work for housing, roads, tunnels and dams; project preparation, control, consultancy and turnkey projects.
Over the last 20 years, the firm has undertaken projects for government, among which integrated meat processing plants of Elazig and Kars; cigar ette factory of Adana; police training center in Golbasi; T.C. Ziraat Bank's training facilities in Yenimahalle; irrigation of Burdur Bozçay (plain dam and channel construction); Koçköprü Dam and hydro electric power plant construction (Van); Ercis
(Van) - Diyadin (Agri) road construction; and currently Özlüce Dam, hydroelectric power plant and dam housing complexes construction (Elazig) can be counted.
This study considers only the inventories of ma chines' spare parts, which are being used in the construction of Özlüce Dam and HEPP.
1.5. Outline of the Thesis :
The thesis consists of two main parts; theory and application. The second chapter gives a literature survey on inventory management concepts : the definition, objectives and advantages of inventory management are described as well as the steps in developing an effective inventory management pro gram and the requirements for this program.
The third chapter describes the methodology that will be used in application, which are basically the "classical" ABC classification, its extension through the use of additional criteria, and the Reorder Point (ROP) techniques. This chapter also gives information about control of A, B and C items, usage of the ABC classification, and about the different types and cases of ROP analysis.
methods to the inventories of Ozaltin Construction and Trading Co. is described. The chapter also includes the current situation of the firm, sample and data collection. Finally in the fifth chapter, conclusions are made.
INVENTORY CONTROL
2.1. Definition :
Inventory control is the process of maintaining stock levels of raw materials, work-in-process, and finished goods at appropriate levels to assure consistency with production control plans. The control or management system is made up of a set of rules and procedures that enable manager to make routine decisions on "when" and "how much" to order of each item needed, and to make nonroutine deci sions on situations where the rules do not cover. Thus, it provides necessary information to managers in order to make these decisions effectively [1,4].
2.2. Objectives :
The objectives of inventory control or management is the minimization of the costs incurred in the inventory system and at the same time maximization of customer service level. These are contradicting objectives, since high levels of customer service lead to high costs, and low costs are usually accompanied by low levels of customer service. In practise, management chooses one of the two alter
natives to deal with the trade-off ; either tries to minimize inventory costs while attaining a customer service level specified by the company policies, or tries to maximize customer service level while setting a predefined cost level for inventories [3,4].
2.3. Steps in Developing an Inventory Control System :
There are eight basic steps in developing an effec tive inventory control system :
(i) Determination of the items to be carried in the inventory (this information should come from design and engineering of the products the organi zation will produce or distribute),
(ii) Determination of appropriate quantities of material to keep in inventory ( based on factors such as usage rates, material costs, delivery and production times, ordering costs, and the value of money invested in the inventory, the most economi cal order quantities will be determined in accor dance with organization's policies regarding ser vice levels and safety stocks),
(iii) Determination of replenishment policies (based on time required to record changes in the
inventory, the time between usage of inventory, the actual order processing time and the time elapsed between order placement and physical receipt),
(iv) Design and proper use of a system of inventory records,
(v) Receipt and storage of inventory, which is closely related to the record keeping system,
(vi) Verification of physical inventory by making actual counts continuously and/or periodically,
(vii) Identification and disposition of surplus inventory items based on predefined policies such as defining obsolescence or slow moving material,
(viii) Preparation of inventory reports for manage ment, which include actual performance of the
inventory compared with the plans and forecasts, total amount of money invested, their distribution, and so on [1].
2.4. Advantages :
An effective inventory control system will bring numerous advantages to an organization.These in clude the following :
- Improvement of customer relations through faster and more reliable delivery ( since records are available about the exact status of inventory ),
- Improvement of labor relations through a stable workforce, which produces not only to order, but also to inventory,
- Improvement of management effectiveness through letting them allocate more time to strategic issues rather than to operational ones,
- Reduction of overall costs by maintaining a balanced production,
- Reduction of procurement costs through decreasing number of orders for more economical lot sizes.
Reduction of overall inventory costs through improving inventory mix, maintaining a balance between inventory and purchased goods, and by levelling production,
- Minimization of inventory losses due to changes in market conditions, deterioration, pilferage and obsolescence,
through a reduction in number of physical inventor ies required and of backorders [1].
2.5. Requirements :
To be effective, an inventory management system should establish two basic systems, one to account for items in inventory and the other is to make decisions regarding how much and when to order. The latter requires information about demand forecasts, lead time and costs. Moreover, to allocate the money and effort spent on various items in the inventory, a classification system must be estab lished.
Inventory Accounting Systems j_ This system will help to keep track of the inventory on hand and on order. It can be periodic or continuous. Under a periodic system, a physical count of items in inventory is made at periodic intervals, such as weekly or monthly. An advantage of this system is that inventory levels of many items are seen at the same time and by placing only a single order, economies of scale can be achieved. However, there are also disadvantages of the system, such as lack of control between reviews, need to protect against shortages between review periods by carrying safety stock and need to make a decision on order quanti ties at each review.
Under a continuous or perpetual system on the other hand, withdrawals from inventory are kept track on a continuous basis, and when the amount on hand reaches a predefined minimum level, a fixed order quantity, Q is ordered. Continuous control of inventory and being able to define an economic order size are the advantages of this system, whereas the added costs of record keeping and physical count of inventories' still being per formed on a periodic basis (to justify records because of errors, spoilage, theft, etc.), are the disadvantages.
Demand Forecasts and Lead Time Data j. Inventories will be used to satisfy the demand, and thus, a system must be established to forecast the demand, the lead times involved and their variability. The greater the variability in demand and/or in lead time, the greater the need for safety stock to avoid stock-outs.
Cost Data j. As discussed in Section 1.1.4, inven tories involve procurement, carrying, stock-out and capacity related costs. Depending upon the relative importance of each and availability of data on each, inventory costs should be estimated to aid in decision of when and how much to purchase. Exper
iences of employees as well as managers will be helpful particularly to determine intangible cost components, such as loss of customer's goodwill.
Classification System j. Items kept in inventory are not of equal importance in terms of money invested, profit potential, sales or usage volume and stock out penalties. Thus, it will not make sense to devote equal attention to each of these items. In order to deal with this problem, an effective inventory management system should start with establishing a classification system which will highlight the items in inventory requiring special attention.
Most commonly used system is the ABC classifica tion, where items are categorized into classes with respect to annual dollar usage. The method will be described in detail in following sections [3].
3. METHODOLOGY
For the problem defined in Section 1.2, a two step solution is suggested :
(i) Updating the inventory item classification to make certain that these are items requiring to give special attention : Make a "classical” ABC classi fication based on annual dollar usage, and then extend the method via employing other criteria,
(ii) For the A items in the inventory, establish a decision system on when to order : Make a Reorder Point (ROP) analysis.
This section gives a detail description of ABC classification method, its extension, and ROP analysis [5].
3.1. ABC Classification Method :
3.1.1. Making ABC Classification :
ABC classification is the "one universal technique" for any company, large or small, and for any kind of manufacturing and service industry. This wide
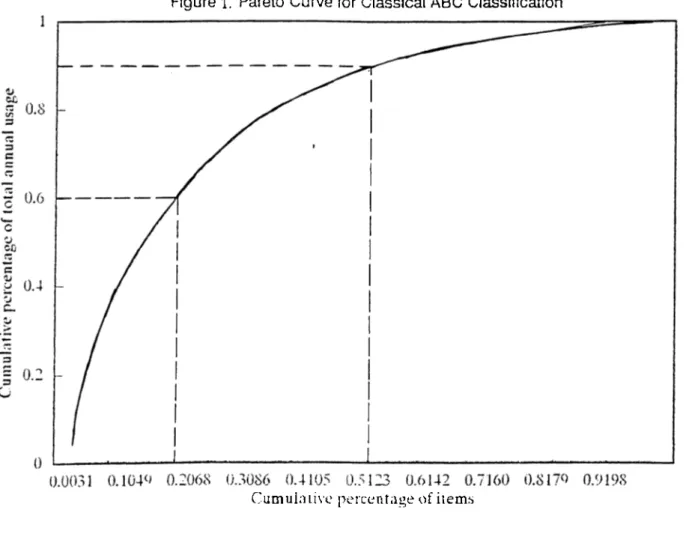
spread method for classifying and controlling inventory is based on the law of the Italian eco nomist Vincent Pareto. According to Pareto's Law :
"A small percentage of any group accounts for a large percentage of the value". It is also expres sed as the trivial the many and the significant the few.
As described above, the concept of classification of items is based on the fact that in inventories, a small number of goods often account for most of the demand and/or a small number of items purchased absorb most of the inventory budget. Thus, special attention should be paid to those items not only by applying modelling and optimization techniques, but also by maintaining accurate inventory records. Similarly, to items with low demand or small unit value less attention and to items with low demand and small unit value the least attention should be paid in terms of forecasting, planning and control. In other words, basic reason behind employing this method is to allocate the operating funds and managerial efforts to each item in inventory more efficiently.
The following steps show how the classification is made :
year),D and the present value of each stock keeping unit (s.k.u.),V.
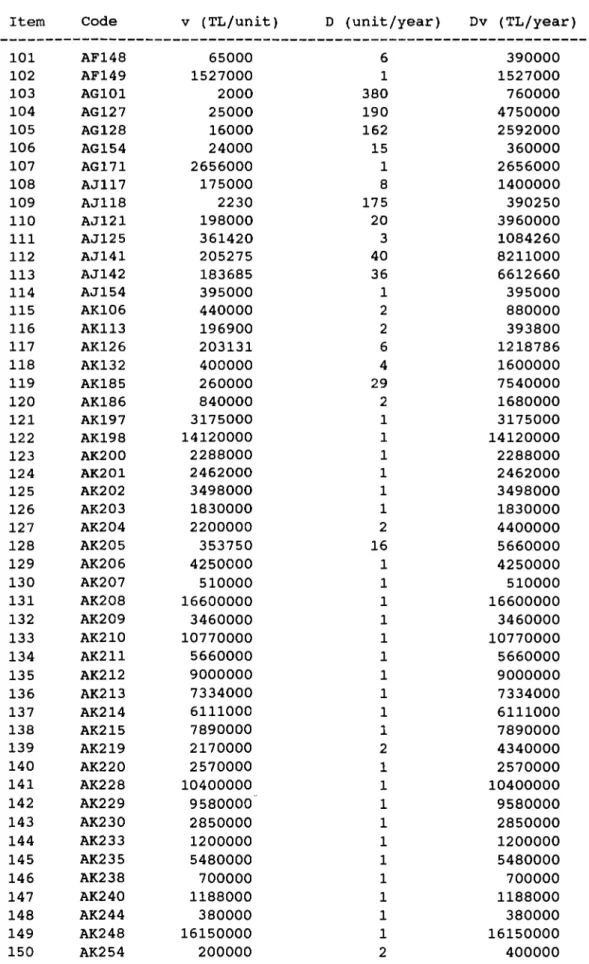
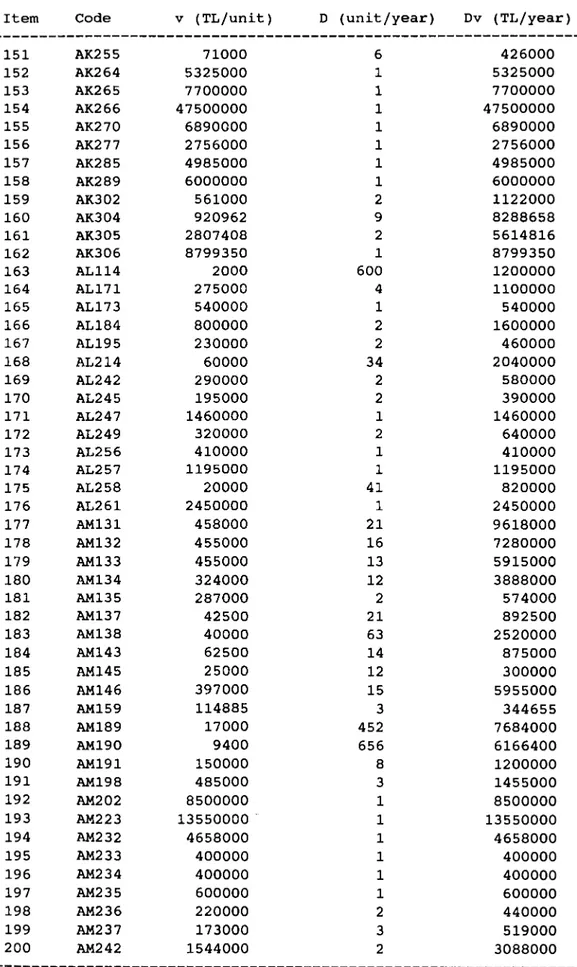
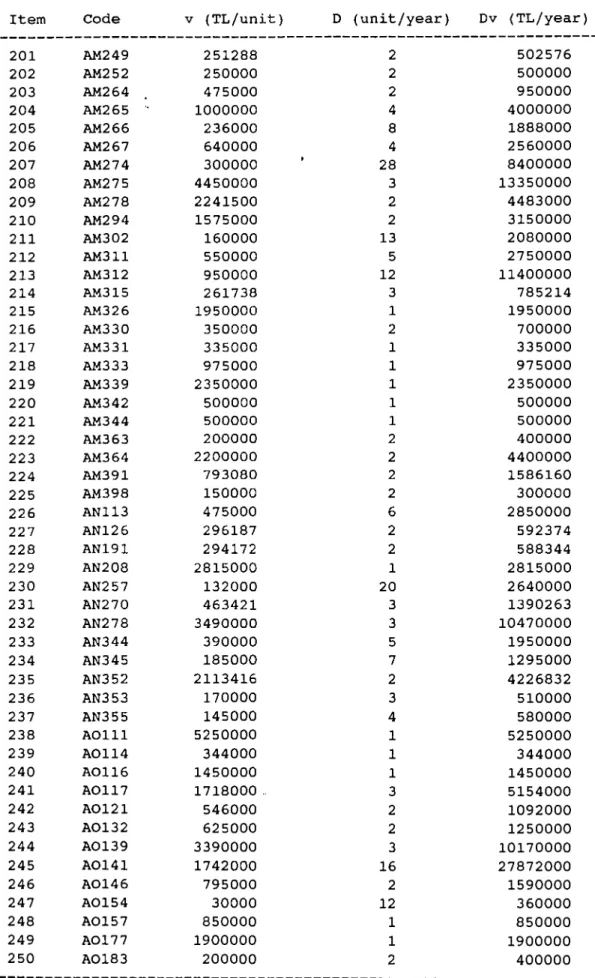
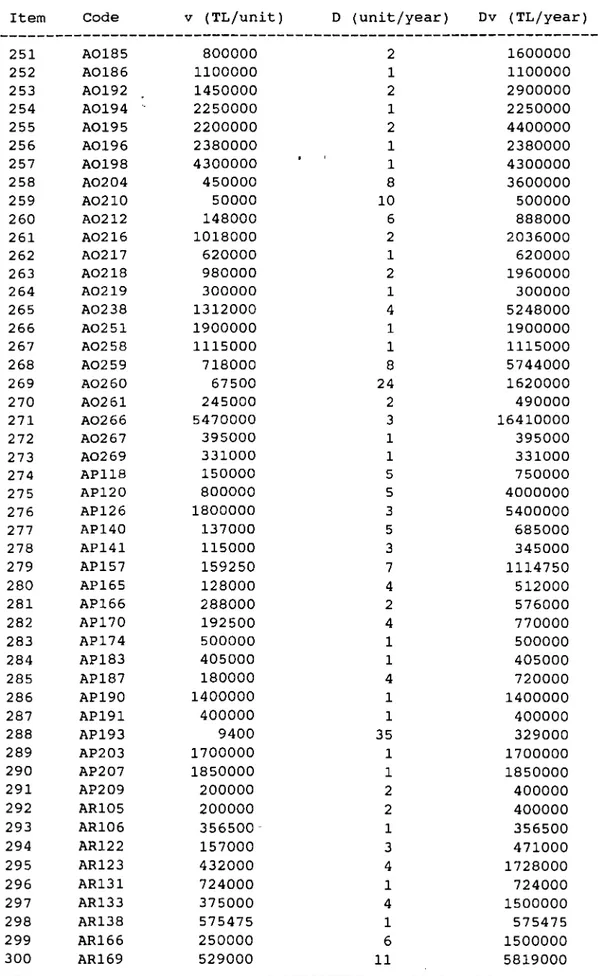
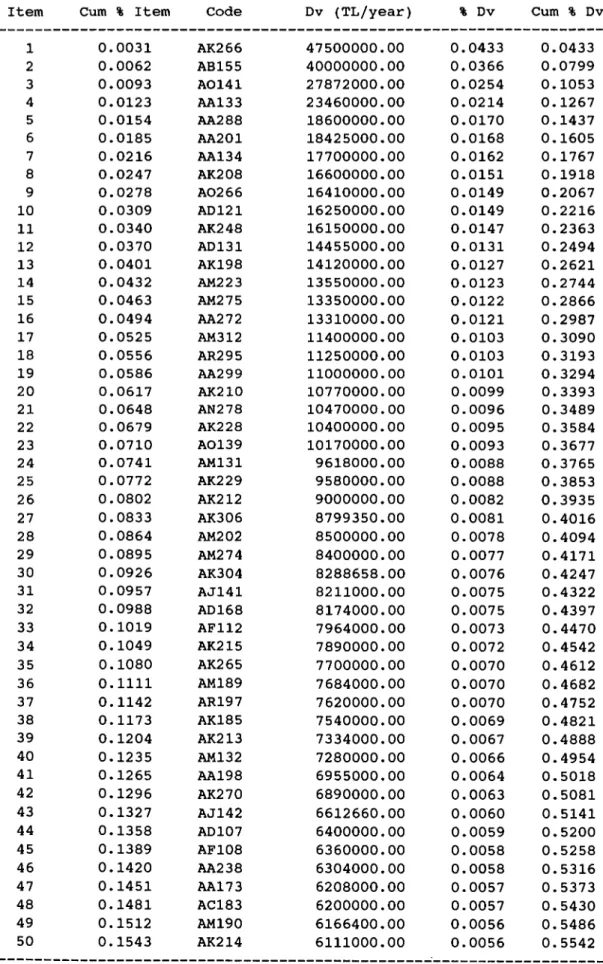
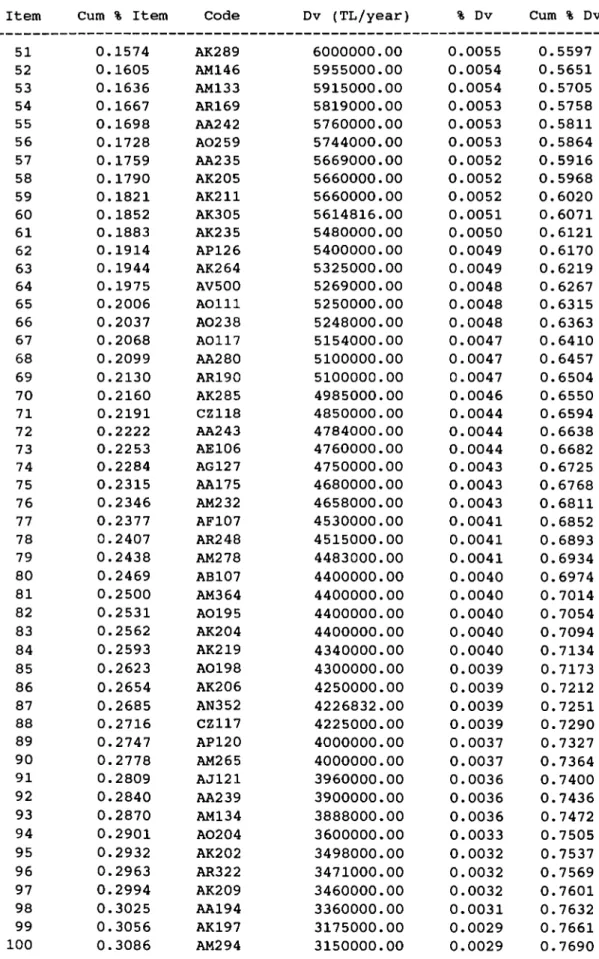
-Calculate total annual usage (Dv) for each s.k.u. by multiplying the quantity demanded in that period
(D), by the unit price of that item (v),
-Rank all these items in descending order of total annual usage value,
-Calculate percent annual usage value for each item ( % Dv ) and cumulative percent annual usage values ( Cum % Dv ),
-Split the array into three classes A, B and C and if desired D, with respect to cumulative percents ( Cum % Dv ).
Although these points can vary individual business' conditions.
according to each a common breakdown might be as follows : Class Percentage of items Percentage of total annual usage
A 5-15 50-60
B 20-30 25-40
In high technology industries, such as computer or aircraft production, class A tends to have a small percentage of items while producing a large share total annual sales. In retail shops on the other hand, there are numerous class A items. Industrial producers are in an intermediate position. Thus, there is no strict rule about the breakpoints ; they can also be determined on a judgmental basis.
Typically, class A is composed of items of prime importance with high demand and large unit value; class B of items of secondary importance with low demand or small unit value, and class C of items of the least importance with low demand and small unit value. Therefore, degree of control, and complexity of decision systems to be adapted to each, differ with respect to their relative importance.
It should be noted that three is a minimum number for classification : Depending upon the circum stances of the company and the degree to which it wishes to differentiate the amount of effort allo cated to various groups, number of classes can be increased. A fourth class, class D, can be added, which includes items with no transaction usage for some period of time. Class D items are also called as "dogs/dead items". Management may want to get rid of these items as quickly as possible if they
will serve no future purpose. As a rule of thumb, any item with no usage in the last six months should be classified as D, and no reordering should be permitted without special authorization.
Finally, it should be noted that there are other bases for classification such as annual warehouse space usage ( usage rate * cubic feet per unit ) and best-selling products ( profit * volume )
[ 1 , 4 , 5 , 6 , 7 , 8 ] .
3.1.2. An Extension of ABC Classification :
Sarai [9] discusses the extension of ABC analysis, where two further possibilities will be taken into account. One of them is the extension of ABC method to stock cumulation : Besides ranging and grouping on the basis of the value of material consumption, items will also be analyzed on the basis of yearly chronological standard values. Then, the results of the two analysis will be compared to provide useful information to management. The other possibility is the refinement of ABC analysis by modifying the categorization according to five aspects besides consumption value. These aspects are :
Conditions of supply.
Conditions of consumption. Storing conditions.
The link between goods / complementarity and possibility for substitution.
He states that categorization only on the basis of dollar usage value is rather mechanical and yields to erroneous results. Therefore, it should be modified according to the above conditional fac tors .
For each factor, a criteria for belonging to a class is established :
The first additional aspect is conditions of sup- £ly:
Criteria for belonging to group A : A long lead time (one year or more ) ; no possibility of sche duling; there is an obligatory minimum order and this quantity is much more than the whole annual demand of the company; there is a low reliability degree (50 to 75 %) of fulfilment of the orders in time.
Criteria of group B : There is a 90 - 360 day long lead time; there can be a quarterly scheduling (if order is placed a year ahead); the minimum quantity of order must not be more than the yearly demand; the reliability degree of fulfilment in time is
from 75 to 90 % .
Criteria of group C : The largest cycle of lead time is 90 days; there is not an obligatory minimum quantity to be ordered, or it is not important; there is a 90-100 % reliability degree of fulfil ment orders on time.
The second additional aspect is conditions of consumption. which is closely related to the char acteristics of supply : If there is a problem concerning supply, consumption becomes more impor tant.
Criteria of group A : There is a consumption of accidental character; demand can not be planned in advance.
Criteria of group B : There is periodical demand; planning of the demand and its volume are uncer tain.
Criteria of group C : Materials for continuous consumption belong to this group; there is a demand of deterministic character.
Third additional aspect is storing conditions :
treatment and storing; there is a bottleneck in warehouse capacity.
Criteria of group B : There is a limited capacity of storing.
Criteria of group C : There is no special criteria or warehouse limit.
The final aspect is possibility of substitution :
Criteria of group A : The item is very specific; there is no possibility for substitution; it com plements others (in its absence, the machine will not work).
Criteria of group B : Substitution is possible, but not economical; using it as complement is technic ally limited.
Criteria of group C : There is a variety of mater ials applied as complements; they can not be used to substitute for others.
Once these criteria are established, each item is assigned to a class depending upon the fitness to the criteria. Classification is rather subjective, but it is avoidable if criteria given can be enum erated.
Depending upon the group, every item becomes coded, aspect by aspect. The value of the point is :
3 if it belongs to group A, 2 if it belongs to group B, 1 if it belongs to group C.
Then, the task of manager is to give weights to each factor as well as to the dollar usage. For practical purposes, sum of weights will be 1.00.
Next, each item will get a weighted average : Sum of the results of multiplication of values and weights (This average will necessarily be between
1.00 and 3.00). Then, the items will be ranked in descending order of weighted averages.
Final categorization can be made according to certain ranges such as :
Class A from 2.51 to 3.00, Class B from 2.01 to 2.50, Class C from 1.00 to 2.00.
Such a detailed analysis will be preferred in case of a differentiated inventory control, where empha sis will be given upon the most profitable items.
The extension is advantageous, since experts must think over the above aspects one by one before using the computer, and thus, decision making will be promoted in an indirect way as well [9].
3.1.3. Control of A, B and C Class Items :
Control of Class A Items :
-Frequent evaluation of plans and forecasts for the class A items; inventory performance must be ex amined monthly or weekly,
-Tight control of inventory issuance, perhaps even a weekly physical inventory count,
-Records regarding payment must be updated on a daily basis,
-Purchasing department should concentrate on these items, since small percentage savings will have a large impact on overall costs.
Control of Class B Items :
-Regular evaluation of forecast and plan perfor mance,
-Regular, perhaps monthly or quarterly, physical inventory verification,
-Regular updating of material payment records,
-Purchasing department should pay some attention in accordance with its relatively lower value.
Control of Class C Items :
-Very loose control activities; the most important control activity is making sure that class C items are available,
-Simple records are acceptable; annual physical inventory counts will determine whether or not there is a need for reorder,
-Large safety stocks must be maintained, -Large order guantities must be maintained,
-Material must be stored so that it is readily and easily accessible [1,8].
3.1.4. Usage of the Classification System :
There are five ways to use the ABC classification system. One can use the classification in [5] :
(i) Determining acceptable accuracy levels:
DESCRIPTION INVENTORY CLASSIFICATION
A B C D
Importance Extremely Good Moderate Good
of accuracy (98%) (95%) (90%) (95%)
Assign clerks Yes Maybe No No
Inventory Daily Semi- Quarterly Yearly counting frequency monthly
Identification Monthly Quar- Semi- Quar of excess inventory terly annually terly
(ii) Approaching orders :
DESCRIPTION INVENTORY CLASSIFICATION
A B C D
Frequency of orders 24 12 4 None
Keep purchase price Yes Yes Yes No
Mark class on Yes Yes No No
purchase order
Month's supply on hand 1 2 4
-Turnover target 12 6 3
-(times per year)
(iii) Deciding on when to order : Choose a that complements your inventory system
DESCRIPTION INVENTORY CLASSIFICATION
method
A B C D
Safety stock 1 week 2 weeks 1 month N/A Record review Daily Monthly Quarterly
(iv) Deciding on how much to order :
DESCRIPTION INVENTORY CLASSIFICATION
B D
Provide demand Yes Yes forecasts to vendor
Review of order Every Spot decision requisition check
No No
None Every requisition
(v) Determining the warehouse location :
DESCRIPTION INVENTORY CLASSIFICATION
B D
Location Near in warehouse door Specific Random bin locations
Middle Distant Most dis- area area tant area Random Fixed by Fixed by
part number part number
3.2. Reorder Point (ROP) Method :
3.2.1. Definition :
A Reorder Point means that when the quantity of on item on hand in inventory goes below a predeter mined level (called as "Reorder Point/ROP/the mini
mum
"),
a replenishment order is placed (at the "Reorder Quantity") with delivery requested at a specific date using the manufacturing or vendor stated lead time.ROP is a statistical inventory control technique answering the question of "when to order". The method is based on an individual part/single item having independent demand and a continuous usage/sales rate in the near future [5].
3.2.2. Types of Techniques :
There are various inventory techniques of ROP :
(i) Visual : Recordless, Periodic Review :
-Stock-out : When none is there, order more,
-Replenishment : Whatever you use, request more of same,
-Minimum/maximum : If at min, order up to max,
-Mark on Wall of Bin : If below the line, reorder, -Two Bin Reserve : When first one empty, send a requisition,
-Cycle : Once a week (month), reorder as needed.
(ii) Written Record : Periodic or Perpetual Review:
-Replenishment : Whatever you use, request more of same,
-Minimum/maximum : If at min, order up to max,
-ABC Cycle : Review A items daily, B weekly, C monthly,
-Reorder Point : Set a review level, then requisi tion when below,
-Statistical Order Point ; At a calculated reorder quantity, get more,
-Phased Order Point : Key need to a calender sche dule,
-Kanban : Use of Japanese method of card ordering.
For this study, the "written. Reorder Point" tech nique will be used where a review level will be set, and then requisition will take place, when inventory on hand drops below that level [5,8].
3.2.3. Choice of a ROP Model :
It is common to choose an inventory control model for items based on the variability of their demand rate during lead time : For "fast moving items", which have high volume lead time demand, it is assumed that their sales rate follows approximately the continuous Normal probability distribution. However, for "slow moving items", which sell only, say five or six units a year, a similar assumption
of continuity may lead to significant errors. Therefore, it is assumed that these slow moving items follow some other probability distribution ; Class A items follow Poisson or Laplace distribu tion, others Laplace distribution.
The boundary between fast and slow moving items is given by the value of the average (forecast) demand over a replenishment time, i.e. by xLTD. Empirical tests have indicated that xLTD > 10 units will be referred as "fast moving items", and items with xLTD < 10 units as "slow moving items" [10].
In this study, reorder point analysis will be made for class A items. Next section discusses choice of a model for A items.
3.2.4. Choice of a ROP Model for A Items :
In order to choose a ROP model for A items, first items should be splitted into two as fast movers and slow movers based on their xLTD values. The boundary between the two tiers will be 10 units as mentioned above.
For fast moving A items. Normal probability distri bution will be recommended and the model discussed in Section 3.2.5 will be applied.
The model for slow moving A items will be decided on the probability distribution of the lead time demand. The standard deviation of forecast errors over the lead time period, aLTD will be used in determining the respective distribution.
Use a Poisson model,
if 0.9 * (XLTD)^ < ctLTD < 1.1 * (xLTD)^ Use a Laplace model,
if aLTD falls outside (1 ± 0.1) * (xLTD)
These two models will be discussed in Section 3.2.6. A flowchart is provided in Appendix A to summary which model to use in finding the reorder point.
3.2.5. Models for Fast Moving A Items :
In determining ROP for fast moving A items. Normal probability distribution models will be used.
Four ROP models under different situations will occur as outlined in the following subsections.
3.2.5.1. Required Information :
The formulas to calculate the Reorder Point re quire the following bits of information :
-Actual/expected/average length of lead time (LT), -Average quantity used in recent times or forecas ted usage per unit time (d),
-The extent of lead time and demand variability (aLT and ad),
-Service level (percent of times the inventory will be on shelf/in stock to meet customer's require ments) or degree of stock-out risk acceptable to management ( Service level + stock out risk = 100 percent ) [3,5].
3.2.5.2. Different Cases :
Depending upon the demand and lead time informa tion, there are different ROP models for these four cases :
(i) Constant demand rate, constant lead time, (ii) Variable demand rate, constant lead time, (iii) Constant demand rate, variable lead time
(iv) Variable demand rate and variable lead time.
The following notation is used in these models :
Demand : d = constant demand rate, d = average demand rate,
ad = standard deviation of demand rate. Lead time : LT = constant lead time.
LT = average lead time,
aLT = standard deviation of lead time.
In the first case, when both demand (usage) rate and lead time are constant, there is no stock-out risk, and thus, no need for buffer stock. Reorder point, s is simply equal to the product of usage rate times lead time :
s = d * LT
In the other cases however, where demand rates and/or lead times are variable, there is a need for cushion stock : Variations in demand rate can result in a temporary increase in demand, which will use up inventory faster than expected, and variations in lead time can result in a temporary increase in lead time, during which inventory on hand will be inadequate to meet the demand. A cushion stock will be carried to reduce the risk of stock-out during the lead time period. This stock, which is held in excess of expected demand is called as buffer or safety stock (SS).
On one hand safety stock decreases the risk of stock-outs, and on the other increases inventory carrying costs. To deal with this trade-off, man agement sets a service level. which is the prob ability that demand will not exceed supply during
lead time ( i.e., that the amount of stock on hand will be sufficient to meet the demand). By defini tion, the risk of stock-out is the complement of customer service level :
Service level = 100 percent - Stock-out risk
The amount of safety stock depends on the following factors : Average demand rate (3^) and average lead time (LT), demand and lead time variabilities (aLT* and ad^) and the desired service level.
In the second case, where demand rate is variable and lead time is constant, the ROP model becomes ;
s = ' d * L T + z * a d * VLT
In the third case, where demand rate is constant and lead time is variable, the ROP model becomes :
s = d * L T + z * d * aLT
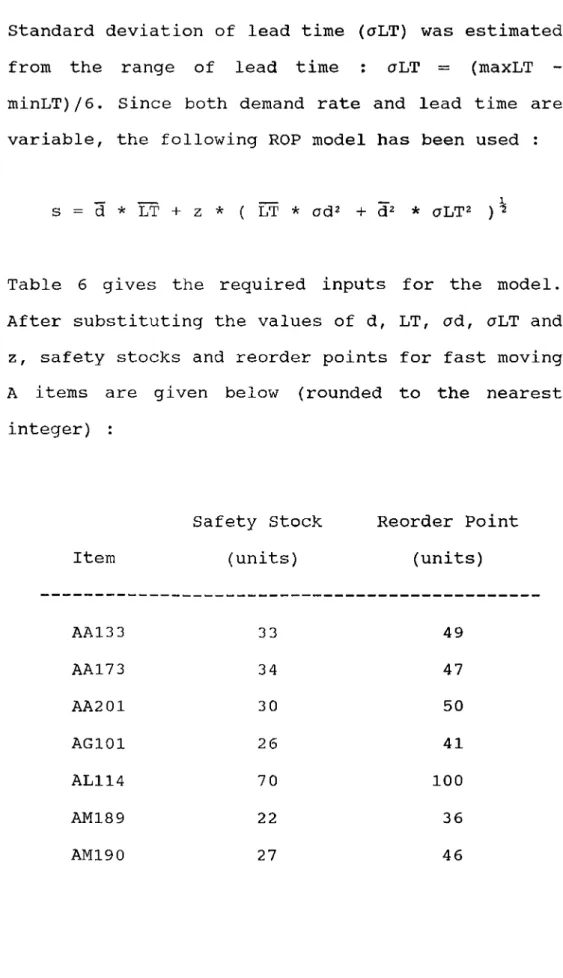
In the fourth case, which is the most general case where both demand rate and lead time are variable, the ROP formula is as follows :
s = d * L T + z * ( L T * a d 2
+
*
aLT^ ) ^In all of the cases, second term in the equation gives the safety stock level,SS [3].
3.2.6. Models for Slow Moving A Items :
In modelling for determination of ROP for slow moving A items, Poisson or Laplace models will be used depending upon the magnitude of standard deviation of lead time demand. These two models are discussed in the following subsections.
3.2.6.1. Poisson Models :
Poisson models are appropriate when the actually observed aLTD for the item under consideration is quite close to (xLTD)"^, that is, if ctLT is within
X,
10 percent of (xLTD)·^. The discreteness of Poisson distribution causes difficulties in obtaining an operational decision rule. However, in one situa tion where the replenishment quantity,Q is one, a simple decision rule can be used :
Ppo ( s+1 I xLTD ) r
( xLTD )^° * exp(-xLTD) where Ppo ( x° | xLTD ) =
---x° ! for x°= 0,1,2,... Ppo ( s+1 I xLTD ) = probability that a Poisson variable with mean xLTD takes on the value s+1.
Ppo< ( s+1 I xLTD ) = probability that a Poisson variable with mean xLTD takes on a value less than or equal to s+1.
r = carrying charge, the cost of having one TL of the item tied up in inventory for a unit time interval (normally one year)
(TL/TL/unit time).
D = demand rate (units/unit time).
B = the fraction of unit value charged per unit short.
xLTD = average (forecast) demand in a replenishment lead time.
In our case, r, D, B and xLTD values are known or can be estimated. Thus, after substituting these values in the above formula, the reorder point,s can be obtained by trial and error.
Derivation of this formula is given in Appendix B. The assumptions behind the derivation of this decision rule are :
(i) Continuous review, use of reorder point, order quantity system with Q=l.
(ii) Poisson demand.
(iii) The replenishment lead time is a constant LT time periods or follows a probability distribution and its expected value, LT is known.
(iv) There is a complete backordering of demands when out of stock.
(v) There is a fixed fraction,B of the unit value,v charged for each unit backordered.
To be able to set Q = 1, one condition regarding the demand rate (D) and unit variable cost (v) should be satisfied :
If D < 0.0763 * V, then Q = 1.
In case this condition does not hold, replenishment quantity will be greater than one, and for this more general case, the following formula will be used :
S Ppo ( s + j I xLTD ) D ~ 1t · · i Q 2 Ppo< (s + j I xLTD ) r ‘ · r Q D * B where
Ppo (x° I xLTD) = probability that a Poisson variable with mean xLTD takes on the value x°.
Ppo < (x° I xLTD) = probability that the same variable takes on a value less than or equal to x°. Q = prespecified order or replenishment quantity
(units).
The reorder point, s will be found by trial and error, after insertinq the values of r, D, B, xLTD and Q.
3.2.6.2. Laplace Models ;
If aLTD is outside 10 percent of (xLTD) , then Laplace models will be used to determine the reor der point,s. In every decision rule, reorder point is a function of expected demand rate during the replenishment lead time and a safety stock. In that section ROP was found by demand rate and the lead time data, and here, ROP is being calculated through the use of lead time demand data, which are
nothing but the different representations of the same information. Thus, even though notations have changed, basic concepts like service level, are the same.
In Laplace models, reorder point,s will be deter mined after calculating the safety factor,k. The value of k is a function of service level described
in Section 3.2.5.
Pu>(k) = 1 - Service level
where Pu>(k) = probability that standard normal variate,z takes on a value of k or larger.
Laplace models suggest finding the safety factor k from the formula below :
1 D * B
where k = -- * I n ---V2 2 * Q * r
Then, after calculating k, it will be substituted in the model below to compute a reorder point,s :
s = xLTD + k * ctLTD
The potential problem in this case, is the determi nation of the order quantity, Q. Since exact value of Q is not known, it will be prespecified using managerial judgment [10].
4. AN APPLICATION : OZALTIN CONSTRUCTION AND TRADING CO.
This study aims to improve inventory management system in Ozaltin Construction and Trade Co. through the use of a classification technique (an extension of ABC classification) and of a decision system on when to order (reorder point calcula tions) .
4.1. Current Situation in the Firm :
As mentioned in Chapter 1, the firm is in dam construction business and is struggling with ser ious inventory management problems arising from the penalties stemming from failure to finish the job on time and the lack of systematic control techni ques .
The inventories at the firm can be grouped as spare parts of machines and other supplies. The first category is much more crucial in terms of substi tutability, supply conditions and TL usage. Expen ditures made on spare parts constitute 80 % of all inventory spending (on the average 250,000,000 -300,000,000 TL per month). These are supplied
domestically (from Ankara and in some cases from Diyarbakir) or imported from abroad. Depending upon the type of item and supply conditions, lead time varies from a few days to three months. For in stance, if the item needs to be produced specially for the firm, lead time is at least one month.
An order is placed whenever a part is brokendown or whenever there is a probability of a breakdown (i.e. the expert observes a wear and decides to replace the part before expected useful life/physi- cal breakdown). In case of stock-out of that part, an order is placed. Besides these periodic and/or ad hoc observations, a physical inventory count is made once a year. All the inventory management decisions are made by "a person" on a judgmental basis.
Currently, the inventories of the firm to be used in the construction business are grouped under 56 heading (Table 1) . Each group consists of various number of items (Table 1 under column named COUNT). There is a total of 5273 items in the inventory, which is obviously a big number to trace solely by judgment.
4.2. Sample and Data Collection :
other supplies in terms of spending (four times more) and less probability of being substitutable. Thus, the study has given more emphasis to this category.
Data collection started with going over the items in inventory in terms of annual TL usage (In this case, a work year corresponds to a period of five to six months due to the bad weather conditions in Eastern part of Turkey ; work is interrupted in winter) . After the first run, it turned out that out of the 2573 items (Table 1 Group no 1-19), 1946 items had no transaction usage for one year. Thus these were discarded as being the "dead items" (class D mentioned above) : After going over these items one by one, management may want to get rid of them, if they conclude that these will serve no future purpose.
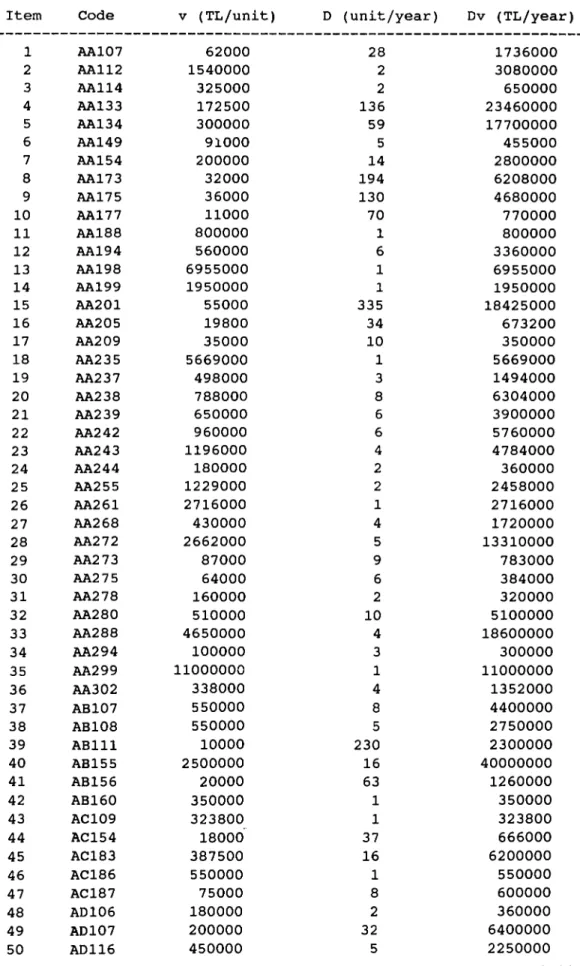
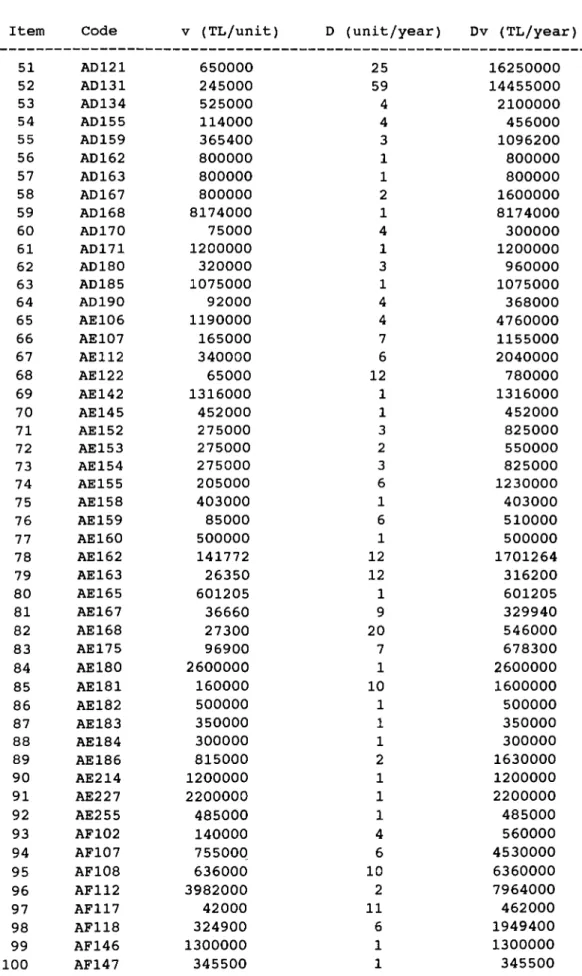
A second elimination is made by discarding the items, whose annual TL usage were insignificant (less than 0.0001 % of the total annual TL usage). Thus the study will concentrate on the remaining 324 items, which really require attention (Table 2). These items are all machine spare parts having a total annual TL usage of 1,115,471,052 TL. In the rest of the text, they will be referred by their group code for practical purposes.