Pamukkale Univ Muh Bilim Derg, 24(5), 864-869, 2018
Pamukkale Üniversitesi Mühendislik Bilimleri Dergisi
Pamukkale University Journal of Engineering Sciences
864
A collective learning approach for semi-supervised data classification
Yarı-gözetimli veri sınıflandırma için kolektif bir öğrenme yaklaşımı
Nur UYLAŞ SATI1*1Bodrum Vocational School of Maritime, Muğla Sıtkı Koçman University, Muğla, Turkey.
Received/Geliş Tarihi: 09.08.2017, Accepted/Kabul Tarihi: 31.10.2017
* Corresponding author/Yazışılan Yazar Research Article/doi: 10.5505/pajes.2017.44341 Araştırma Makalesi
Abstract Öz
Semi-supervised data classification is one of significant field of study in machine learning and data mining since it deals with datasets which consists both a few labeled and many unlabeled data. The researchers have interest in this field because in real life most of the datasets have this feature. In this paper we suggest a collective method for solving semi-supervised data classification problems. Examples in R1 presented
and solved to gain a clear understanding. For comparison between state of art methods, well-known machine learning tool WEKA is used. Experiments are made on real-world datasets provided in UCI dataset repository. Results are shown in tables in terms of testing accuracies by use of ten fold cross validation.
Yarı-gözetimli veri sınıflandırma, makine öğrenme ve veri madenciliğinde önemli bir çalışma alanıdır çünkü az sayıda etiketli ve çok sayıda etiketsiz veri içeren veri kümeleri ile ilgilenmektedir. Gerçek hayat veri kümelerinin çoğu bu özelliği taşıdığından birçok araştırmacı bu alana ilgi duymaktadır. Bu makalede yarı-gözetimli veri sınıflandırma problemlerinin çözümü için kolektif bir yöntem önerilmiştir. Konuyu daha iyi anlamak için R1 de tanımlı veri kümeleri
oluşturup önerilen algoritmalar bu veri kümelerine uygulanmıştır. Gelişkin tekniklerle karşılaştırma yapmak için en iyi bilinen WEKA makine öğrenme programı kullanılmıştır. Çalışmalar UCI veri kümesi deposunda bulunan gerçek hayat veri kümeleri üzerinde uygulanmıştır. 10 katlı çapraz geçerlilik ölçütü kullanılarak elde edilen değerlendirme sonuçları tablolarda sunulmuştur.
Keywords: Semi- Supervised data classification, Clustering method,
Supervised data classification, Machine learning, Mathematical programming
Anahtar kelimeler: Yarı-gözetimli veri sınıflandırma, Kümeleme
yöntemi, Gözetimli veri sınıflandırma, Makine öğrenme, Matematiksel programlama
1 Introduction
In recent years with the increasing availability of data, classification, a method of data mining, is studied by many researchers enourmously. Data classification is creation of a specific recognition system that uses a training set selected from a specific dataset. If this specific dataset consists of unknown labeled data, the process is called unsupervised; if it consists of known labeled data, it is called supervised; and if it consists of both known and unknown labeled data, it is called semi-supervised data classification.
Semi-supervised classification techniques can be thought as a compromise between unsupervised and supervised techniques and it aims to utilize from both of them. Much used semi supervised learning methods can be alined as self-training, co-self-training, transductive support vector machines, and graph-based methods.
Self training is a wrapper method around a supervised classifier. To apply self-training, for each instance x to be classified, besides its predicted class label, the classifier must be able to output a certainty score, i.e., an estimation of how likely the predicted class label is correct [1]. Combination of active learning and self-training for cross-lingual sentiment classification with density analysis of unlabelled samples are studied by Hajmohammadi et. al. [2]. Also different applications of this method are presented by Chinaei [3] and Kanga et. al. [4]. Transductive support vector machines (TSVMs) use each labeled and unlabeled data in training phase and it searches a reliable separating hyperplane. This method is used and examined by Bruzzone et. al. [5] and Ordin [6]. In
co-training, proposed by Blum and Mitchell in 1998, two classifiers are trained. It uses the predicitons of each classifier on unlabeled examples to augment the training set of the other [7]. Graph based methods use nodes and edges to model the whole dataset as a graph. Nodes represents labeled and unlabeled datasets and edges defines the similarities between points. These methods fundamentally predicts a function on the graph such that it should be close to the given labels on the labeled examples, and also it should be smooth on the whole graph [8].
Supervised data classification is studied by various researches and lots of different approaches and methods have beeen presented for solving supervised data classification problems. In this paper, we use various supervised classification algorithms defined in Waikato Environment Knowledge Analysis WEKA program as Naive Bayes, Logistics, Classification via Regression, Decision table and Decision trees. A brief information about the used algorithms is given in Section 2 and a detailed one is presented by Alpaydın [9] and Frank et. al. [10].
Unsupervised data classification also known as clustering, deals with the problem of organization of a collection of objects into clusters based on similarity. One of our approach that we suggest for semi-supervised data classification in this paper is a combination of unsupervised and supervised classification technique. We use clustering method just for specifying the center points of clusters. We prefer to use k-means method as a clustering method since it is the most preferred one. This method will be explained in the next
Pamukkale Univ Muh Bilim Derg, 24(5), 864-869, 2018 N. Uylas Satı
865 section. More detailed information about clustering and
k-means method is proposed by Bagirov et. al.[11].
In section 2, suggested algorithm for semi-supervised data classification is defined also different approaches for the initilization of the algorithm are discussed. Instructions are given to understand why we prefer these approaches. Brief explanations about supervised classification algorithms that will be used after initilization are presented. In section 3, ordinary datasets in R1 are generated and applied to defined algorithm’s different approaches for a clear understanding. Besides for comparison, experiments are made on real-world datasets via state of art methods provided in WEKA. Obtained evaluation results are presented by use of ten-fold cross validation. Finally in section 4 we conclude the paper.
2 Matherial and method
In semi-supervised data classification, the aim is to benefit from both labeled and unlabeled data during the learning process. Learning from labeled data is called supervised learning and learning from unlabeled data is called unsupervised learning.
In this paper, we aim to transform the semi-supervised data classification problem to a supervised one since various methods have been defined for supervised learning. In accordance with this purpose, center points of the classes are aimed to be found by using the labeled points. We use two methods for finding them.
Suppose that we are given labeled A, B and unlabeled C sets 𝐴 = {𝑎𝑖∈ 𝑅𝑛, 𝑖 ∈ 𝐼}, 𝐵 = {𝑏𝑗∈ 𝑅𝑛, 𝑗 ∈ 𝐽}, 𝐶 = {𝑐𝑡∈ 𝑅𝑛, 𝑡 ∈ 𝑇} where 𝐼 = {1, … 𝑚}, 𝐽 = {1, … 𝑝}, 𝑇 = {1, … 𝑡} in a semi-supervised data classification problem.
We suggest three approaches for finding the center points of given A and B datasets in the below subsections.
2.1 k-means method (first approach)
In the first approach, we experienced commonly used k-means clustering method on labeled data for determining the center points of the classes. Actually k-means method is an unsupervised method whose goal is to partition the unlabeled dataset into k parts in terms of the similarities. But in our experiment we use it just for finding the center points of the labeled datasets. Since we make binary classification we imply k-means algorithm on two datasets (A and B ) individually. Algorithm 1. k-means algorithm
k-means algorithm is given as follows [12]:
Step 1. Choose a seed solution consisting of k centers (not necessarily belonging to A),
Step 2. Allocate data points to its closest center and obtain k-partition of A,
Step 3. Recompute centers for this new partition and go to Step 2 until no more data points change cluster. After obtaining 2𝑘 center points by use of k-means algorithm. We calculate all distances between unlabeled points and each center points. The closest center points’ class is given to the unlabeled one. This approach requires 𝑡(2𝑘) iterations after finding center points.
2.2 Mean method (second approach)
In the second approach, we use mean points of labeled A and B
datasets as center points.
Suppose that we are given A and B classes, consisting of respectively m and p n dimensional vectors. Calculation of mean points can be given as (1) and (2):
Center point of 𝐴 = 𝑎1, 𝑎2, … , 𝑎𝑛), such that 𝑎𝑘=
∑𝑚𝑖=1𝑎𝑘𝑖
𝑚 , 𝑘 = 1, … , 𝑛 (1)
Center point of 𝐵 = 𝑏1, 𝑏2, … , 𝑏𝑛) , such that 𝑏𝑘=
∑𝑝𝑖=1𝑏𝑘𝑖
𝑝 , 𝑘 = 1, … , 𝑛 (2)
After calculation of mean points, we calculate all distances between unlabeled points and obtained two center points. The closest center points’ class is given to the unlabeled one. This approach requires 2𝑡iterations after finding center points.
2.3 Calculating all distances (third approach)
In the third approach, different from other two approaches, by thinking so basicly, we dont find any center point. We calculate all distances between unlabeled point and every labeled point. Unlabeled point is labeled with the closest labeled points’ class. This approach requires 𝑡(𝑚 + 𝑝) iterations such that 𝑡, 𝑚, 𝑝 is respectively the number of unlabeled points, points of A and points of B. We dont experiment this approach since it is not so effective in terms of running time for large datasets.
2.4 A collective algorithm for semi-supervised data classification
Here if we contrast given three aproaches in terms of number of iterations in a sense running time of labeling the unlabeled points process, the third one is not so effective in large datasets. Such that 𝑡(𝑚 + 𝑝) > 𝑡(2𝑘) and 𝑡(𝑚 + 𝑝) > 2𝑡 where k (defined cluster number in k-means method) is less than m (number of points in A) and p (number of points in
B).
From this point of view, second approach looks more effective but it shouldn’t be forgotten that the given iteration numbers are calculated after finding the center points. That is to say here the elapsed time during the process of finding centers is so important.
When we contrast the first and second approaches, in the second one by determining the number of clusters before implying k-means method, we can obtain more effective results by using two or more center points for each classes, and also it should not be forgotten that in the use of clustering method both distance metric and number of clusters (here we call them center points) can be determined by the experimenter in terms of the structure of the data.
In this paper, we experiment both approaches in initilization of the semi-supervised algorithm given below.
Algorithm 2: A collective semi-supervised data classification
algorithm via clustering and supervised data classification methods.
Suppose that we are given labeled A, B and unlabeled C sets including m, p and t n-dimensional vectors, respectively:
Pamukkale Univ Muh Bilim Derg, 24(5), 864-869, 2018 N. Uylas Satı
866 𝐴 = {𝑎𝑖∈ 𝑅𝑛, 𝑖 ∈ 𝐼}, 𝐵 = {𝑏𝑗∈ 𝑅𝑛, 𝑗 ∈ 𝐽}, 𝐶 = {𝑐𝑡∈ 𝑅𝑛, 𝑡 ∈ 𝑇}
where 𝐼 = {1, … 𝑚}, 𝐽 = {1, … 𝑝}, 𝑇 = {1, … 𝑡}.
Step 0 (Initilization): Find center points of A and B datasets via one of suggested approaches.
Step 1. Assign each C point to the closest center points’ class. Use Euclidian distance for calculations as in (3):
𝑑(𝑝𝑠𝑘𝑙, 𝑐𝑡𝑙) = √∑((𝑝𝑖)𝑠𝑘𝑙− (𝑐𝑖)𝑡𝑙)2 𝑛
𝑖=1
, (3)
Where, 𝑘𝑙 = {1, … 𝑘}, 𝑠 = {𝐴, 𝐵}, 𝑡𝑙 = {1, … , 𝑡}. Here, k is the number of center points that’s determined by the experimenter before implying clustering method. If second approach (mean) is used in initilization, k is assumed to be 1. Step 2. Redetermine both A and B sets in accordance
with new labeled points of C set,
Step 3. Apply a supervised data classification algorithm by use of redetermined A and B
datasets as training set,
Step 4. Define the obtained function or model that separates the sets A and B and STOP.
In Algorithm 2, selection of supervised data classification is left to the discretion of the experimenter. In the numerical experiments given in the next section various supervised data classification methods from WEKA are used. Brief explanation about used supervised data classification methods can be given as follows:
Naive Bayes: Bayesian classifiers assign the most likely class
to a given point described by its feature vector. The probability of X point being in class C is computed as equation (4):
𝑃(𝑋|𝐶) = ∏ (𝑋𝑖|𝐶) 𝑛
𝑖=1 (4)
Where 𝑋 = (𝑋1, … , 𝑋𝑛) [13].
Logistics: Logistic regression is an alternative method to the
Linear Discriminant Analysis that generates classifier functions to separate two or more groups by minimizing the misclassification cost. Logistic regression method has fewer assumptions than linear discriminant models. Logistic regression model with maximum likelihood estimators is preferred for solving problems under nonnormality [14],[15].
Classification via Regression: It uses regression methods for
classification. Class is binarized and one regression model is built for each class value [16].
Decision Table: It uses a simple decision table majority
classifier [17].
WEKA-J48: It is a Weka implementation of the C4.5 pruned
decision tree [18].
In the next section, numerical experiments will be presented on Algorithm 2 via suggested approaches.
3 Numerical experiments
In this section of the paper, for a clear understanding, we solved semi-supervised data classification problems in one dimensional space by implementation of Algorithm 2 with
different supervised data classification methods and different initilization approaches that we disscussed in section 2. In the second part of this section we imply the suggested algorithm on real- world datasets to see the efficieny in large datasets. Besides for comparison we present the state of art methods’ results on the same datasets. We use MATLAB and Weka Program in implementation and we experiment Naive Bayes, Logistics, Classification via Regression, Decision table and J48 methods that we explained in section 2 as supervised data classification methods.
In testing phase Ten-fold cross validation is used. It is explained as follows in [19]; the dataset D is randomly separated into 10 heterogenous subsets (the folds) 𝐷1, 𝐷2, . . , 𝐷10 of roughly equal size. The inducer is trained and tested 10 times; each time, it is trained on 𝐷\𝐷2 and tested on 𝐷𝑡.
3.1 Experiments via generated datasets
We generate datasets defined in 𝑅1 for the experiments.
Example 1: Let labeled A, B and unlabeled C sets in 𝑅1are
given as follows:
𝐴 = {0,1,2,3,4}; 𝐵 = {11,12,13,14,15}; 𝐶 = {5,6,7,8,9,10}
We apply the first approach (k-means) in initilization of Algorithm 2. “k “ (number of clusters) is defined as 2. Obtained results are given as follows:
First cp (center point) of 𝐴 = 3; Second cp (center point) of 𝐴 = 0,5; First cp (center point) of 𝐵 = 14; Second cp (center point) of 𝐵 = 11,5.
Redetermined A and B sets in step 2 of Algorithm 2 are given as follows:
𝐴 = {0,1,2,3,4,5,6,7}; 𝐵 = {11,12,13,14,15,8,9,10}.
Besides, in initilization of Algorithm 2, we use the second approach (mean) we disscussed in section 2 for finding center points. Obtained center points are given as follows by calculating the mean value of points in each class (A and B ):
Mean value(Cp(center point)) of points in 𝐴 = 2; Mean value of points in 𝐵 = 13.
We assign each C point to the closest center points’ class. Redetermined A and B sets according to labels of C points (step 1 of algorithm 2) are given as follows:
𝐴 = {0,1,2,3,4,5,6,7}; 𝐵 = {11,12,13,14,15,8,9,10}. Since the obtained A and B datasets after labeling the unknown ones are the same for each approach, we don’t apply Supervised data classification methods for each individually. We use redetermined A and B datasets as training set in the supervised methods. Obtained evaluation results by use of ten-fold cross validation is given in Table 1.
In terms of the results in Table 1, it is seen that, in little datasets that can be separated with a linear separator, both first and second approaches (mean, clustering) for finding center points doesn’t differ from each other such that redetermined A and B sets are the same in each approach. Also running times doesn’t differ from each other since the dataset is not so large.
Pamukkale Univ Muh Bilim Derg, 24(5), 864-869, 2018 N. Uylas Satı
867 Table 1: Results of supervised data classification methods on
example 1.
Methods Testing Accuracy
Naive bayes 93.75 Logistics 87.5 Classification via Regression 93.75 Decision table 93.75 WEKA-J48 93.75
Example 2: Let labeled A, B and unlabeled C sets in 𝑅1 are
given as follows:
𝐴 = {0,1,2,3,11,12,13,14}; 𝐵 = {8,9,10,17,18,19}; 𝐶 = {4,5,6,7,15,16,20}.
We apply k-means clustering method for initilization in Algorithm 2. “k ” (number of clusters) is defined as 2. Obtained results are given as follows:
First cp (center point) of 𝐴 = 12.5; Second cp of 𝐴 = 1.5; First cp of 𝐵 = 18; Second cp of 𝐵 = 9.
Redetermined A and B sets in step 2 of Algorithm 2 are given as follows:
𝐴 = {0,1,2,3,11,12,13,14,4,5,15}; 𝐵 = {8,9,10,17,18, 19, 6, 7, 16, 20}.
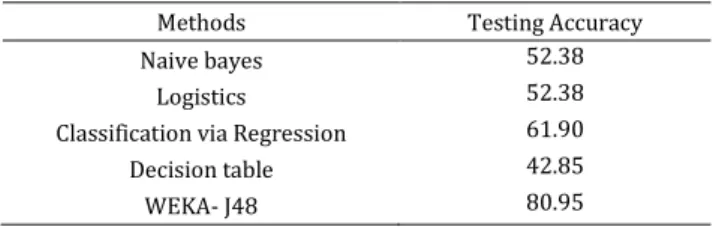
Obtained ten-fold cross validation results, after implementing supervised data classification methods on A and B datasets, are given in Table 2.
Table 2: Results of supervised data classification methods on redetermined datasets after second approach (k-means) in
example 2.
Methods Testing Accuracy Naive bayes 52.38
Logistics 52.38 Classification via Regression 61.90 Decision table 42.85 WEKA- J48 80.95
When we use the second approach (mean) in initilization. Obtained center points are given as follows:
Mean of 𝐴 = 7; Mean of 𝐵 = 13.5.
Redetermined A and B sets are given as follows:
𝐴 = {0,1,2,3,11,12,13,14,4,5,6,7}; 𝐵 = {8,9,18,19,15,16,17,20}. Obtained ten-fold cross validation results, after implementing supervised data classification methods on A and B datasets, are given in Table 3.
Table 3: Results of supervised data classification methods on redetermined datasets after second approach (mean) in
example 2.
Methods Testing Accuracy Naive bayes 66.66 Logistics 71.42 Classification via Regression 71.42 Decision table 71.42 WEKA-J48 80.95
In example 2, it seen that redetermined A and B datasets for each approaches (mean, k-means) are different from each
other unlike example 1. This is because, given datasets’ distribution is different from each other such that given A and
B datasets cannot be separated linearly in example 2.
As can be seen from Table 2 and 3 the best accuracy results for both of the approaches are the same. It was obtained in WEKA-J48. However in the other methods, Table 2 and 3 results differ from each other in terms of the differences of used center points that form different training sets.
3.2 Experiments via real-world datasets
For comparison between state of art methods on real-world datasets we use the Semi-Supervised Learning and Collective Classification package in the well-known machine learning tool WEKA [20].
Brief explanation of used WEKA semi-supervised classification methods are given as follows:
LLGC: “Learning with local and global consistency” was presented in 2003 by Zhou and his friends [21]. It is a collective classifier that generates a smooth classifier function for labeled and unlabelled data.
YATSI: “Yet another two stage idea” was presented in 2006 by Driessens and his friends [22]. It is a collective classifier that uses the given classifier to train on the training set and labeling the unlabeled data. As classifier we choose J48 that generates pruned or unpruned C4.5 decision tree and for predictions as nearest-neighbor-search algorithm we chose KDTree search algorithm that uses Euclidian distance as distance function.
Collective Tree: It works similar to Random Tree with some little differences. It constructs a tree that considers k randomly chosen attributes at each node [23]. We choose 1 as the random seed number to be used. For implementations, Liver Disorders, Breast Cancer Wisconsin Diagnostics (WBCD), Heart Disease, Ionosphere and Blood Transfusion Service Center real-world datasets obtained from UCI Machine Learning Repository by Lichman [24] are used. Number of attributes and instances of these datasets are given in Table 4. Since we make semi-supervised experiments, we use randomly %20 of the whole dataset as labeled and the rest as unlabelled data.
Table 4: Real-world datasets’ details.
Number of
Attributes Number of Instances
Liver 6 345
WBCD 9 683
Ionosphere 34 351
Heart 13 297
Blood Transfusion 5 748
We present the evaluation results by use of Ten-fold cross validation (mentioned in the section start) in Table 5. All the classifiers were tested with their default parameters.
When we interpret the evaluation results in Table 5. Algorithm 2 that uses combination of methods get better results than WEKA algorithms. When we compare Algorithm 2 with mean approach and k-means approach for finding center points, it can be seen that the implementation with mean method gets better results on three datasets however Blood and Ionosphere datasets get the best result in k-means approach. That’s because k-means method states the actual structure of these datasets.
Pamukkale Univ Muh Bilim Derg, 24(5), 864-869, 2018 N. Uylas Satı
868 Table 5: 10 fold cross validation results on real world datasets.
Algorithm 2 initilization technique +Supervised classification technique LIVER 10-fold cross validation result (%) WBCD 10-fold cross validation result (%) HEART 10-fold cross validation result (%) BLOOD TRANSFUSION 10-fold cross validation
result (%) IONOSPHERE 10-fold cross validation result (%) First approach (mean) Naïve bayes 83.76 97.65 86.38 88.21 91.66 Logistics 88.98 98.24 96.33 86.61 90.62 Classification via regression 91.04 97.21 96.67 89.99 90.62 Decision table 91.59 96.63 80.62 89.42 89.58 Weka-J48 91.30 96.33 91.09 87.98 91.66 Second approach (k-means) Naïve bayes 73.33 95.02 96.33 88.10 83.74 Logistics 89.85 97.71 93.17 89.70 84.96 Classification via regression 89.56 96.04 94.76 89.83 82.20 Decision table 89.85 94.58 93.71 89.97 84.35 Weka-J48 89.85 95.16 94.24 89.97 83.12 WEKA__LLGC 59.05 65.63 56.48 76.92 66.90 WEKA__YATSI 57.60 96.70 76.85 74.91 82.20 WEKA__Collective Tree 55.79 93.96 68.98 68.72 72.95
4 Conclusion
In this paper we experiment a collective classification method for semi-supervised data classification problems. Supervised data classification techniques are used after labeling the unknown labeled points. For the process of labeling the unknown ones we use the center points of each classes. We present three approaches for finding center points. For a clear understanding we solve two examples in one dimensional space by using each approach in initilization of Algorithm 2. Also we present ten-fold cross validation results of implied algorithms. For comparison between state of art methods and to see the efficiency of suggested approaches in large datasets, we make implemantations of suggested algorithm and WEKA algorithms on real-world datasets.
The collective method that we suggest in Algorithm 2 can be useful for semi-supervised data classification problems. The choice of the approach that will be used in the initilization can be changed according to the structure of the given dataset and the existent programs. Therefore the choice of proper initilization approaches and supervised data classification methods that will be used in the suggested collective algorithm should be left to the researcher.
5 References
[1] Zhu X. “Semi-Supervised Learning Literature Survey”. University of Wisconsin, Madison, United States, Technical Report, 1530, 2008.
[2] Hajmohammadi MS, Ibrahim R, Selamat A, Fujita H. “Combination of active learning and self-training for cross-lingual sentiment classification with density analysis of unlabelled samples”. Information Sciences, 317, 67-77, 2015.
[3] Chinaei L. Active Learning with Semi-Supervised Support Vector Machines. Msc. Thesis, Waterloo University, Ontario, Canada, 2007.
[4] Kanga P, Kimb D, Choc S. “Semi-supervised support vector regression based on self training with label uncertainty: An application to virtual metrology insemi conductor manufacturing”. Expert Systems With Applications, 51, 85-106, 2016.
[5] Bruzzone L, Chi M, Marconcini M. “A novel transductive SVM for semisupervised classification of remote-sensing images”. IEEE Transactıons on Geoscience and Remote Sensing, 44(11), 3363-3373, 2006.
[6] Ordin B. “Nonsmooth optimization algorithm for semi-supervised data classification”. Dynamics of Continuous, Discrete and Impulsive Systems Series B: Applications & Algorithms, 17, 741-749, 2010.
[7] Zhou Z, Li M. “Semisupervised regression with cotraining-style algorithms”. Journal IEEE Transactions on Knowledge and Data Engineering Archive, 19(11), 1479-1493, 2007.
[8] Zha ZJ, Mei T, Wang J, Wang Z, Hua XS. “Graph-based semi-supervised learning with multiple labels”. Journal of Visual Communication and Image Representation, 20 (2), 97–103, 2009.
[9] Alpaydın E. Introduction To Machine Learning. 2nd ed. Cambridge, Massachusetts, London, England, The MIT Press, 2010.
[10] Frank E, Hall MA, Witten IH. Data Mining: Practical Machine Learning Tools and Techniques. 4th ed. San Francisco, Morgan Kaufmann, 2016.
[11] Bagirov AM, Rubinov AM, Soukhoroukova NV, Yearwood J. “Unsupervised and supervised data classification via nonsmooth and global optimization”. Top, 11(1), 1-75, 2003.
[12] Bagirov AM, Mardaneh K. “Modified Global K-Means Algorithm for Clustering in Gene Expression Data Sets”. Workshop on Intelligent Systems for Bioinformatics 2006 (WISB 2006), Hobart, Australia, 4-9 December, 2006. [13] Irina R. “An emprical study of Naive Bayes classifier”.
IJCAI Workshop on Emprical Methods in Artificial Intelligence, 223, 41-46, 2001.
[14] Kiang MY. “A comparative assessment of classification methods”. Decision Support Systems, 35, 441-454, 2003 [15] Press SJ, Wilson S. “Choosing between logistic regression
and discriminant analysis”. Journal of the American Statistical Association, 73(364), 699-705, 1978.
[16] Frank E, Wang Y, Inglis S, Holmes G, Witten IH. “Using model trees for classification”. Machine Learning, 32(1), 63-76, 1998.
Pamukkale Univ Muh Bilim Derg, 24(5), 864-869, 2018 N. Uylas Satı
869 [17] Kohavi R. “The power of decision tables”. 8th European
Conference on Machine Learning, Heraclion, Crete, Greece, 25-27 April 1995.
[18] Quinlan R. C4.5: Programs for Machine Learning. San Mateo, CA, Morgan Kaufmann Publishers,1993.
[19] Kohavi R. “A study of cross-validation and bootstrap for accuracy estimation and model selection”. Fourteenth International Joint Conference on Artificial Intelligence, Montreal, Quebec, Canada, 20-25 August 1995.
[20] Garner SR. “Weka: The waikato environment for knowledge analysis”. Second New Zealand Computer Science Research Students Conference, Waikato, Hamilton, New Zealand, 18-21 April, 1995.
[21] Zhou D, Bousquet O, Lal NT, Westor J, Schölkopf B. “Learning with local and global consistency”. Max Planck Institute for Biological Cybernetics, Tübingen, Germany, Technical Report, 112, June 2003.
[22] Driessens K, Reuteman P, Pfahringer B, Leschi C. “ Using weighted nearest neighbor to benefit from unlabeled data”. 10th Pacific-Asia Conference on Knowledge Discovery
and Data Mining, Singapore, 9-12 April 2006.
[23] Laorden C, Sanz B, Santas I, Galan-Garcia P, Bringas PG. “Collective classification for spam filtering”. 4th International Conference Computational Intelligence in
Security for Information Systems(CISIS), Spain, 8-10 June, 2011.
[24] Lichman M. “UCI Machine Learning Repository”,
http://archieve.ics.uci.edu/ml/datasets.html