! "#$ #% $ #% &$ # ' #$ $
A STUDY OF RAVEN STANDARD PROGRESSIVE MATRICES
TEST’S ITEM MEASURES UNDER CLASSIC AND ITEM
RESPONSE MODELS:
AN EMPIRICAL COMPARISON
1Nükhet ÇIKRIKÇI-DEM RTA LI
Yar.Doç.Dr., Ölçme ve De erlendirme Anabilimdalı Ö retim Üyesi
1 Paper presented at 31st European Mathematical Psychology Congress in Graz, 2000, Austuria Abstract
The present paper is subject to study and compare empirically item measures of Raven Standard Progressive Matrices (RSPM) Test under Classic Test Theory (CTT) and Item Response Theory (IRT) Models. The findings of research showed that estimated Raven items’ difficulty indexes from CTT were very comparable with those from all IRT models and with the three-parameter model. But compared with item difficulty indexes, the item discrimination indexes from CTT were somewhat less comparable with those from IRT. Both CTT and IRT item difficulty indices (especially two- and three-parameter model) exhibited high invariance across samples. Both CTT and IRT item discrimination indexes which did not exhibit invariance across samples were analysed according to Classical-based and Item response based indices respectively. In general, the findings from this empirical investigation failed to discredit the CTT framework with regard to its alleged inability to produce invariant item statistics. On the other hand, if the RSPM will be used in some testing applications, such as computerized adaptive testing, test equating, IRT models will be preferable, especially two- parameter model.
Key words: Raven Standard Progressive Matrices Test, Item Response Theory, Classic Test Theory, Öz
Bu ara tırmada, Raven Standart lerlemeli Matrisler Testine (RS MT) ait madde parametreleri, Klasik Test Kuramı (KTK) ve Madde Tepki Kuramı (MTK) modelleri altında kestirilerek, görgül yakla ımla kar ıla tırılmı tır. Bulgular, KTK ve MTK na dayalı olarak kestirilen test madde güçlük ölçülerinin birbirleriyle kar ıla tırılabilir olduklarını bu kar ıla tırmada özellikle üç parametreli modelin klasik modelle en yüksek ili kileri verdi ini göstermi tir. Di er taraftan iki kurama dayalı olarak kestirilen madde ayırıcılık de erleri arasındaki ili ki çok dü ük veya eksi de erli çıkmı , bu parametreler iki kuram arasında kar ıla tırılabilir bulunmamı tır. Her iki kurama dayalı olarak kestirilen madde güçlük ölçüleri örneklemler arası “de i mezlik” özelli i gösterirken, madde ayırıcılık ölçüleri örneklemler arasında farklı de erler vermi lerdir. Görgül verilere dayalı olarak yürütülen bu çalı manın bulgularına genel olarak bakıldı ında, KTK’ nın “de i mez “ madde ölçüleri üretmede ba arısız olmadı ını göstermi tir. Di er taraftan, RSIMT nin kullanılabilece i, bilgisayarlı bireyselle tirilmi test uygulaması, test e itleme gibi bazı test uygulamalarında, özellikle iki parametreli model tercih edilebilir.
Classic Test Theory (CTT) is only one of the three primary test theories, where the other two being generalizability theory and item response theory. The major advantage of CTT is its relatively weak theoretical assumptions, which make CTT easy to apply in many testing situations (Hambleton & Jones, 1993). Although CTT has served the measurement community during the majority of the 20th century, Item Response theory (IRT) has witnessed an exponential growth in recent decades. IRT is being proposed by a growing number of psychometricians and practitioners as an alternative to classical test theory. The major limitation of CTT can be summarised as dependency of test statistics and item statistics: The person statistic (ie. observed score) is item sample dependent, and, the item statistics (ie. item difficulty and item discrimination) are examinee sample dependent (Hambleton, Cook, Eignor, & Gifford, 1978; Hambleton and Swaminathan, 1985; Wilcox, 1988; Hambleton, 1989). These dependencies pose some theoretical difficulties in CTT’s application in some measurement situations (eg. test equating, computerised adaptive testing) (Hambleton, Cook, Eignor, & Gifford, 1978; Hambleton and Swaminathan, 1985; Wilcox, 1988; Hambleton, 1989).
The use of IRT models may help solve some of the measurement problems frequently encountered by practitioners (eg. linking and equating of tests and building item banks). These models usually require rather strong assumptions about the nature of data that will not be completely met by any set of test data (Lord & Novick, 1968). The major assumption of all IRT models is unidimensionality or, equivalently, local independence of items. Additional assumptions are required for each specific IRT model (Albanese and Forsyth, 1984). In a few words, IRT postulates that (a) examinee test performance can be predicted (or explained) by a set of factors called traits, latent traits, or abilities, and (b) the relationship between examinee item performance and these traits can be described by a monotonically increasing function called an item characteristic function (Hambleton, 1989). This function specifies that examinees with higher scores on the traits have higher expected
examinees with lower scores on the traits. When a given IRT model fits the test data of interest, several desirable features are obtained. Examinee ability estimates are not test –dependent, and item indices are not group-dependent. Ability estimates obtained from different sets of items will be the same (except for measurement errors), and item parameter estimates obtained in different groups of examinees will be the same (except for measurement errors). In other words, in item response theory, item and ability parameters are said to be invariant. The property of invariance of item and ability parameters is obtained by incorporating information about the items into the ability-estimation process and by incorporating information about the examinees’ abilities into the item parameter estimation process (Hambleton, Swaminathan and Rogers, 1991 p.8).
In general, CTT and IRT are widely perceived as representing two very different measurement frameworks. However, few studies have empirically examined the similarities and differences in the parameters estimated using the two frameworks (Albenese & Forsyth, 1984; Fan, 1998).
The Raven Standard Progressive Matrices Test (RSPM) is widely used as an general intelligence test in the world (Ven & Ellis, 2000). In psychometric literature, some forms of Raven Tests were only studied under IRT one parameter logistic model (or Rasch model). Gallini (1983) applied the RSPM to 157, 7th grade students and examined fitting of SPM items to Rasch model. The number of RSPM items was reduced to 30 (originally 60 items) because of limitations in testing time. 26 of 30 items were fitted to Rasch model. Green and Kluver (1991) administrated the Raven Coloured Progressive Matrices Test (RCPM) to ages between 2-9, and 8-11 166 gifted children. 33 of 36 items were fitted to Rasch model and items showed high internal consistency (.89). Kahn (1985) studied RSPM’s items under Rasch model and examined applicability of RSPM as computerised adaptive testing. According to findings of this study, 9 items were found as misfitted items and RSPM was accepted as unfeasible for CAT application because of
items’ difficulty indexes of RSPM according to classic test theory and Rasch model and tested the fitting of items to the Rasch model in different distributional conditions. This study showed that difficulty estimations of RSPM’s items were ranked from the easiest to the hardest under Classic and Rasch model-based estimations in the whole test. This finding was valid for average difficulty estimations of subsets. In this study, the ratios of fitted items were found to be 35% and 50 % of the negatively skewed distribution and normal distribution of test scores, respectively.
The purpose of the study
The present study focused on two major issues: (a) how comparable are the item statistics of Raven Standard Progressive Matrices (RSPM) from the Classic Test Theory (CTT) framework with those from the Item Response Theory (IRT) framework? And (b) how invariant are the item statistics of RSPM from the CTT and IRT across examinee samples? More specifically, the present study focused on two major questions:
1- Is there any significant relationship between the item statistics and parameters of RSPM from the CTT framework with those from the IRT framework?
1a. Is there any significant relationship between the item difficulties from CTT and with those from IRT models?
1b. Is there any significant relationship between the item discriminations from CTT and with those from IRT models?
2- How invariant are the item statistics of RSPM from CTT and IRT in examinees with high and low ability?
2a- How invariant are the item difficulty measures of RSPM from CTT and IRT models in examinees with high and low ability?
2b- How invariant are the item discrimination measures of RSPM from CTT and IRT models in examinees with high and low ability?
Method Examinee Sample and Data
The data used in this study were from Demirtasli (1995) data. The RSPM was administered to 1118, 6th grade children as a group in 11 secondary schools in Ankara, Turkey.
RSPM is suitable for age 6 and up and it consists 60 figural items with multiple choices (Buros, 1985). It was scored dichotomously as either correct or incorrect, skipped items were scored as incorrect response and there is no unattempted item.
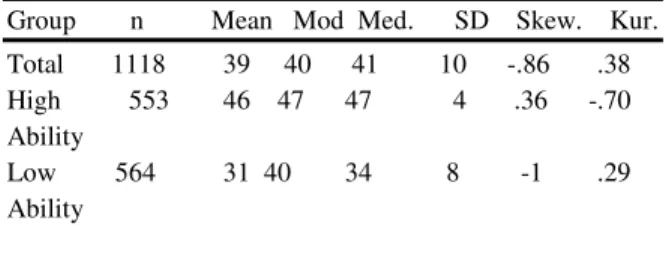
To examine the questions related to IRT and CTT statistics, examinee sample was handled in two different ways. In former, whole sampling group was examined for the first major question. In the second way, the whole sampling group was divided as high ability and low ability groups. That is, examinees were assorted according to their earned test score. Therefore, participants were ordered according to their scores from high to low. The range of test scores varied between 6 and 56. Then, the whole group was divided by median (41). The participants whose scores being with above the median were considered as high ability group, the participants with scores below the median were considered as the group with low ability. The high ability group had 553 examinees; and the low ability group had 564 participants. The distributional characteristics and distributional shape of examinees’ scores are shown in Table 1.
Table 1 Distributional characteristics of examinees
Group n Mean Mod Med. SD Skew. Kur. Total 1118 39 40 41 10 -.86 .38 High 553 46 47 47 4 .36 -.70 Ability Low 564 31 40 34 8 -1 .29 Ability ___________________________________________ Relationship between IRT and CTT based item measures:
(a) The comparability of IRT and CTT item
measures was investigated by correlating IRT and CTT item measures provided from all samples of participants. For this purpose, item difficulty parameter b (item location parameter) from three different unidimensional IRT models (one-, two-, and three parameter logistic models) with CTT item difficulty index (proportion of correct) and (b) item discrimination parameter a, (item slope parameter from two- and, three logistic IRT models) with CTT item discrimination index rpbis(point-biserial; item- test correlation) were obtained through the IRT program BILOG (PC Version 3.07, for one-, two-, and three- parameter IRT models, respectively). First phase of all IRT estimations gave classic item statistics. All IRT estimations were carried out using the marginal maximum likelihood (MML) method, which is the default for the BILOG program. (c) Transformations for CTT P value: In CTT, the item difficulty index P, the proportion of correct expresses item difficulty on an ordinal scale, not on an interval scale. This P value however can easily be transformed to an interval scale so that it is more appropriate for statistical analyses. The transformation simply requires the assumption that the underlying trait being measured by an item is normally distributed. This information is achieved by finding the z score corresponding to the (1-P) th percentile from the z distribution. For example, if the
P value of an item is .50 (50 % of the examinees
passed the item), the z value for such this P value
will be 0.00. This normalization removes the curvilinearity in the relationship between two sets of item P values (Anastasi, 1988). In this study, correlation analyses were performed by normalised P values to assess the invariant feature of CTT item difficulty statistics.
(b) Degree of Invariance of IRT and CTT Item measures:
As discussed in the literature review section, the invariance property of item parameters in IRT is crucial. The degree of invariance of item statistics was assessed by correlating item parameter (b, item difficulty; a, item discrimination) estimates in two sample groups (high and low ability group) under each measurement framework.
Results and Discussion
The results of the study are discussed as responses to two major research questions that were previously presented. Whenever appropriate, relevant interpretation and discussion about the meaning and implications of the results are presented together with the results. But before the results related to the research questions are presented, the question of IRT model fit and unidimensionality of the RSPM is addressed.
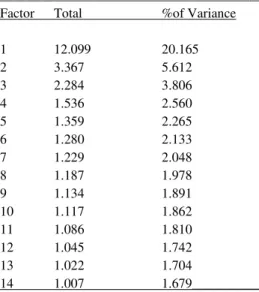
Unidimensionality and IRT Model Fit assessment: To test the unidimensionality of RSPMT data, two ways were performed: first, eigenvalue plot (from largest to smallest) of the inter- item correlation matrix was applied. The plot is studied to determine if a dominant first factor is present (Reckase, 1979 cited in: Hambleton, 1989). For this purpose, the principal axis factoring method was applied to Raven data. As a result of factor analysis, 60 factors appeared but 14 of these were above eiguenvalue with 0.99 (seen in Table 3). 50 of 60 items loaded on first factor (seen in Table 2). As seen on Table 2, the most of factor loadings are above 0.30 and the rest of the items loaded on factor 2, 3, 8, 10, 11, and 14 respectively. Factor loadings of the loaded items on first factor varied between 0.125 - 0.655.
Table 2 Results from principal axis factoring ______________________________________________
Item Fac1 Fac2 Fac3 Fac8 Fac10 Fac11 Fac13 Fac14
A1 .250 A2 .506 A3 .461 A4 .492 A5 .490 A6 .503 A7 .518 A8 .381 A9 501 A10 557 A11 .539 A12 .398 B1 .400 B2 .410 B3 .552 B4 .504 B5 .504 B6 .397 B7 .404 B8 .538 B9 .518 B10 .655 B11 .594 B12 .474 C1 .502 C2 .449 C3 .552 C4 .394 C5 .514 C6 .390 C7 .558 C8 .397 C9 .490 C10 .305 C11 .285 C12 .176 D1 .501 D2 .620 D3 .602 D4 .560 D5 .626 D6 .573 D7 .448 D8 .485 D9 .447 D10 .502 D11 .125 D12 .172 E1 .402 E2 .472 E3 .400 E4 .490 E5 .510 E6 .353 E7 .312 E8 .289 E9 .230 E10 .170 E11 .207 E12 .132 Expl. Vary. 20.17 5.6 1.68 3.8 2.0 1.9 1.8 1.70 (%) Cronbach alfa=.94
Table 3 Total Variance Explained of RSPM
Initial Eigenvalue
_______________________________________ Factor Total %of Variance 1 12.099 20.165 2 3.367 5.612 3 2.284 3.806 4 1.536 2.560 5 1.359 2.265 6 1.280 2.133 7 1.229 2.048 8 1.187 1.978 9 1.134 1.891 10 1.117 1.862 11 1.086 1.810 12 1.045 1.742 13 1.022 1.704 14 1.007 1.679__________ Cronbach alfa=.94
In addition to this result, the scree plot was suggested this finding (in fig. 1). According to this
result, Raven data showed three factors that did not meet strictly with assumption of unidimensionality in IRT.
Figure 1. The eigenvalues obtained from principal
axis factoring 0 2 4 6 8 10 12 14 0 20 40 60 80 Factor E ig en va lu e real data
This finding was found to be consistent with the one that of Green and Kluver (1991) and Ven and Ellis (2000). However unidimensionality as an assumption was not strictly provided, RSPM was assumed to be a unidimensional general ability test because the first factor was dominant that was explained 20.165 % of total variances (see in Table 3) and figure 1 shows that a speed falling from first factor’s eigenvalue to second factor’s eigenvalue.
The other way in assessment of unidimensionality which is the comparison of the plots of eigen values from the inter item correlation matrix, uses the real data, and an inter item correlation matrix of random data (the random data consist of random normal deviates in a data set with the same sample size and with the same number of variables as the real data). Two eigenvalue plots are compared. If the unidimensionality assumption is met in the real data, the two plots should be similar except for the first eigenvalue of the plots of eigenvalues for the real data. It should be substantially larger than its counterpart in the random data plot (Horn, 1965, cited in: Hambleton, 1989 p.174).
As seen in figure 2, the comparison of the plots of eigen values from this parallel analysis shows that first three factors’ eigen values of real data are bigger than the rest of other factors’ eigenvalues of random data. According to this finding, RSPM is accepted as rather a unidimensional test.
Figure 2. The comparison of eigenvalues from the interitem correlation matrix using real and random data (paralell analysis)
Model-data fit was assessed by checking if the individual test items misfit the given IRT models. In BILOG (3.07), a likelihood ratio χ² test (for a test
with more than 20 items), which assesses the discrepancy between the expected response pattern and actual response pattern of the participants on a particular item in relation to their performance on the test as a whole, is conducted for each item (Mislevy & Bock, 1990).
Table 4 Number of Misfitting Items Identified for the
RSPM
Test Num. of Items 1PL 2PL 3PL ___________________________________________ RSPM 60 33 13 10
___________________________________________
Table 4 summarises the number of items identified as misfitting the given IRT model at the
α=. 05 level. According to Table 4, the best fitting
ratio is provided by 3PL model.
Research Question 1-Is there any significant relationship between the item statistics and parameters of RSPM from the CTT framework with those from the IRT framework?
1a- Is there any significant relationship between
the item difficulties from the CTT and with those from IRT models?
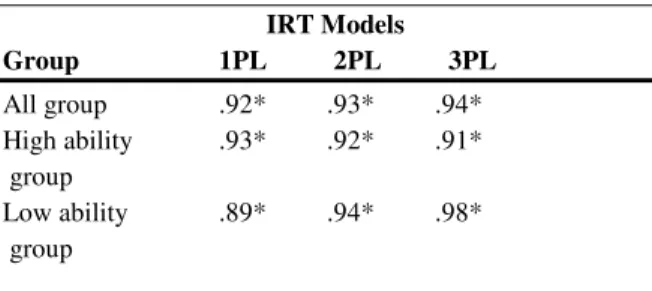
Table 5 presents the results of the relationships about classic item difficulty statistics and IRT-based item difficulty parameters for both of sampling group (the whole sample and divided samples according to their ability).
Table 5 The Relationships between the CTT and IRT-Based
Item Difficulty Estimates
======================================
IRT Models IRT Models
Group 1PL 2PL 3PL All group .92* .93* .94* High ability .93* .92* .91* group Low ability .89* .94* .98* group ___________________________________________ Note. CTT= classical test theory; IRT= item response
0 2 4 6 8 10 12 14 1 7 13 19 25 31 37 43 49 55 Factor E ig en va lu e random data real data
According to Table 5, classic item difficulties (normalized P values) were highly correlated with IRT-based item difficulty estimates. As the tabled results describe, the relationship between CTT and IRT three parameter logistic model is higher than two parameter model, and one parameter (Rasch model) respectively. But all of correlations were above .90 under each condition. This finding is similar to related literature (Fan ,1998; Gelbal, 1994)’ findings. But the order of amount of correlation coefficients is different from Fan’s study (1998); Fan’s correlations according to IRT models was ordered by one-, two-, and three parameter logistic models respectively.
1b- Is there any significant relationship between the item discriminations from CTT and with those from IRT models?
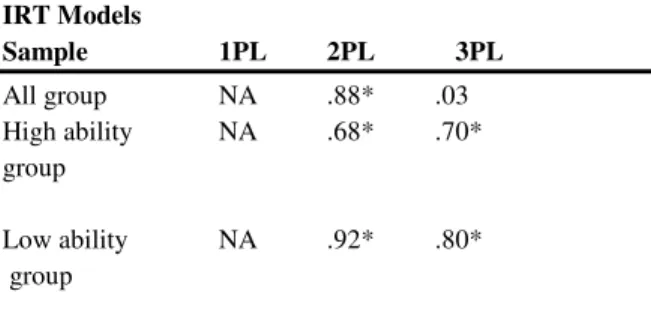
Table 6 presents the results, associated with the second part of first question research questions: The relationship between CTT-based and IRT-based item discrimination estimates.
Table 6 The Relationships between CTT and IRT-Based
Item Discrimination Estimates
====================================== IRT Models Sample 1PL 2PL 3PL All group NA .88* .03 High ability NA .68* .70* group Low ability NA .92* .80* group ___________________________________________ Note. NA= Not applicable, CTT= classical test theory; IRT= item response theory
*. Correlation is significant at the 0.01 level.
According to the related results, two-parameter model’s item discrimination values show more relationships with CTT discrimination statistics for total and low ability groups as compared to those for the other models. The three-parameter model only shows higher relationship with CTT discrimination
measures than two-parameter model’s discrimination measures, for high ability group. But all correlations are significant at the .01 level. According to these results, two parameter model’s item estimations are the most comparable with CTT for all groups.
Research Question 2- How invariant are the item statistics of RSPMT from CTT and IRT in examinees with high and low ability?
2a- How invariant are the item difficulty
parameters of RSPM estimated from CTT and IRT in
examinees with high and low ability?
As seen in Table 7, the estimated item difficulties from CTT and IRT are highly correlated between high and low ability groups.
Table 7 Invariance of Item Difficulties From the Two
Measurement Framework ====================================== IRT Models Sample CTT 1PL 2PL 3PL High – low .87* .83* .92* .92* ability groups ____________________________________ Note. CTT= classical test theory; IRT= item response theory,
*. Correlation is significant at the 0.01 level.
The comparison of the tabled CTT with IRT entry indicate that CTT item difficulty estimates are closely comparable with IRT item difficulty estimates in terms of their invariance properties in the sense that between – sample correlation coefficients of item difficulty estimates are mostly high and are comparable between CTT and IRT models. But two and three logistic models’ item difficulty parameters are a little more invariant than CTT item difficulty estimates.
This emprical finding about the invariance property of the item difficulty indices of two measurement frameworks is quite interesting in the light of the strong arguments in favor of the IRT
framework due to its ostensible advantage over CTT with regard to invarince.
Also, IRT one parameter model difficulty estimates appear to be slightly less invariant across samples than the CTT, two- and three-parameter model item difficulty estimates. The results in Table 7 evaluating model fit indicate the parallel finding in Table 4. Because the one-parameter model had the highest number of misfit items and also, it can be considered simply as a sub model nested under two- or three-parameter model. Theoretically, a higher in a model hierarchy tends to provide better fit than a model nested under it, because the lower model has more constraints (Fan, 1998). This situation implies that the degree of invariance of one-parameter model estimates.
2b- How invariant item discrimination
parameters of RSPM estimated from CTT and IRT in examinees with high and low ability?
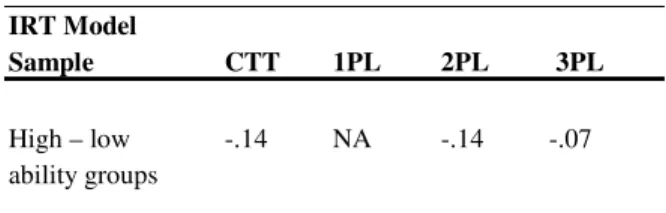
The item discrimination indices of both CTT and IRT were much more less invariant across participant samples than the item difficulty indices presented in Table 8.
Table 8 Invariance of Item Discriminations From the Two
Measurement Framework ====================================== IRT Model Sample CTT 1PL 2PL 3PL High – low -.14 NA -.14 -.07 ability groups ____________________________________ Note. CTT= classical test theory; IRT= item response theory, NA= Not applicable
*. Correlation is significant at the 0.01 level.
In other words, the item discrimination indices of both CTT and IRT did not show invariance. This finding parallel to Fan’s (1998). Fan found the least invariant item discrimination estimates for across high-low ability samples. In this situation, the
between samples. Many factors are likely to imply the following result; the structure of RSPM exhibited somewhat a violation of test unidimensionality and goodness of fitting.
Summary and Conclusion
The present study empirically examined the behaviour of item measures of RSPM obtained from the CTT and IRT measurement frameworks. The study focused on two main issues: (a) How comparable are the RSPM item measures from CTT with those from IRT? And (b) How invariant are the CTT RSPM item measures and the IRT RSPM item measures respectively? Raven Standard Progressive Matrices Test data from 1118, 6th grade students were used as the empirical basis of investigation.
The major findings were as follows:
1. The item difficulty indices from CTT were
very comparable with those from all IRT models and especially the three-parameter model.
2. Compared with item difficulty indices, the
item discrimination indices from CTT were somewhat less comparable with those from IRT.
3. Both CTT and IRT item difficulty indices
(especially two- and three-parameter model) exhibited high invariance across samples.
4. Both CTT and IRT item discrimination
indices did not exhibit invariance across samples. Overall, the findings from this empirical investigation failed to discredit the CTT framework with regard to its alleged inability to produce invariant item statistics. On the other hand, if the RSPM will be used in some testing applications, such as CAT, and test equating, then IRT models will be preferable, especially two- parameter model.
Of course, the present empirical study, like many other research studies, had some limitations. First of all, only item measures of RSPM were studied; also person statistics should be examined in subsequent studies. The second shortcoming of the investigation is variety of samples. In this study, invariance of item estimates was tested by high and low ability samples. In future studies, sample groups can be examined for different variables (etc. gender, socio-economic status, achievement, ethnicity)
REFERENCES
Albenese, M.A. & Forsyth, R.A. (1984). The one-, two-, and modified two parameter latent trait models: an empirical study of relative fit. Educational and Psychological Measurement. 44, 229-246.
Anastasi, A. (1998). Psychological testing (6th ed.). Newyork: McMillan
Buros, O.K. (1985). (Ed.). The nineth mental measurement yearbooks. Highland Park, N.J: Gryphon Press.
Demirta lı Çıkrıkçı, N. (1995). Rasch modelinin Raven standart ilerlemeli matrisler testine uygulanması ve klasik test kuramı ile kar ıla tırılması. (The Application of Rasch model to Raven Standard Progressive Matrices and its comparison with classical test theory). Unpublished Doctoral Dissertation. Ankara University, Institute of Social Sciences.
Fan, X. (1998). Item response theory and classical test theory: An empirical comparison of their item/person statistics. Educational and Psychological Measurement, 58(3), 357-381. Gallini, J.K. (1983). A Rasch analysis of Raven item
data. Journal of Experimental Education, Fall 52(1), 27-32
Gelbal, S. (1994). P madde güçlük indeksi ile Rasch modelinin b parametresi ve bunlara dayalı yetenek ölçüleri üzerine bir kar ıla tırma. (Doktora Tezi) Ankara, Hacettepe Üniversitesi Sosyal Bilimler Enstitüsü.
Green, K.E. and Kluever, R.C. (1991). Structural properties of Raven's coloured progressive matrices for a sample of gifted children. Perceptual and Motor Skills, 72, 59-64
Hambleton, R.K. (1989). Item response theory: introduction and bibliography . (Research Report No 196) (ERIC Document Reproduction Service No ED 310 137).
Hambleton, R.K., & Jones, R.W. (1993). Comparison of classical test theory and item response theory and their applications to the test development. Educational Measurement: Issues and Practice, 12(3), 38-47.
Hambleton, R.K., & Swaminathan, H. (1985). Item response theory: Principles and applications.Boston:Kluwer.
Hambleton, R.K.,Swaminathan,H., Cook,L.L., Eignor,D.R. and Gifford,J.A.(1978). Developments in latent traits theory: models, technical issues, and applications. Review of Educational Research, Fall 48(4), 467-510. Hambleton, R.K., & Swaminathan, H., & Rogers,
H.J. (1991). Fundemantals of item response theory. Newbury Park, CA: Sage.
Kahn, H.F.(1985). Application of latent trait theory to Raven's standart progressive matrices. Dissertation Abstracts nternational. Dec. Vol 46(6-A) 1559-1560.
Lord, F.M. ve Novick, M.R.(1968). Statistical theories of mental test scores. NY: Addison-Wesley Publishing Company.
Mislevy, R.J., & Bock, R.D. (1990). BILOG 3: Item analysis and test scoring with binary logistic
models. Chicago: Scientific Software International.
Ven, A.H.G.S. van der & Ellis, J.L. (2000). A Rasch analysis of Raven’s standard progressive matrices. Personality and Individual Differences, 29, 45-64.
Wilcox,R.R.(1988). True score models. In J.P. Keeves (Ed.). Educational research, methodology and measurement: an international hanbook. (p.267-269). Boston: Pergamon Press.