Design Gyration Number Determination of 100 mm-Diameter Asphalt
Mixtures
Article in International Journal of Civil Engineering · February 2019
DOI: 10.1007/s40999-019-00399-1 CITATIONS 0 READS 1,776 2 authors: Serkan Tapkin
Antalya Bilim University
52PUBLICATIONS 566CITATIONS SEE PROFILE Mustafa Keskin Anadolu University 8PUBLICATIONS 20CITATIONS SEE PROFILE
https://doi.org/10.1007/s40999-019-00399-1
RESEARCH PAPER
Design Gyration Number Determination of 100 mm-Diameter Asphalt
Mixtures
Serkan Tapkın1 · Mustafa Keskin2
Received: 4 September 2018 / Revised: 21 January 2019 / Accepted: 23 January 2019 © Iran University of Science and Technology 2019
Abstract
At present, there is no accepted standard by highway authorities on the compaction procedures of 100 mm-diameter gyratory compactor specimens. In previous studies on gyratory compaction, the method of either coring from 150 mm specimens, or preparing taller specimens than the usual 63.5 mm-long Marshall specimens, has been undertaken. However, the utilisation of 150 mm-moulds produces a significant amount of mechanical disturbance during the coring process of 100 mm-diameter specimens. The note-worthy aspect of this study is that a new standard for preparing gyratory compactor specimens with a diameter of 100 mm and a length of approximately 63.5 mm has been proposed for the first time. In this study, the design gyration number of the asphalt mixture was obtained by carrying out extensive laboratory testing on the specimens prepared, and by changing various testing parameters including the gyration number, angle of gyration, specimen height, and ram pressure. First, tests using 600 kPa ram pressure and a 1.25° gyration angle with varying gyration numbers were carried out. Then, the gyration angle was changed from 1.25° to 1.85° by 0.05° increments. Following that, a completely different pat-tern of loading level using 240 kPa with a 2° gyration angle was investigated. And finally, changing the gyration angle from 1.60° to 2.40° by 0.20° increments was carried out to provide a wider scope of investigation. As a result, the design gyration number for 100 mm-diameter asphalt mixtures was determined as 40 under medium traffic conditions.
Keywords Gyratory compaction · 100 mm-diameter specimens · Angle of gyration · Ram pressure · Design gyration number · Medium traffic conditions
1 Introduction
Gyratory compactors have been accepted as the backbone of laboratory compaction simulation over the last 3 decades. With the widespread acceptance of Superpave practices, gyratory compactors has become one of the most impor-tant pieces of compaction equipment in these laboratories. Roberts et al. [1], in their study, have drawn the most gen-eral picture of asphalt mixture design. There have been
many important studies published to-date, by a number of researchers, about this realistic simulation effort and some very beneficial effects of the Superpave gyratory compac-tors can be found in a number of these publications from over last 2 decades [2–5]. It should be noted, that although these publications deal mostly with Superpave practices, it is not possible to consider Marshall compaction independently from these studies. So in the above-mentioned studies, the utilisation of either coring from 150 mm diameter speci-mens or the preparation of taller specispeci-mens than the usual 63.5 mm long Marshall specimens has been undertaken. The importance of this study is, here, a totally new standard of preparing 100 mm-diameter gyratory compactor specimens being explored for the first time. The vast majority of the other studies are about 150 mm specimens fabricated by Superpave gyratory compactors. A special study dealing specifically with 100 mm gyratory compactor specimens has been published in the literature that utilizes 100 mm-diameter moulds and not taking core samples out of 150 mm specimens [6]. The Superpave gyratory compactor system
* Serkan Tapkın
[email protected] Mustafa Keskin
1 Faculty of Engineering, Department of Civil Engineering,
Antalya Bilim University, Çıplaklı Mah. Akdeniz Bulvarı No:290 A, Döşemealtı, Antalya, Turkey
2 Faculty of Engineering, Civil Engineering Department,
Anadolu University, Iki Eylül Kampüsü, 26555 Eskisehir, Turkey
generally utilizes 150 mm diameter moulds. They have, however, also used 100 mm-diameter moulds to fabricate gyratory compactor specimens. As a result of their findings, they advised the Tennessee Department of Transportation (TDOT) that it is more efficient to use 100 mm-moulds in place of the 150 mm-moulds for the testing of asphalt. This practice is limited to asphalt mixtures with a maximum aggregate size of 25.4 mm. Some of the possible benefits of utilising 100 mm-moulds are as follows: (a) size of the sample is decreased by 400%, thus preparation time, storage space, and the moving of materials are reduced consider-ably; (b) laboratory testing in a conventional manner with specimens of 100 mm is made possible; and (c) maximum aggregate size of 25.4 mm or smaller makes up the bulk of the mixture composition for the surface layer of road-works in Tennessee and other countries, including Turkey. As well as this, 150 mm-moulds frequently do not comply with AASHTO and ASTM requirements [6].
The superiority of this paper over Jackson and Czor’s [6] is, in the present study, more than 400 specimens have been tested mechanically and lots of different compaction protocols have been used such as 600 kPa ram pressure and 1.25° gyration angle analyses with varying gyration number, changing gyration angle from 1.25° to 1.85° by 0.05° incre-ments, a completely different pattern of a loading level of 240 kPa and a 2° gyration angle and changing gyration angle from 1.60° to 2.40° by 0.20° increments. With the aid of all these different compaction methods, we could be able to end up with a design gyration number of 40.
To begin this study, first, relevant literature on gyratory compactors was examined. Then, using gyratory compac-tors, 100 mm specimens were prepared and analysed, chang-ing various testchang-ing parameters, and recordchang-ing the results. Finally, the test results, indicating the design gyration num-ber for reference asphalt mixtures as 40 under medium traffic conditions, were further examined in greater detail. Testing for similar and specific types of aggregate sources, bitumen,
aggregate gradation and mixture proportions was conducted under laboratory conditions.
2 Experimental Studies Undertaken
2.1 Material PropertiesContinuous aggregate gradation was used to establish the gradation limits for wearing course type 2 set by the acting standards of Turkey [7]. Crushed stone calcareous aggregate obtained from a local quarry was used. The filler was also obtained from the same source. For the preparation of the gyratory compactor specimens, locally sourced 50/70 pen-etration bitumen (PG 64-22) was used. The physical prop-erties of the bitumen used are stated in Table 1. Technical data about the aggregates are presented in Tables 2 and 3. 2739 kg/m3 is the apparent specific gravity of the filler.
2.2 The Procedure to Determine the Design Gyration Number for Reference Asphalt Mixtures
IPC Servopac gyratory compaction was used to fabricate 100 mm-specimens [9]. To have reliable results, more than 400 specimens were fabricated and put through all the calibration, testing, and validation phases [8]. To be able to make any conclusions, a standpoint was necessary for the control and interpretation of the obtained test results. The results obtained from the gyratory compaction tests were cross checked with earlier studies by various authors, respectively [10–18]. In these studies, the Marshall design procedure was used to prepare the asphalt specimens. The compaction technique of gyratory compactors is somewhat different from Marshall compaction. Despite this, the vast
Table 1 Physical properties of the reference bitumen [8]
Property Test value Standard
Penetration at 25 °C (1/10 mm) 68.35 ASTM D 5-97
Penetration Index − 0.26 –
Ductility at 25 °C (mm) > 1000 ASTM D 113-99
Viscosity at 135 °C (Pa s) 0.335 ASTM D 4402
Viscosity at 165 °C (Pa s) 0.073 ASTM D 4402
Loss on heating (%) 0.0572 ASTM D 6-80
Specific gravity at 25 °C (kg/m3) 1028 ASTM D 70-76
Softening point (°C) 50.67 ASTM D 36-95
Flash point (°C) 312 ASTM D 92-02
Fire point (°C) 344 ASTM D 92-02
Table 2 Physical properties of coarse aggregates [8]
Property Test value Standard
Bulk specific gravity (kg/m3) 2698 ASTM C 127-04
SSD specific gravity (kg/m3) 2703 ASTM C 127-04
Apparent specific gravity (kg/m3) 2712 ASTM C 127-04
Water absorption (%) 0.191 ASTM C 127-04
Table 3 Physical properties of fine aggregates [8]
Property Test value Standard
Bulk specific gravity (kg/m3) 2684 ASTM C 128-04
SSD specific gravity (kg/m3) 2710 ASTM C 128-04
Apparent specific gravity (kg/m3) 2756 ASTM C 128-04
amount of data that have been previously obtained offered a very good foundation for obtaining the design gyration number of gyratory compactor specimens stemming from the similarities of the technical test results [14]. To find this design gyration number, very intense testing was carried out. The methods and practices followed throughout these studies are:
(a) Air void values should lie between 3 and 5% for 100 mm-gyratory compactor specimens [7].
(b) Previous studies were the guide in the search for the design gyration number [10–18]. Air void values obtained from the Marshall design were provided by the software embedded in the IPC Servopac gyratory compactor [9]. With the aid of this software, gyration angle, specimen height, air voids, unit weight, shear stress and ram pressure were able to be monitored online. Air void value was the main parameter that was monitored in detail.
(c) Although air void values were monitored in a very rig-orous manner, tests on other variables were also carried out. For instance, gyration numbers were changed to be able to validate the physical and mechanical vari-ances between the different gyration numbers. Also, the ram pressure and gyration angles values were further changed to arrive at more conclusions. Furthermore, the air voids, voids filled with asphalt, voids in mineral aggregate, unit weights, stability, flow and Marshall Quotient values were continuously cross checked with the previously prepared Marshall specimens’ properties [10–18].
2.3 600 kPa Ram Pressure and 1.25° Gyration Angle Analyses with Varying Gyration Numbers
In previous studies, 600 kPa ram pressure, 1.25° gyration angle, a gyration speed of 30 rpm and at least 145 °C com-paction temperature was used along with varying gyration
numbers between 30 and 70, increasing by increments of 5 (no test results for 65 gyrations). Also, the gyration num-bers were increased up to 135 but these gyration numnum-bers, as can be expected, ended up with very low air void val-ues and are therefore not included in this study. Table 4 depicts the average test results for gyration numbers of 30 (10 specimens), 35 (10 specimens), 40 (5 specimens), 45 (4 specimens), 50 (6 specimens), 55 (5 specimens), 60 (3 specimens) and 70 (36 specimens). These numerical values in a graphical manner are presented in Figs. 2, 3, 4, 5, 6, 7, 8 and 9.
At this point, the relevant information are given in Table 5 [7]. But the reader has to be aware of the fact that these standards are applicable only to Table 5 [7]. This table presents the criteria for surface courses that are stated in acting standards for just Marshall specimens.
When Figs. 1, 2, 3, 4, 5, 6, 7 and 8 are investigated, the following conclusions can be drawn:
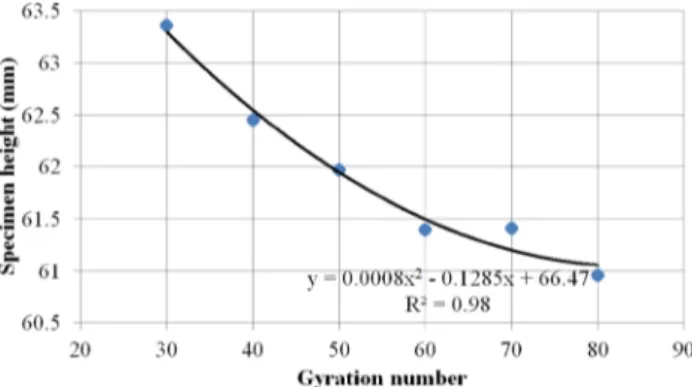
The coefficient of determination for all of the param-eters analysed are well above 0.95 except specimen height (which is 0.92); therefore, it can be concluded that the 100 mm-diameter specimens were prepared in a depend-able manner providing a sound basis for future analyses.
Table 4 The average physical and mechanical test values of gyratory compactor specimens resulting from 600 kPa ram pressure and 1.25° gyra-tion angle analyses (Superpave practice) with varying gyragyra-tion numbers
Gyration
number Unit weight (kg/m3) Voids in mineral aggregate (%) Voids filled with asphalt (%) Air voids (%) Stability (kg) Flow (mm) Marshall quo-tient (kg/mm) Specimen height (mm)
30 2441 15.111 74.854 3.790 1164.585 4.401 266.318 61.93 35 2448 14.863 76.326 3.509 1265.329 4.290 295.279 61.61 40 2451 14.763 76.936 3.395 1261.565 4.059 311.174 61.32 45 2459 14.487 78.657 3.082 1327.232 3.992 333.153 61.34 50 2470 14.109 81.112 2.654 1351.816 3.840 352.520 60.96 55 2468 14.172 80.704 2.725 1373.031 3.936 351.091 61.01 60 2481 13.723 83.755 2.217 1498.258 3.974 378.981 60.18 70 2489 13.462 85.655 1.921 1577.621 4.239 372.725 60.12
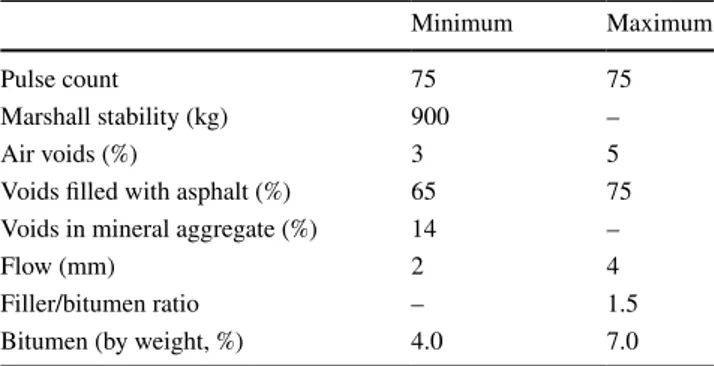
Table 5 Criteria for surface courses that are described in the acting
standards for Marshall specimens [7]
Minimum Maximum
Pulse count 75 75
Marshall stability (kg) 900 –
Air voids (%) 3 5
Voids filled with asphalt (%) 65 75
Voids in mineral aggregate (%) 14 –
Flow (mm) 2 4
Filler/bitumen ratio – 1.5
The stability values are well above 900 kg (see Fig. 6). Therefore, there should be no problem with the maximum load the specimen could carry before failure.
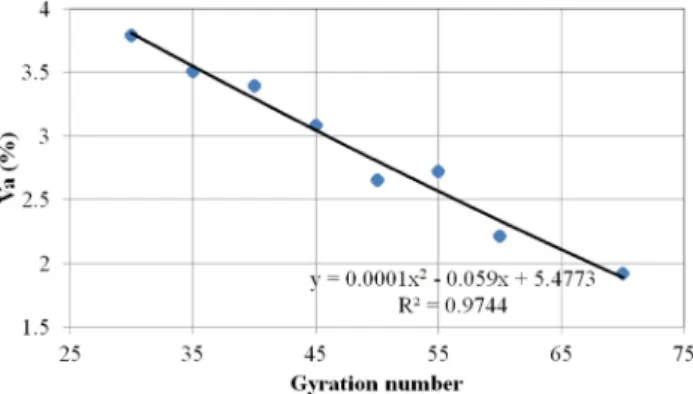
At gyration numbers below 40 as highlighted in Fig. 5, the air void values are between 3.395 and 3.790%. The standards dictate that the air void values should be between 3 and 5% for an acceptable surface course mixture [7]. The
obtained air void values fall well within the limits of the acting standards.
The values of voids filled with asphalt should be between 65 and 75% according to the acting standards. At 40 gyrations, (see Fig. 4) voids filled with asphalt had a value of 76.396% which is above the limit. This is a fairly predictable difference when the very different compaction pattern in gyratory compactors is considered.
Fig. 1 Type 2 wearing course gradation [7]
Fig. 2 Unit weight versus gyration number according to Superpave
practice
Fig. 3 Voids in mineral aggregate versus gyration number according
to Superpave practice
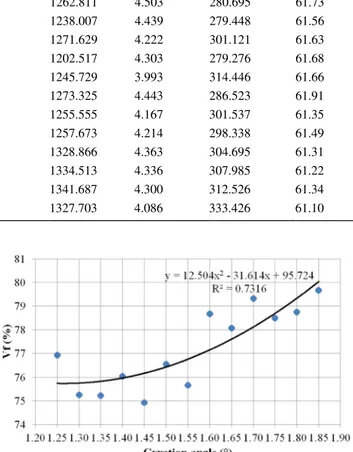
Fig. 4 Voids filled with asphalt versus gyration number according to Superpave practice
Fig. 5 Air voids versus gyration number according to Superpave practice
Fig. 6 Stability versus gyration number according to Superpave
The voids in mineral aggregate values are well above 14% for the gyration number values less than 40, so the limits of the standards are respected (see Fig. 3).
According to the General Directorate of Highways, the flow values should lie between 2 and 4 mm for Marshall specimens, but as the gyratory compaction technique is completely different from the previous one, the value of 4.059 mm is explicable and acceptable for 40 gyrations.
To be able to arrive at more solid conclusions, and because of the nature of gyratory compaction, further spec-imens with 61.5 mm height were prepared and mechani-cally tested [8]. The specimen heights were measured by gyratory compactor software and a vernier to increase the results reliability. Figure 9 shows the correspondence of 61.5 mm height to a gyration number of 40 being analogous with the previous results. Basically average of 6 Marshall specimens’ physical and mechanical properties have been stated in Table 6. 36 more 100 mm-diameter specimens were prepared and mechanically tested to ensure the design gyra-tion number (Table 7).
When Tables 7, 8 and 9 are analysed, it can be seen that a gyration number of 40 can be accepted as the design gyration number for 100 mm-diameter gyratory compactor specimens. The difference in flow, and therefore Marshall Quotient values, is self-explanatory as gyratory compaction is a totally different and much better method of simulating actual compaction processes on site. So, it can be concluded that flow values, by themselves, do not give a realistic or completely accurate prediction of deformation of the speci-men before failure.
2.4 Changing Gyration Angle from 1.25° to 1.85° by 0.05° Increments
With 40 determined as the most likely design gyration number, a more detailed analysis was able to be carried out. (600 kPa ram pressure, 1.25° gyration angle, a gyration speed of 30 rpm and at least 145 °C of compaction tempera-ture was used). The angle of gyration values were changed and 78 more 100 mm-diameter specimens were prepared and tested (see Table 9; Figs. 10, 11, 12, 13, 14, 15, 16 and 17 for results of these tests).
As can be seen from Table 9 and Figs. 10, 11, 12, 13, 14, 15, 16 and 17, when the gyration angle increased, as expected, the 100 mm gyratory compactor specimens became more densely compacted, causing a decrease in the air voids and specimen heights. At the same time, the values of unit weights, voids filled with asphalt, and stability val-ues increased. Again, it is not possible to be precise about the flow and Marshall Quotient values which is evident in Figs. 14 and 15. This series of experiments provides a sound basis for the effects of changing the parameter of the angle of gyration. To further check whether changing the gyration angle to values other than 1.25° makes any significant dif-ference, one-way anova analyses were carried out. When the averages of the test results were compared, no changes were seen between 1.25° and the other angles test results. These statistics show the significance of 1.25° as the standard gyra-tion angle value in the gyratory compacgyra-tion technique. How-ever, there are statistically significant differences between Fig. 7 Flow versus gyration number according to Superpave practice
Fig. 8 Marshall quotient versus gyration number according to Super-pave practice
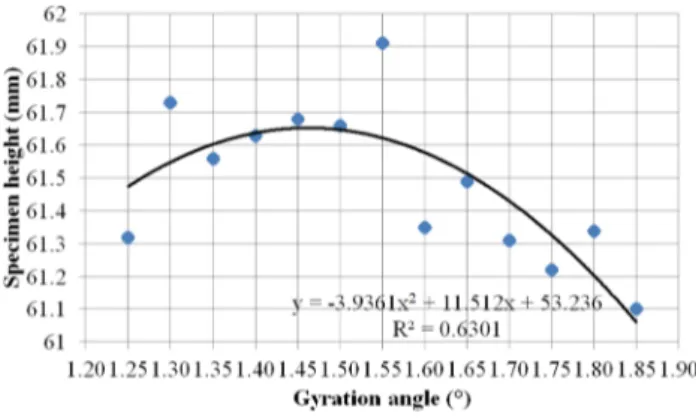
Fig. 9 Specimen height versus gyration number according to Super-pave practice
some of the other two by two comparisons, which could be a topic for further research.
2.5 A Completely Different Pattern of a Loading Level of 240 kPa and a 2° Gyration Angle
According to Australian research, there is an important study that deals with a completely different loading level and gyration angle of the gyratory compactor to prepare specimens that resemble Marshall specimens [19]. To bet-ter investigate the subject, a new series of 24 × 100 mm-diameter gyratory compactor specimens were prepared and tested (with a gyration speed of 30 rpm and at least 145 °C compaction temperature). The results can be seen in Table 10 and Figs. 18, 19, 20, 21, 22, 23, 24 and 25.
As can be seen from Table 10 and Figs. 18, 19, 20, 21, 22, 23, 24 and 25, when the gyration number increased, as can be expected, the 100 mm gyratory compactor speci-mens became more densely compacted. As the level of applied stress is much lower than 600 kPa, it is evident that the number of gyrations will be higher to achieve a similar degree of compaction. See Table 11 for explanation of this phenomenon.
As can be seen in Table 11, 50 gyrations of 240 kPa–2° pattern (with a gyration speed of 30 rpm and at least 145 °C of compaction temperature) produces similar specimens to the 600 kPa–1.25° pattern. The amount of compactive force is 25% higher in the low level of stress application and produces very similar specimens. Unit weight values of the two patterns are approximately the same. Voids in mineral aggregate, voids filled with asphalt and air voids values are again, very similar to each other. So, it is clearly evident that physically, the two sets of specimens have approximately the same quantities. Mar-shall stability values also correlate in the two different testing protocols in an acceptable manner, but flow val-ues do not. There is approximately a 25% increase in the 240 kPa–2° pattern which deserves attention. Therefore, it
can be concluded from the data, that when the amount of compactive force increases, the flow values decrease with the gyration number.
2.6 Changing Gyration Angle from 1.60° to 2.40° by 0.20° Increments
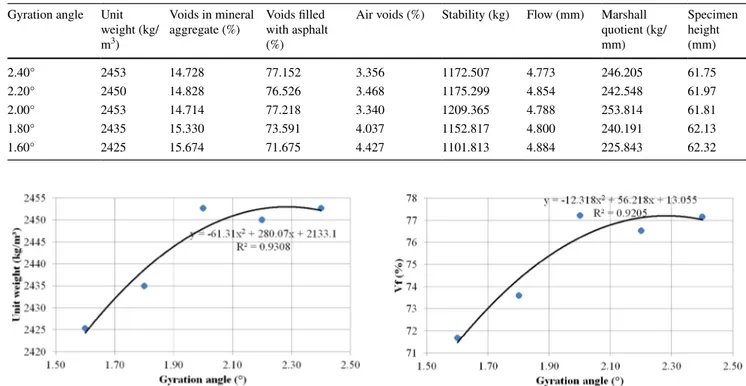
At this point, to carry out a more detailed analysis, the angle of gyration values was changed, and 12 more 100 mm-diam-eter specimens were prepared and tested to further inves-tigate the subject (gyration speed of 30 rpm and at least 145 °C of compaction temperature). The averages of three specimens for each gyration angle amount (4 specimens for 2.00° gyration angle) can be seen in Table 12 and Figs. 26, 27, 28, 29, 30, 31, 32 and 33.
When Figs. 26, 27, 28, 29, 30, 31, 32 and 33 are exam-ined, it can be seen that when the gyration angle increases in the same gyration number pattern, the 100 mm gyratory compactor specimens become more densely compacted causing a decrease in the air voids and specimen heights. On contrary, the values of unit weight, voids filled with asphalt, and stability values increase. Again, as in the previous dis-cussions, it is not possible to come to any solid conclusions about the flow and Marshall Quotient values, which can be clearly seen in Figs. 31 and 32. This series of experiments provides a sound basis for the effect of changing the param-eter of the angle of gyration which, in fact, is responsible for the further compaction.
3 Conclusions and Further
Recommendations
As a result of the above investigation, a new standard of a design gyration number of 40 has been proposed for the first time, for similar and specific types of aggregate sources, bitumen, aggregate gradation, mixture proportioning, and laboratory conditions. The testing parameters for this design Table 6 Physical and mechanical properties of the specimens prepared with the Marshall compactor
Unit weight
(kg/m3) Voids in mineral aggregate (%) Voids filled with asphalt (%) Air voids (%) Stability (kg) Flow (mm) Marshall quotient (kg/mm) Blows
2463 14.979 76.614 3.512 1316.0 3.261 403.557 50 2464 14.956 76.756 3.485 1279.08 2.875 444.897 50 2470 14.725 78.166 3.224 1353.18 3.870 349.659 50 2463 14.974 76.643 3.506 1325.82 3.807 348.258 50 2457 15.182 75.408 3.742 1333.80 3.560 374.663 50 2471 14.695 78.355 3.189 1158.25 3.403 340.361 50 2465 14.919 76.990 3.443 1294.355 3.463 376.889 50
Table 7 Physical and mechanical properties of the specimens prepared with a gyratory compactor (gyratory compactor specimens were prepared by utilising 61.5 mm as the specimen height)
Unit weight
(kg/m3) Voids in mineral aggregate (%) Voids filled with asphalt (%) Air voids (%) Stability (kg) Flow (mm) Marshall quotient (kg/mm) Gyra-tion
number 2441 15.126 74.750 3.807 1232.403 4.303 286.405 33 2451 14.782 76.804 3.416 1294.680 4.256 304.021 39 2455 14.631 77.734 3.245 1407.087 4.294 327.687 45 2453 14.701 77.297 3.325 1180.906 4.160 283.872 37 2449 14.860 76.326 3.505 1180.832 3.759 314.135 39 2453 14.702 77.289 3.326 1328.072 4.152 319.863 42 2456 14.595 77.957 3.204 1302.406 4.153 313.606 43 2449 14.836 76.476 3.477 1302.406 4.364 298.443 38 2464 14.337 79.597 2.913 1363.859 4.297 317.405 54 2457 14.583 78.034 3.191 1315.465 4.379 300.403 41 2458 14.548 78.248 3.152 1354.746 4.193 323.097 49 2446 14.935 75.878 3.590 1298.931 4.532 286.613 39 2442 15.079 75.028 3.753 1216.627 4.194 290.088 39 2453 14.717 77.202 3.342 1252.498 4.353 287.732 39 2462 14.402 79.182 2,985 1363.514 4.176 326.512 44 2455 14.640 77.676 3.256 1299.773 4.166 311.995 43 2449 14.849 76.396 3.492 1274.953 4.394 290.158 35 2459 14.515 78.460 3.114 1199.378 4.403 272.400 38 2454 14.686 77.387 3.308 1123.231 4.043 277.821 37 2465 14.302 79.823 2.873 1269.794 4.583 277.066 44 2451 14.765 76.784 3.420 1232.571 4.390 280.768 36 2462 14.410 79.127 2.995 1194.706 4.086 292.390 42 2453 14.720 77.180 3.346 1191.851 3.923 303.811 40 2451 14.789 76.761 3.424 1194.355 4.330 275.833 36 2455 14.648 77.625 3.265 1248.748 4.376 285.363 35 2456 14.588 78.003 3.196 1225.581 4.022 304.719 34 2467 14.222 80.351 2.782 1286.787 4.145 310.443 42 2461 14.428 79.010 3.016 1220.348 4.121 296.129 38 2466 14.259 80.110 2.823 1255.977 3.887 323.123 38 2462 14.378 79.336 2.958 1259.547 3.961 317.987 41 2461 14.435 78.966 3.024 1294.046 4.128 313.480 37 2451 14.776 76.836 3.410 1228.036 4.175 294.140 35 2462 14.404 79.167 2.988 1302.852 3.893 334.665 41 2462 14.403 79.171 2.987 1254.648 4.163 301.381 36 2457 14.570 78.110 3.177 1185.614 4.363 278.117 36 2466 14.250 80.169 2.813 1356.431 4.018 337.589 42 2456 14.608 77.896 3.219 1263.714 4.195 301.651 40
Table 8 Average physical and mechanical properties of the specimens prepared with gyratory and Marshall compactors (Gyratory compactor
specimens were prepared utilising 61.5 mm as the specimen height) Unit weight
(kg/m3) VMA (%) Vf (%) Va (%) Stability (kg) Flow (mm) MQ (kg/mm) Blows and gyration
number
Marshall 2465 14.919 76.990 3.443 1294.355 3.463 376.899 50
Gyratory 2456 14.608 77.896 3.219 1263.714 4.195 301.651 40
gyration number are 600 kPa ram pressure, 1.25° gyration
angle, a gyration speed of 30 rpm and at least 145 °C of compaction temperature. The coefficient of determina-tion for all of the parameters analysed are well above 0.95, Table 9 The average physical and mechanical test values of gyratory compactor specimens prepared by 600 kPa vertical stress and gyration angles varying from 1.25° to 1.85°
Gyration angle Unit weight (kg/ m3)
Voids in mineral
aggregate (%) Voids filled with asphalt (%)
Air voids (%) Stability (kg) Flow (mm) Marshall quotient (kg/ mm) Specimen height (mm) 1.25° 2451 14.763 76.936 3.395 1261.565 4.059 311.174 61.32 1.30° 2443 15.040 75.265 3.709 1262.811 4.503 280.695 61.73 1.35° 2443 15.043 75.239 3.713 1238.007 4.439 279.448 61.56 1.40° 2447 14.908 76.042 3.559 1271.629 4.222 301.121 61.63 1.45° 2442 15.096 74.932 3.772 1202.517 4.303 279.276 61.68 1.50° 2450 14.824 76.557 3.465 1245.729 3.993 314.446 61.66 1.55° 2445 14.971 75.673 3.631 1273.325 4.443 286.523 61.91 1.60° 2459 14.485 78.675 3.080 1255.555 4.167 301.537 61.35 1.65° 2457 14.581 78.074 3.189 1257.673 4.214 298.338 61.49 1.70° 2462 14.383 79.316 2.965 1328.866 4.363 304.695 61.31 1.75° 2459 14.510 78.493 3.108 1334.513 4.336 307.985 61.22 1.80° 2460 14.469 78.758 3.062 1341.687 4.300 312.526 61.34 1.85° 2464 14.329 79.662 2.903 1327.703 4.086 333.426 61.10
Fig. 10 Unit weight versus gyration angle for 600 kPa ram pressure
analyses
Fig. 11 Voids in mineral aggregate versus gyration angle for 600 kPa ram pressure analyses
Fig. 12 Voids filled with asphalt versus gyration angle for 600 kPa
ram pressure analyses
Fig. 13 (Air voids) versus gyration angle for 600 kPa ram pressure analyses
except specimen height (which is 0.92). Therefore, it can be concluded that the 100 mm-diameter specimens were prepared in a reliable manner. The stability values are well above 900 kg, see Fig. 6. Therefore, there is no problem about the maximum amount of load the specimen can carry before failure. At gyration numbers below 40 as highlighted
in Fig. 5, the air void values are between 3.395 and 3.790%. Standards dictate that air void values should be between 3 and 5% for an acceptable surface course mixture [7]. The obtained air void values fall well within the limits of the acting standards. Values for voids filled with asphalt should be between 65 and 75% according to the acting standards. In Fig. 5, for 40 gyrations, the value of the voids filled with asphalt is 76.396% which is above the limit. This is a fairly predictable difference when the very different compaction pattern in gyratory compactors is considered. The values of voids in mineral aggregate are well above 14% for the gyra-tion number values less than 40 so the limits of the stand-ards are attained (refer to Fig. 3). According to the General Directorate of Highways, the flow values should lie between 2 and 4 mm for Marshall specimens but as the gyratory com-paction technique is completely different from the previous one, the value of 4.059 mm is understandable and acceptable for 40 gyrations. To be able to arrive at more solid conclu-sions, and because of the nature of gyratory compaction, more specimens with 61.5 mm specimen height were pre-pared and tested mechanically further [8]. Figure 9 shows the correspondence of 61.5 mm height to a gyration number of 40 being analogous with the previous results. Another series of specimens was prepared and mechanically tested to ensure the design gyration number. When Tables 6, 7 and 8 are analysed, it can be visualised that the 40 gyration number can be accepted as the design gyration number for 100 mm-diameter gyratory compactor specimens. The dif-ference in flow, and therefore Marshall Quotient values, is self-explanatory as gyratory compaction is a totally a differ-ent and much better way of simulating the actual compaction processes on site. So, it can be concluded that flow values, by themselves, do not give an actual and completely correct determination of deformation of the specimen before failure.
To further clarify the testing pattern, another series of tests was performed by changing the gyration angle from 1.25° to 1.85° by 0.05° increments with gyration number Fig. 14 Stability versus gyration angle for 600 kPa ram pressure
anal-yses
Fig. 15 Flow versus gyration angle for 600 kPa ram pressure analyses
Fig. 16 Marshall quotient versus gyration angle for 600 kPa ram
pres-sure analyses
Fig. 17 Specimen height versus gyration angle for 600 kPa ram
value of 40. This series of experiments provides a sound basis for the effect of changing the parameter of the angle of gyration. To further check whether changing the gyra-tion angle to values other than 1.25° makes any significant difference, one-way anova analyses were carried out. When the averages of the test results were compared, no changes were seen between 1.25° and the other angles’ test results. This shows the statistical significance of 1.25° as the stand-ard gyration angle value in the gyratory compaction tech-nique. However, there are statistically significant differences
between some of the other two by two comparisons which could be a topic for further research.
Additionally, a completely different pattern of loading was also utilised; 240 kPa, 2° gyration angle, a gyration speed of 30 rpm and a minimum compaction temperature of 145 °C. As can be seen from Table 10 and Figs. 18, 19, 20, 21, 22, 23, 24 and 25, when the gyration number increases, as can be expected, the 100 mm gyratory compactor speci-mens become more densely compacted. As the level of applied stress is much lower than 600 kPa, it is evident that Table 10 The average physical and mechanical test values of gyratory compactor specimens prepared by 240 kPa vertical stress and 2.00° gyra-tion angle analyses with varying gyragyra-tion number
Gyration
number Unit weight (kg/m3) Voids in mineral aggregate (%) Voids filled with asphalt (%) Air voids (%) Stability (kg) Flow (mm) Marshall quo-tient (kg/mm) Specimen height
(mm) 30 2409 16.250 68.664 5.081 909.790 5.020 181.365 63.36 40 2434 15.378 73.314 4.092 1108.656 5.051 219.759 62.45 50 2450 14.828 76.526 3.468 1175.299 4.854 242.548 61.97 60 2463 14.347 79.539 2.923 1029.143 4.809 212.140 61.40 70 2465 14.306 79.814 2.877 1273.392 4.651 275.421 61.41 80 2473 14.012 81.802 2.544 1341.567 4.694 285.749 60.96
Fig. 18 Unit weight versus gyration number for 240 kPa ram pressure and 2° gyration angle analyses
Fig. 19 Voids in mineral aggregate versus gyration number for 240 kPa ram pressure and 2° gyration angle analyses
Fig. 20 Voids filled with asphalt versus gyration number for 240 kPa ram pressure and 2° gyration angle analyses
Fig. 21 (Air voids) versus gyration number for 240 kPa ram pressure
the number of gyrations will be higher to achieve a similar degree of compaction. When Table 11 is examined, it can be seen that 50 gyrations of 240 kPa–2° pattern (with a gyration speed of 30 rpm and at least 145 °C of compaction tempera-ture) is producing similar specimens to the 600 kPa–1.25° pattern. The amount of compactive effort is 25% higher in the low level of stress application and produces very simi-lar specimens. Unit weight values of the two patterns are
approximately the same. Voids in mineral aggregate, voids filled with asphalt and air voids values are again very simi-lar. So, it can be clearly seen that physically, the two sets of specimens have approximately the same quantities. Marshall stability values also correlate in the two different testing protocols in an acceptable manner, but flow values do not. There is approximately a 25% increase in the 240 kPa–2° pattern which deserves attention. Therefore, it can be con-cluded from the data set that when the amount of compactive effort increases, the flow values decrease with the gyration number.
With 50 as the design gyration number obtained from these studies, another set of specimens was tested where the gyration angle was changed from 1.60° to 2.40° (in incre-ments of 0.20°). From these experiincre-ments, it was concluded that it was possible to prepare 100 mm-diameter gyratory compactor specimens in a laboratory environment conform-ing to current standards. When the above Figs. 26, 27, 28, 29, 30, 31, 32 and 33 are examined, it can be seen that when the gyration angle decreases in the same gyration number pattern, the 100 mm gyratory compactor specimens become more densely compacted and therefore the air void values reduce, the unit weight values increase, voids filled with asphalt values increase, stability values also increase by a small amount (as the number of gyrations is the main parameter affecting the stability value) and specimen heights decrease. Again, as in the previous discussions, it is not possible to come to any solid conclusions about the flow and Marshall Quotient values which can be clearly seen in Figs. 31 and 32. This series of experiments provides a sound basis for the effect of changing the parameter of the angle of gyration which in fact is responsible for the further compaction.
The study further tackles the problem of preparing 100 mm-diameter gyratory compactor specimens and shows their superior properties compared to the Marshall speci-mens, especially in terms of being lighter, having more air voids and very similar Marshall stability values. They also Fig. 22 Stability versus gyration number for 240 kPa ram pressure
and 2° gyration angle analyses
Fig. 23 Flow versus gyration number for 240 kPa ram pressure and 2° gyration angle analyses
Fig. 24 Marshall quotient versus gyration number for 240 kPa ram pressure and 2° gyration angle analyses
Fig. 25 Specimen height versus gyration number for 240 kPa ram pressure and 2° gyration angle analyses
Table 11 Average physical and mechanical properties of the specimens prepared with two different compaction techniques
Gyration pattern Unit
weight (kg/m3) Voids in min-eral aggregate (%) Voids filled with asphalt (%)
Air voids (%) Stability (kg) Flow (mm) Marshall quotient (kg/ mm) Specimen height (mm) 50 gyration, 240 kPa 2450 14.828 76.526 3.468 1175.299 4.854 242.548 61.97 40 gyration, 600 kPa 2451 14.763 76.936 3.395 1261.565 4.059 311.174 61.32
Table 12 The average physical and mechanical test values of gyratory compactor specimens prepared with 240 kPa vertical stress and gyration angles varying from 2.40° to 1.60°
Gyration angle Unit weight (kg/ m3)
Voids in mineral
aggregate (%) Voids filled with asphalt (%)
Air voids (%) Stability (kg) Flow (mm) Marshall quotient (kg/ mm) Specimen height (mm) 2.40° 2453 14.728 77.152 3.356 1172.507 4.773 246.205 61.75 2.20° 2450 14.828 76.526 3.468 1175.299 4.854 242.548 61.97 2.00° 2453 14.714 77.218 3.340 1209.365 4.788 253.814 61.81 1.80° 2435 15.330 73.591 4.037 1152.817 4.800 240.191 62.13 1.60° 2425 15.674 71.675 4.427 1101.813 4.884 225.843 62.32
Fig. 26 Unit weight versus gyration angle for 240 kPa ram pressure analyses
Fig. 27 Voids in mineral aggregate versus gyration angle for 240 kPa ram pressure analyses
Fig. 28 Voids filled with asphalt versus gyration angle for 240 kPa
ram pressure analyses
Fig. 29 Air voids versus gyration angle for 240 kPa ram pressure analyses
serve as a much better method of simulation of compac-tion on site (one has to bear in mind that the flow values of gyratory compactor specimens are higher than Marshall specimens because of the completely different compaction pattern). These gyratory compactor specimens can be modi-fied with polymer modifiers to visualise the effect of modifi-cation. New design gyration numbers can then be obtained from these new samples. Also, the rutting susceptibility of these mixtures can be studied with universal testing systems
for both reference and polymer modified 100 mm gyratory compactor specimens.
Acknowledgements The authors would also like to thank Prof. Dr. Ayşen Dener Akkaya for her help in the statistical analysis part of the study.
Funding This study was supported by Anadolu University Research Fund with Grant no. 08.02.38.
References
1. Roberts FL, Mohammad LN, Wang LB (2002) History of hot mix asphalt mixture design in the United States. J
Mater Civ Eng 14(4):279–293. https ://doi.org/10.1061/
(asce)0899-1561(2002)14:4(279)
2. Khan ZA, Wahab HIA, Asi I, Ramadhan R (1998) Comparative study of asphalt concrete laboratory compaction methods to
simu-late field compaction. Constr Build Mater 12(6–7):373–384. https
://doi.org/10.1016/s0950 -0618(98)00015 -4
3. Buchanan M, Brown E (2001) Effect of superpave gyratory com-pactor type on compacted hot-mix asphalt density. Transp Res Rec
J Transp Res Board 1761:50–60. https ://doi.org/10.3141/1761-07
4. Asi IM (2007) Performance evaluation of SUPERPAVE and Marshall asphalt mix designs to suite Jordan climatic and
traf-fic conditions. Constr Build Mater 21(8):1732–1740. https ://doi.
org/10.1016/j.conbu ildma t.2006.05.036
5. Lee S-J, Amirkhanian SN, Kwon S-Z (2008) The effects of com-paction temperature on CRM mixtures made with the SGC and the Marshall compactor. Constr Build Mater 22(6):1122–1128.
https ://doi.org/10.1016/j.conbu ildma t.2007.03.003
6. Jackson NM, Czor LJ (2003) 100-mm-Diameter mold used with superpave gyratory compactor. J Mater Civ Eng 15(1):60–66.
https ://doi.org/10.1061/(asce)0899-1561(2003)15:1(60)
7. General Directorate of Highways (2006) Highway technical speci-fications, Item No. 170/2, Ankara, Turkey
8. Keskin M (2011) Determining physical and mechanical differ-ences of asphalt specimens using Superpave and Marshall design methods. MS thesis, Anadolu University, Eskişehir, Turkey (in
Turkish)
9. IPC Servopac Gyratory Compactor Use Manual (2009) IPC Global, Boronia, Australia
Fig. 30 Stability versus gyration angle for 240 kPa ram pressure
anal-yses
Fig. 31 Flow versus gyration angle for 240 kPa ram pressure analyses
Fig. 32 Marshall quotient versus gyration angle for 240 kPa ram pres-sure analyses
Fig. 33 Specimen height versus gyration angle for 240 kPa ram pres-sure analyses
1 3
10. Tapkın S (2008) The effect of polypropylene fibers on asphalt
performance. Build Environ 43(6):1065–1107. https ://doi.
org/10.1016/j.build env.2007.02.011
11. Tapkın S, Uşar Ü, Tuncan A, Tuncan M (2009) Repeated creep behavior of polypropylene fiber-reinforced bituminous mixtures.
J Transp Eng ASCE 135(4):240–249. https ://doi.org/10.1061/
(ASCE)0733-947X(2009)135:4(240)
12. Tapkın S, Çevik A, Uşar Ü (2009) Accumulated strain predic-tion of polypropylene modified marshall specimens in repeated creep test using artificial neural networks. Expert Syst Appl
36(8):11186–11197. https ://doi.org/10.1016/j.eswa.2009.02.089
13. Tapkın S, Çevik A, Uşar Ü (2010) Prediction of Marshall test results for polypropylene modified dense bituminous mixtures
using neural networks. Expert Syst Appl 37(6):4660–4670. https
://doi.org/10.1016/j.eswa.2009.12.042
14. Tapkın S, Özcan Ş (2012) Determination of the optimal poly-propylene fiber addition to the dense bituminous mixtures by the aid of mechanical and optical means. Balt J Road Bridge Eng
7(1):22–29. https ://doi.org/10.3846/bjrbe .2012.03
15. Tapkın S, Keskin M (2013) Rutting analysis of 100 mm diameter polypropylene modified asphalt specimens using gyratory and Marshall compactors. Mater Res Iberoam J Mater 16(2):546–564.
https ://doi.org/10.1590/S1516 -14392 01300 50000 16
16. Tapkın S (2013) Optimal polypropylene fiber amount determi-nation by using gyratory compaction, static creep and Marshall stability and flow analyses. Constr Build Mater 44(7):399–410.
https ://doi.org/10.1016/j.conbu ildma t.2013.02.060
17. Tapkın S, Şengöz B, Şengül G, Topal A, Özçelik E (2015) Esti-mation of polypropylene concentration of modified bitumen images by using k-NN and SVM classifiers. J Comput Civ Eng
ASCE 29(5):04014055. https
://doi.org/10.1061/(ASCE)CP.1943-5487.00003 53
18. Tapkın S, Uşar Ü, Özcan Ş, Çevik A (2011) Polymer modified bitumen: properties and characterisation. In: McNally T (ed) Polypropylene fiber-reinforced bitumen. Woodhead Publishing, Cambridge, pp 136–194 (ISBN:0857090488)
19. Oliver J, Alderson A, Milne P (2008) A review of Austroads gyra-tory compaction research. Austroads Report, Sydney