Ankara Üniversitesi Çevrebilimleri Dergisi
5(1), 1-12 (2013)
Regionalized Scientific Networks in the South-East European
Mountains: A Social Network Analysis Approach
Güneydoğu Avrupa Dağlarında Bölgesel Bilimsel Ağlar:
Bir Sosyal Ağ Analizi Yaklaşımı
Gilles RUDAZ
University of Geneva, Department of Geography and Environment, Geneva, Switzerland
Abstract: The regional approach is more and more promoted as a relevant scale to address environmental and sustainability issues. Science and scientific actors, here conceived as political actors among others, play in many cases an essential role in supporting these regional political initiatives. Such is the case for the mountains of South-East Europe. This paper focuses on a specific organization named the “Southeastern European Mountain Research network”. This prospective paper aims to highlight patterns of organization of the network. Through a social network analysis approach, it shows that the countries where actors work and the scientific branches of these actors play a role in the structuration of the network. It also shows the leadership of some countries. The analysis also shows how the scientific network does not limit itself to research but also aims to contribute to the implementation of sustainable strategies in the region.
Key words: mountains, South-East Europe, research, science, network, social network analysis, science-policy.
Özet: Bölgesel yaklaşım çevre ve sürdürülebilirlik çalışmalarındaki uygunluğu nedeniyle giderek daha fazla kullanılmaktadır. Güneydoğu Avrupa Dağları örneğinde olduğu gibi, bilim ve bilimsel aktörler, diğer siyasi aktörlerin yanısıra, bölgesel siyasi girişimlerin desteklenmesinde birçok durumda önemli rol oynamışlardır. Bu makale «Güneydoğu Avrupa Dağ Araştırma Ağı» olarak adlandırılan özel bir organizasyona odaklanmıştır. Amaç ağın organizasyonunun örüntülerini vurgulamaktır. Sosyal ağ analizi yaklaşımı ülkelerdeki aktörlerin çalışmaları ve ait oldukları bilim dallarının ağ yapısının oluşmasında rol oynadığını göstermiştir. Ayrıca, bazı ülkelerin liderliği de ortaya çıkmıştır. Analiz, bilimsel ağın araştırmalarında kendisine bir kısıtlama getirmediğini aynı zamanda bölgedeki sürdürülebilir stratejilerinin uygulamalarına katkıda bulunmayı amaçladığını göstermiştir.
Anahtar sözcükler: dağlar, Güneydoğu Avrupa, araştırma, bilim, network, sosyal network analizi, bilim-siyaset.
1. Introduction
There is a consensus that environmental issues do not know borders. Therefore, the capacity of the national level to tackle this type of issues on its own is challenged in numerous cases. The greatest illustration has been the emergence of global concerns for the environment calling for international action (Zimmerer, 2006; O'Neill, 2009). This trend was initiated at least since the United Nations
Conference on the Human Environment held in Stockholm in 1972. Also challenging the handling by
the sole national administrations, the regional approach is more and more identified as offering major opportunities to address environmental and sustainability issues (Van de Veer and Balsiger, 2012). It is important here to state that there is no such thing as an ideal overall best scale. Indeed, each scale has its own strengths and weaknesses. Also, the mobilized scale depends on the issues that are at aim. Both observations support the view of multilevel governance (Vogler, 2003).
In this promotion of the regional approach, mountains emerged as promising laboratories. Indeed, numerous national borders were fixed on mountain ridges, legitimizing emerging states by inscribing their limits in the topography, and thus, naturalizing these political constructions (Debarbieux and Rudaz, 2010). After having been conceived as "barriers", especially with the establishment of Nation-States in the 19th century, mountains have appeared recently as "bridges" between countries. The International Convention on the Protection of the Alps, commonly named
Alpine Convention, initiated the way. Launched in 1991 and signed by the eight alpine states and the European Union, this is the first international treaty promoting cooperation for sustainable mountain development. The Carpathians followed closely the example and other mountain regions are considering taking a similar path. The background document for sustainable mountain development at the global level is Chapter 13, “Managing Fragile Ecosystems: Sustainable Mountain Development” of Agenda 21, the action plan arising from the 1992 United Nations Conference on Environment and Development. In it, the importance of the regional approach is stressed (United Nations, 1992, chapter 13, paragraph 5.e.). The opportunity of regional cooperation as a tool for sustainable mountain development was further emphasized during the recent Rio+20 Conference (United Nations, 2012, § 211; Kohler et al., 2012). The Department of geography and environment at the University of Geneva has launched several projects to assess the potential of this regional institutional arrangement to promote sustainability strategies in mountain areas.
Science-policy interaction is the general theme that this paper addresses. The politics of science could be considered in a double perspective. First, scientific discourses are mobilized by policy makers as rationale for regionalization. Second, scientists also have to be conceived as political actors, i.e. as players in the process of regionalization and sometimes even as advocates of regional political initiatives. These perspectives challenge the orthodox view that considers science as a neutral and objective activity, separated from the political world (Forsyth, 2003; Keller, 2009). Indeed, Science and Technology Studies showed that science is a fundamental legitimizing tool of regulatory practice (Jasanoff, 1990). Regarding mountains, scientists played a key role in putting these areas on the world's agenda (Rudaz, 2011). Observation through various mountain ranges shows that science has been widely involved in these processes of regionalization. In some cases, regional initiatives are supported by the creation of regional scientific network, therefore participating to this process of regionalization. This is the case for South-East Europe, which is the area on which focuses this paper. For more than a decade, there have been several attempts to promote a regional approach in the mountain of Southeastern Europe, which will be briefly reviewed later. In connection to this process, a “Southeastern European Mountain Research network” (SEEmore) was created. This prospective paper aims to highlight patterns of organization of this network. It analyses how scientific disciplines affiliation and countries of residence influence the structuration of the network. It also aims to assess the motivation of members for joining the network and to better understand the science policy interaction.
The article proceeds as follows. It starts with a brief overview of regional mountain initiatives in the Southeastern European mountains and present the “Southeastern European Mountain Research network”. Then, it introduces a survey that was launched within the network. Finally, the results are discussed.
2. The Mountains of South-East Europe
The origins of promoting regional cooperation within the mountains of South-East Europe can be traced back to the early 2000's. Indeed, mountains gained a political momentum in 2000 with the creation of several national mountain organizations in the region. The process was supported by the Swiss Mountain Group (SAB) and the Swiss Agency for Development and Cooperation (SDC). The lobbying structuration went one step further with the creation in 2002 of a structure named "BalkanDesk" and based in Brussels. Integrated within the mountain lobby Euromontana, the Desk aims to bring the voices of the Balkan mountains to the European Union, which explains its geographical location in the EU "capital". The denomination "Balkans" raised some concerns, due to depreciative images related to the term. Therefore, more and more often the more consensual denomination of South-East Europe is often privileged.
The first discussion regarding a regional mountain convention for South-East Europe emerged during the second meeting of the Mountain Partnership held in Quito, Ecuador, in October 2004. During the event, the United Nations Environment Programme (UNEP), the European Academy of Bolzano (EURAC) and the Association for Sustainable Development of Mountain Regions in the Republic of Macedonia (Makmontana) discussed the idea to launch a "Balkan Mountain Initiative", a
sort of Alpine Convention for South-East Europe. This background shows the international context the initiative fitted in and its relation with a global mountain agenda (Rudaz, 2011). This initiative for the Balkans relied on two widely publicized international regional mountain agreements: The Alpine Convention (1991) and the Carpathian Convention (2003). As a follow-up of the Quito conference, on the 24 of December 2004, the Ministry of environment and physical planning of the FYR Macedonia asked support from the UNEP to launch an intergovernmental consultation on regional cooperation for the protection and sustainable development of mountain regions in Southeastern Europe, i.e. the launch of a Balkan Mountain Convention policy process. Even though a regional mountain convention is no yet in place, there have been some promising high-level political steps towards such an instrument. Several statements on regional cooperation for the sustainable development of the mountain regions in South Eastern Europe were made, like the ones that were outcomes of the workshop: “Sharing the experience – Capacity Building on Legal Instruments for the Protection and Sustainable Development of Mountain Regions in South Eastern Europe” (2005, Bolzano, Italy) or of the “Intergovernmental Consultation on Cooperation for the Protection and Sustainable Development of Mountain Regions in South Eastern Europe” (2006, Pelister, FYR Macedonia). In late 2006, a legal framework for the protection and sustainable development of mountain regions in Southeastern Europe was prepared. Finally, the initiative was further promoted at the 6th European Ministerial Conference “Environment for Europe”, held in Belgrade, Serbia, in October 2007. Since then, the process slowed down – not to stay came to a stop –, mainly because of lack of funding and to political tensions in relation to the history of the region. Several initiatives came to support the idea to have a regional approach, like the creation in 2005 of the Balkan Foundation for Sustainable Development, the launch by UNEP of the Dinaric Arc and Balkans Environment Outlook (DABEO), or the assessment of mountain policies in the Balkans carried out within the frame of a Food and Agricultural Organization of the United Nations' program entitled SARD-M. Despite a promising start, the proposal of a SEE mountain convention has not been materialized yet.
The “Southeastern European Mountain Research network” (SEEmore), which is the core case study of this paper, is clearly connected to these political processes of promoting sustainability strategies at the scale of the South-Eastern European mountains. SEEmore finds its origins in the international conference “Identifying the research basis for sustainable development of the mountain regions in Southeastern Europe”, held in April 2009, in Borovets, Bulgaria. The event was organized by the Institute of Geography of the Bulgarian Academy of Sciences, and with the support of the Austrian Science and Research Liaison Office (Ljubljana and Sofia). The title of the conference clearly illustrates its connection with the policy world, as it aims at defining sustainability strategies for the region. The connection with a proposal of a regional mountain convention was a central motive for the organizers of the conference. The main outcome of the Borovets conference was the creation of SEEmore. Two conferences have currently followed up the Borovets conference, one held in August 2010 in Timisoara, Romania, and one held in July 2012 in Ankara, Turkey.
SEEmore brings together researchers working in the mountain regions of Albania, Bosnia and Herzegovina, Bulgaria, Croatia, Greece, FYR Macedonia, Montenegro, Romania, Serbia, Slovenia, and Turkey. There are also members from other countries, but working on the region. It is a regional node of the Mountain Research Initiative, which is an international scientific action promoting and coordinating global change research in mountain regions all over the world. By facilitating communication among researchers working on the regions, SEEmore aims to support the development of research partnerships and proposals, to facilitate publications, access to research funds. Finally, it also aims to support the implementation of sustainable development and conservation strategies in the mountains of South-East Europe.
3. Methodology
A survey was launched to better assess the organization of scientific activities relating to the Southeastern European mountains. The survey included eighteen questions focusing on opportunities and impediments related to scientific cooperation in the region, as well as on the science-policy interaction.
The existence of "Who is who list in SEE mountain research" was a fantastic opportunity to reach to the specified scientific community. Indeed, in the process of structuring SEEmore, the elaboration of a list of researchers carrying out their professional activity on the mountains of the region was identified as a fundamental step by the promoters of the network. An analysis of the "Who is who list in SEE mountain research" shows the following distribution by countries: Romania 29%; Bulgaria 19%; Croatia 10%; Greece 8%; Slovenia 7%; Turkey 6%; Serbia 3%; Austria 3%; Albania 3%; Switzerland 3%; Bosnia-Herzegovina 3%; FYR Macedonia 2%; other countries 4%.
The survey was launched to all the members of the who is who list, i.e. 268 at the time of the survey. The survey ran between April 3 and May 6, 2012. 65 people replied to the survey. The author made a presentation of the preliminary results at the third conference of SEEmore, held at the University of Ankara, in July 2012. This was taken as an opportunity to further promote the survey and increase the participation to the survey, and thus, the timeline for the participating to the survey was extended. The survey was closed late July and the final number of respondents to the survey came up to 74, all members of the who is who list.
One of the aims of the survey is to better understand how the network is organized. Social network analysis (SNA) aims to better understand how actors are connected. Basically, a network is conceived as a set of nodes related with ties, or, because it focuses on social system, as a set of actors connected by relations (Wasserman and Faust, 1999; Knoke and Yang, 2008). By revealing the overall structure of the network and the various positioning of actors in it, the SNA gives insights about how information flows among the actors. This approach helps identifying the key players and who is influential and thus, provides inputs to understand the policy formation process (Nechodom, 2005). With this purpose of using the social network analysis approach a specific question was put in the survey and labeled as follows:
“Name the five persons with whom you have interacted the most regularly in the context of your work in the SEE mountains. It does not matter whether these persons work in the same country as you or in another country, and whether these persons are listed on the "Who is who in Southeastern European mountain research" or not”.
In social sciences, this name generating technics is referred to as "snowball sampling". The initial task before launching a social network analysis is to identify the "population" and to set its limits. We took the "Who is who list in Southeastern European mountain research" as the population; but as we will see it extends beyond the SEEmore network, as participants to the survey could mention people beyond the list. The software UCInet was used to process the data gathered through the survey (Borgatti, Everett, and Freeman, 2004). To process the software, data has to be organized as a matrix coded in binary way with the 1 indicating a relation and 0 no relation. Then, thanks to the survey, we could put attributes to the nodes, i.e. info about the networked actors. For instance, we wanted to test the hypotheses that the country of work and the scientific branches have impact of the structure of the network and thus, on the flow of information among the actors.
4. Research findings
The SNA question asked people with whom they "have interacted the most regularly" in the context of their work in the SEE mountains. Therefore people did not need to mention partners necessarily in the who is who list. People who participated to the survey are indicated as A and people who were mentioned by respondents as person with whom they are collaborating but themselves did no reply to the survey are indicated as B. After collection of the data, a matrix 246x246 was obtained, composed of 74 As and 172 Bs.
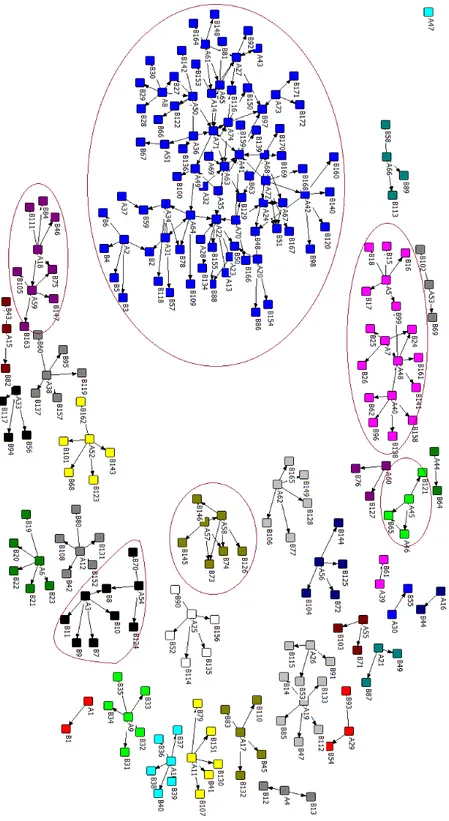
As stated in the methodological part, the SNA allows seeing how actors are "embedded" in the overall network. The general picture of the network does not show a fully integrated network, i.e. a network where it would be possible to reach any nodes of the network by at least one path. Indeed 34
subnetworks are revealed. Some of these subnetworks are in fact just one respondent mentioning five or less people with whom he is collaborating. There are six "subnetworks" with two As. These are highlighted in the following graph. Among those six, there are only two of them who have more than two As. The biggest subnetwork is composed of 85 nodes and the second of 18 nodes. The colors in the graph do not have particular meaning. They are juts used to reveal the various subnetworks.
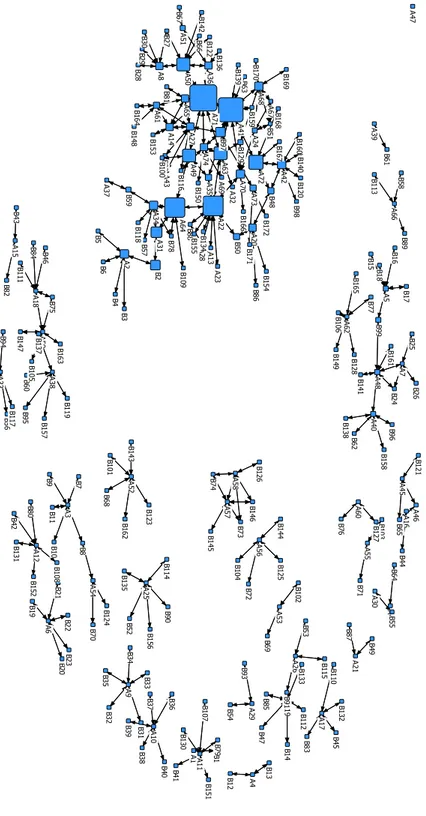
Social network analysis helps to identify the key players of the network. In SNA, it is referred to as "centrality", "which measures the extent to which a node connects to all to other nodes in a social network" (Knoke and Yang, 2008, 63). Classic centrality just calculates the number of ties. It means that the more a member has ties, the more he can be considered as central. Illustration 2: centrality A 1 A 2 A 3 A 4 A 5 A 6 A 7 A 8 A 9 A 1 0 A 1 1 A 1 2 A 1 3 A 1 4 A 1 5 A 1 6 A 1 7 A 1 8 A 1 9 A 2 0 A 2 1 A 2 2 A 2 3 A 2 4 A 2 5 A 2 6 A 2 7 A 2 8 A 2 9 A 3 0 A 3 1 A 3 2 A 3 3 A 3 4 A 3 5 A 3 6 A 3 7 A 3 8 A 3 9 A 4 0 A 4 1 A 4 2 A 4 3 A 4 4 A 4 5 A 4 6 A 4 7 A 4 8 A 4 9 A 5 0 A 5 1 A 5 2 A 5 3 A 5 4 A 5 5 A 5 6 A 5 7 A 5 8 A 5 9 A 6 0 A 6 1 A 6 2 A 6 3 A 6 4 A 6 5 A 6 6 A 6 7 A 6 8 A 6 9 A 7 0 A 7 1 A 7 2 A 7 3 A 7 4 B 1 B 2 B 3 B 4 B 5 B 6 B 7 B 8 B 9 B 1 0 B 1 1 B 1 2 B 1 3 B 1 4 B 1 5 B16 B 1 7 B 1 8 B 1 9 B 2 0 B 2 1 B 2 2 B 2 3 B 2 4 B 2 5 B 2 6 B 2 7 B 2 8 B 2 9 B 3 0 B 3 1 B 3 2 B3 3 B 3 4 B 3 5 B 3 6 B 3 7 B 3 8 B39 B 4 0 B 4 1 B 4 2 B 4 3 B 4 4 B 4 5 B 4 6 B 4 7 B 4 8 B 4 9 B 5 0 B 5 1 B 5 2 B 5 3 B 5 4 B 5 5 B 5 6 B 5 7 B 5 8 B 5 9 B 6 0 B 6 1 B 6 2 B 6 3 B 6 4 B 6 5 B 6 6 B 6 7 B 6 8 B 6 9 B 7 0 B 7 1 B 7 2 B 7 3 B 7 4 B 7 5 B 7 6 B 7 7 B 7 8 B 7 9 B 8 0 B 8 1 B 8 2 B 8 3 B 8 4 B 8 5 B 8 6 B 8 7 B 8 8 B 8 9 B 9 0 B 9 1 B 9 2 B 9 3 B 9 4 B 9 5 B 9 6 B 9 7 B 9 8 B 9 9 B 1 0 0 B 1 0 1 B 1 0 2 B 1 0 3 B 1 0 4 B 1 0 5 B 1 0 6 B 1 0 7 B 1 0 8 B 1 0 9 B 1 1 0 B 1 1 1 B 1 1 2 B 1 1 3 B 1 1 4 B 1 1 5 B 1 1 6 B 1 1 7 B 1 1 8 B 1 1 9 B 1 2 0 B 1 2 1 B 1 2 2 B 1 2 3 B 1 2 4 B 1 2 5 B 1 2 6 B 1 2 7 B 1 2 8 B 1 2 9 B 1 3 0 B 1 3 1 B 1 3 2 B 1 3 3 B 1 3 4 B 1 3 5 B 1 3 6 B 1 3 7 B1 3 8 B 1 3 9 B 1 4 0 B 1 4 1 B 1 4 2 B 1 4 3 B 1 4 4 B 1 4 5 B 1 4 6 B 1 4 7 B 1 4 8 B 1 4 9 B 1 5 0 B 1 5 1 B 1 5 2 B 1 5 3 B 1 5 4 B 1 5 5 B 1 5 6 B 1 5 7 B 1 5 8 B 1 5 9 B 1 6 0 B 1 6 1 B 1 6 2 B 1 6 3 B 1 6 4 B 1 6 5 B 1 6 6 B 1 6 7 B 1 6 8 B 1 6 9 B 1 7 0 B 1 7 1 B 1 7 2
Centrality is not all that matters and the ability to connect various actors is just as important. Indeed, as the research object is a network, the actors that mediate relations between other actors play an essential role in the organization of the network. In SNA, it is referred as betweeness, which "measures the extent to which other actors lie on the geodesic path (shortest distance) between pair of actors in the network" (Knoke and Yang, 2008, 67).
Illustration 3: betweeness A 1 A 2 A 3 A 4 A 5 A 6 A 7 A 8 A 9 A 1 0 A 1 1 A 1 2 A 1 3 A 1 4 A 1 5 A 1 6 A 1 7 A 1 8 A 1 9 A 2 0 A 2 1 A 2 2 A 2 3 A 2 4 A 2 5 A 2 6 A 2 7 A 2 8 A 2 9 A 3 0 A 3 1 A 3 2 A 3 3 A 3 4 A 3 5 A 3 6 A 3 7 A 3 8 A 3 9 A 4 0 A 4 1 A 4 2 A 4 3 A 4 4 A 4 5 A 4 6 A 4 7 A 4 8 A 4 9 A 5 0 A 5 1 A 5 2 A 5 3 A 5 4 A 5 5 A 5 6 A 5 7 A 5 8 A 5 9 A 6 0 A 6 1 A 6 2 A 6 3 A 6 4 A 6 5 A 6 6 A 6 7 A 6 8 A 6 9 A 7 0 A 7 1 A 7 2 A 7 3 A 7 4 B 1 B 2 B 3 B 4 B 5 B 6 B 7 B 8 B 9 B 1 0 B 1 1 B 1 2 B 1 3 B 1 4 B 1 5 B 1 6 B 1 7 B 1 8 B 1 9 B 2 0 B 2 1 B 2 2 B 2 3 B 2 4 B 2 5 B 2 6 B 2 7 B 2 8 B 2 9 B 3 0 B 3 1 B 3 2 B 3 3 B 3 4 B 3 5 B 3 6 B 3 7 B 3 8 B 3 9 B 4 0 B41 B 4 2 B 4 3 B 4 4 B 4 5 B 4 6 B 4 7 B 4 8 B 4 9 B 5 0 B 5 1 B 5 2 B5 3 B 5 4 B 5 5 B 5 6 B 5 7 B 5 8 B 5 9 B 6 0 B 6 1 B 6 2 B 6 3 B 6 4 B 6 5 B 6 6 B 6 7 B 6 8 B 6 9 B 7 0 B 7 1 B 7 2 B 7 3 B 7 4 B 7 5 B 7 6 B 7 7 B 7 8 B 7 9 B 8 0 B 8 1 B 8 2 B 8 3 B 8 4 B 8 5 B 8 6 B 8 7 B 8 8 B 8 9 B 9 0 B 9 1 B 9 2 B 9 3 B 9 4 B 9 5 B 9 6 B 9 7 B 9 8 B 9 9 B 1 0 0 B 1 0 1 B 1 0 2 B 1 0 3 B 1 0 4 B 1 0 5 B 1 0 6 B 1 0 7 B 1 0 8 B 1 0 9 B 1 1 0 B 1 1 1 B 1 1 2 B 1 1 3 B 1 1 4 B 1 1 5 B 1 1 6 B 1 1 7 B 1 1 8 B 1 1 9 B 1 2 0 B 1 2 1 B 1 2 2 B 1 2 3 B 1 2 4 B 1 2 5 B 1 2 6 B 1 2 7 B 1 2 8 B 1 2 9 B 1 3 0 B 1 3 1 B 1 3 2 B 1 3 3 B 1 3 4 B 1 3 5 B 1 3 6 B 1 3 7 B 1 3 8 B 1 3 9 B 1 4 0 B 1 4 1 B 1 4 2 B 1 4 3 B 1 4 4 B 1 4 5 B 1 4 6 B 1 4 7 B 1 4 8 B 1 4 9 B 1 5 0 B 1 5 1 B 1 5 2 B 1 5 3 B 1 5 4 B 1 5 5 B 1 5 6 B 1 5 7 B 1 5 8 B 1 5 9 B 1 6 0 B 1 6 1 B 1 6 2 B 1 6 3 B 1 6 4 B 1 6 5 B 1 6 6 B 1 6 7 B 1 6 8 B 1 6 9 B 1 7 0 B 1 7 1 B 1 7 2
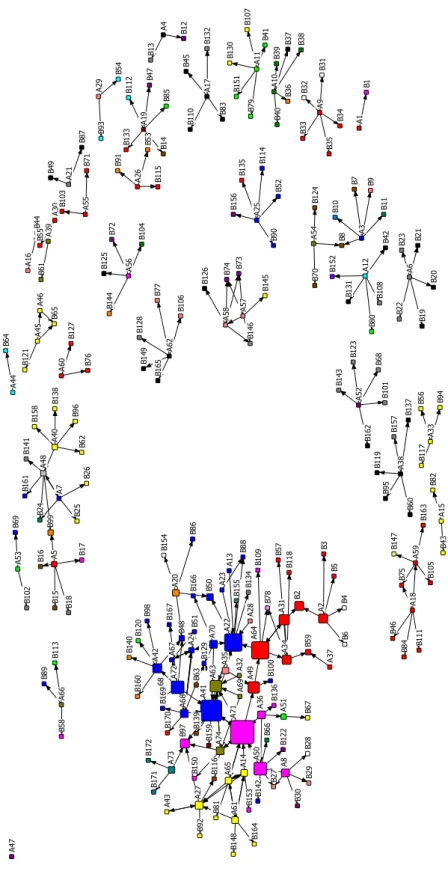
In an ideal international scientific network, the countries of work should have no impact on the patterns of organization of the network as the approach should be regional, i.e. collaborating beyond borders. However, for easily understandable political and practical reasons, the analysis by countries shows that the country of work plays a role. One could observe a strong presence of Bulgaria and Romania.
Illustration 4: countries (Blue – Bulgarie; yellow-Greece; Red-Romania; Kaki- Turkey; Rose flashy-Switzerland; Brown – UK; Purple-Serbia; Orange –Germany; White- France; Rose clear-Austria)
A 1 A 2 A 3 A 4 A 5 A 6 A 7 A 8 A 9 A 1 0 A 1 1 A 1 2 A 1 3 A 1 4 A 1 5 A 1 6 A 1 7 A 1 8 A 1 9 A 2 0 A 2 1 A 2 2 A 2 3 A 2 4 A 2 5 A 2 6 A 2 7 A 2 8 A 2 9 A 3 0 A 3 1 A 3 2 A 3 3 A 3 4 A 3 5 A 3 6 A 3 7 A 3 8 A 3 9 A 4 0 A 4 1 A 4 2 A 4 3 A 4 4 A 4 5 A 4 6 A 4 7 A 4 8 A 4 9 A 5 0 A 5 1 A 5 2 A 5 3 A 5 4 A 5 5 A 5 6 A 5 7 A 5 8 A 5 9 A 6 0 A 6 1 A 6 2 A 6 3 A 6 4 A 6 5 A 6 6 A 6 7 A 6 8 A 6 9 A 7 0 A 7 1 A 7 2 A 7 3 A 7 4 B 1 B 2 B 3 B 4 B 5 B 6 B 7 B 8 B 9 B 1 0 B 1 1 B 1 2 B 1 3 B 1 4 B 1 5 B 1 6 B 1 7 B 1 8 B 1 9 B 2 0 B 2 1 B 2 2 B 2 3 B 2 4 B 2 5 B 2 6 B 2 7 B 2 8 B 2 9 B 3 0 B 3 1 B 3 2 B 3 3 B 3 4 B 3 5 B 3 6 B 3 7 B 3 8 B 3 9 B 4 0 B 4 1 B 4 2 B 4 3 B 4 4 B 4 5 B 4 6 B 4 7 B 4 8 B 4 9 B 5 0 B 5 1 B 5 2 B 5 3 B 5 4 B 5 5 B 5 6 B 5 7 B 5 8 B 5 9 B 6 0 B 6 1 B 6 2 B 6 3 B 6 4 B 6 5 B 6 6 B 6 7 B 6 8 B 6 9 B 7 0 B 7 1 B 7 2 B 7 3 B 7 4 B 7 5 B 7 6 B 7 7 B 7 8 B 7 9 B 8 0 B 8 1 B 8 2 B 8 3 B 8 4 B 8 5 B 8 6 B 8 7 B 8 8 B 8 9 B 9 0 B 9 1 B 9 2 B 9 3 B 9 4 B 9 5 B 9 6 B 9 7 B 9 8 B 9 9 B 1 0 0 B 1 0 1 B 1 0 2 B 1 0 3 B 1 0 4 B 1 0 5 B 1 0 6 B 1 0 7 B 1 0 8 B 1 0 9 B 1 1 0 B 1 1 1 B 1 1 2 B 1 1 3 B 1 1 4 B 1 1 5 B 1 1 6 B 1 1 7 B 1 1 8 B 1 1 9 B 1 2 0 B 1 2 1 B 1 2 2 B 1 2 3 B 1 2 4 B 1 2 5 B 1 2 6 B 1 2 7 B 1 2 8 B 1 2 9 B 1 3 0 B 1 3 1 B 1 3 2 B 1 3 3 B 1 3 4 B 1 3 5 B 1 3 6 B 1 3 7 B 1 3 8 B 1 3 9 B 1 4 0 B 1 4 1 B 1 4 2 B 1 4 3 B 1 4 4 B 1 4 5 B 1 4 6 B 1 4 7 B 1 4 8 B 1 4 9 B 1 5 0 B 1 5 1 B 1 5 2 B 1 5 3 B 1 5 4 B 1 5 5 B 1 5 6 B 1 5 7 B1 5 8 B 1 5 9 B 1 6 0 B 1 6 1 B 1 6 2 B 1 6 3 B 1 6 4 B 1 6 5 B 1 6 6 B 1 6 7 B 1 6 8 B 1 6 9 B 1 7 0 B 1 7 1 B 1 7 2
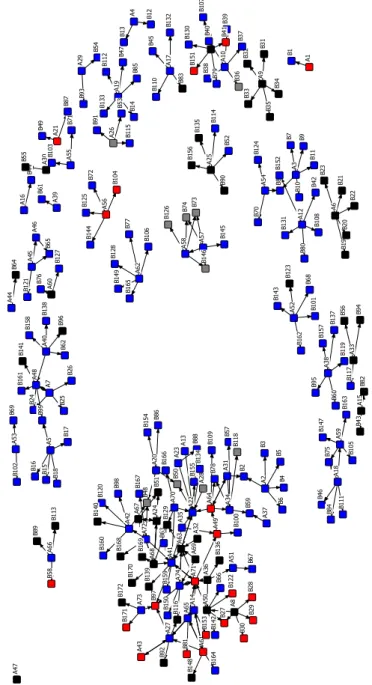
The following graph crosses the data on country with the degree of betweeness.
Illustration 5: countries and betweeness
A1 A 2 A 3 A 4 A5 A6 A 7 A 8 A 9 A 1 0 A1 1 A 1 2 A1 3 A1 4 A 1 5 A 1 6 A 1 7 A1 8 A 1 9 A 2 0 A2 1 A2 2 A 2 3 A 2 4 A 2 5 A 2 6 A 2 7 A2 8 A 2 9 A 3 0 A 3 1 A3 2 A3 3 A3 4 A 3 5 A 3 6 A 3 7 A 3 8 A 3 9 A 4 0 A 4 1 A 4 2 A4 3 A 4 4 A 4 5 A 4 6 A4 7 A4 8 A 4 9 A5 0 A 5 1 A 5 2 A5 3 A 5 4 A 5 5 A 5 6 A 5 7 A 5 8 A5 9 A 6 0 A6 1 A 6 2 A6 3 A 6 4 A 6 5 A6 6 A 6 7 A6 8 A 6 9 A 7 0 A7 1 A 7 2 A 7 3 A 7 4 B 1 B 2 B 3 B 4 B 5 B 6 B 7 B 8 B 9 B 1 0 B 1 1 B 1 2 B 1 3 B 1 4 B 1 5 B 1 6 B1 7 B 1 8 B 1 9 B 2 0 B 2 1 B 2 2 B 2 3 B 2 4 B 2 5 B 2 6 B 2 7 B 2 8 B 2 9 B 3 0 B 3 1 B 3 2 B 3 3 B 3 4 B 3 5 B 3 6 B 3 7 B 3 8 B 3 9 B 4 0 B 4 1 B 4 2 B 4 3 B 4 4 B 4 5 B 4 6 B 4 7 B 4 8 B 4 9 B 5 0 B 5 1 B 5 2 B 5 3 B 5 4 B 5 5 B 5 6 B 5 7 B 5 8 B 5 9 B 6 0 B 6 1 B 6 2 B 6 3 B 6 4 B 6 5 B 6 6 B 6 7 B 6 8 B 6 9 B 7 0 B 7 1 B 7 2 B 7 3 B 7 4 B 7 5 B 7 6 B 7 7 B 7 8 B 7 9 B 8 0 B 8 1 B 8 2 B 8 3 B 8 4 B 8 5 B 8 6 B 8 7 B 8 8 B 8 9 B 9 0 B 9 1 B 9 2 B 9 3 B 9 4 B 9 5 B 9 6 B 9 7 B 9 8 B 9 9 B 1 0 0 B 1 0 1 B 1 0 2 B 1 0 3 B 1 0 4 B 1 0 5 B 1 0 6 B 1 0 7 B 1 0 8 B 1 0 9 B 1 1 0 B 1 1 1 B 1 1 2 B 1 1 3 B 1 1 4 B 1 1 5 B 1 1 6 B 1 1 7 B 1 1 8 B 1 1 9 B 1 2 0 B 1 2 1 B 1 2 2 B 1 2 3 B 1 2 4 B 1 2 5 B 1 2 6 B 1 2 7 B 1 2 8 B 1 2 9 B 1 3 0 B 1 3 1 B 1 3 2 B 1 3 3 B 1 3 4 B 1 3 5 B 1 3 6 B 1 3 7 B 1 3 8 B 1 3 9 B 1 4 0 B 1 4 1 B 1 4 2 B 1 4 3 B 1 4 4 B 1 4 5 B 1 4 6 B 1 4 7 B 1 4 8 B 1 4 9 B 1 5 0 B 1 5 1 B 1 5 2 B 1 5 3 B 1 5 4 B 1 5 5 B 1 5 6 B 1 5 7 B 1 5 8 B 1 5 9 B 1 6 0 B 1 6 1 B 1 6 2 B 1 6 3 B 1 6 4 B 1 6 5 B 1 6 6 B 1 6 7 B 1 6 8 B 1 6 9 B 1 7 0 B 1 7 1 B 1 7 2
In a previous analysis of another mountain range, we faced difficulties to identify the scientific branches. For example, numerous respondents stated geography as their scientific discipline, but then it was impossible to determine if the respondent referred to physical or a human geography, or an interdisciplinary approach. To avoid such a problem, the following question was put in the SEE survey: "Which branch of science do you consider your work to fall under?" and then the respondent could choose between the three following choices: social sciences, natural sciences, other. It was allowed to click in more than one category. The graph by scientific branches clearly shows a dominance of natural sciences. This is a classical trend in mountain research. However, in the subnetwork of 85 nodes, we can see a better balance between the branches. There are also 14 actors, out of the 21 whom the whole networks counts in total, who claim to do both social and natural sciences, i.e. doing interdisciplinary work.
Illustration 6: sciences (black-social sciences; blue-naturalsciences; red-both social and natural sciences; grey-other) A 1 A 2 A 3 A 4 A 5 A 6 A 7 A 8 A 9 A 1 0 A 1 1 A 1 2 A 1 3 A 1 4 A 1 5 A 1 6 A 1 7 A 1 8 A 1 9 A 2 0 A 2 1 A 2 2 A 2 3 A 2 4 A 2 5 A 2 6 A 2 7 A 2 8 A 2 9 A 3 0 A 3 1 A 3 2 A 3 3 A 3 4 A 3 5 A 3 6 A 3 7 A 3 8 A 3 9 A 4 0 A 4 1 A 4 2 A 4 3 A 4 4 A 4 5 A 4 6 A 4 7 A 4 8 A 4 9 A 5 0 A 5 1 A 5 2 A 5 3 A 5 4 A 5 5 A 5 6 A 5 7 A 5 8 A 5 9 A 6 0 A 6 1 A 6 2 A 6 3 A 6 4 A 6 5 A 6 6 A 6 7 A 6 8 A6 9 A 7 0 A 7 1 A 7 2 A 7 3 A 7 4 B 1 B 2 B 3 B 4 B 5 B 6 B 7 B 8 B 9 B 1 0 B 1 1 B 1 2 B 1 3 B 1 4 B 1 5 B 1 6 B 1 7 B 1 8 B 1 9 B 2 0 B 2 1 B 2 2 B 2 3 B 2 4 B 2 5 B 2 6 B 2 7 B 2 8 B 2 9 B 3 0 B 3 1 B 3 2 B 3 3 B 3 4 B 3 5 B 3 6 B 3 7 B 3 8 B 3 9 B 4 0 B 4 1 B 4 2 B 4 3 B 4 4 B 4 5 B 4 6 B 4 7 B 4 8 B 4 9 B 5 0 B 5 1 B 5 2 B 5 3 B 5 4 B 5 5 B 5 6 B 5 7 B 5 8 B 5 9 B 6 0 B 6 1 B 6 2 B 6 3 B 6 4 B 6 5 B 6 6 B 6 7 B 6 8 B 6 9 B 7 0 B 7 1 B 7 2 B 7 3 B 7 4 B 7 5 B 7 6 B 7 7 B 7 8 B 7 9 B 8 0 B 8 1 B 8 2 B 8 3 B 8 4 B 8 5 B 8 6 B 8 7 B 8 8 B 8 9 B 9 0 B 9 1 B 9 2 B 9 3 B 9 4 B 9 5 B 9 6 B 9 7 B 9 8 B 9 9 B 1 0 0 B 1 0 1 B 1 0 2 B 1 0 3 B 1 0 4 B 1 0 5 B 1 0 6 B 1 0 7 B 1 0 8 B 1 0 9 B 1 1 0 B 1 1 1 B 1 1 2 B 1 1 3 B 1 1 4 B 1 1 5 B 1 1 6 B 1 1 7 B 1 1 8 B 1 1 9 B 1 2 0 B 1 2 1 B 1 2 2 B 1 2 3 B 1 2 4 B 1 2 5 B 1 2 6 B 1 2 7 B 1 2 8 B 1 2 9 B 1 3 0 B 1 3 1 B 1 3 2 B 1 3 3 B 1 3 4 B 1 3 5 B 1 3 6 B 1 3 7 B 1 3 8 B 1 3 9 B 1 4 0 B 1 4 1 B 1 4 2 B 1 4 3 B 1 4 4 B 1 4 5 B 1 4 6 B 1 4 7 B 1 4 8 B 1 4 9 B 1 5 0 B 1 5 1 B 1 5 2 B 1 5 3 B 1 5 4 B 1 5 5 B 1 5 6 B 1 5 7 B 1 5 8 B 1 5 9 B 1 6 0 B 1 6 1 B 1 6 2 B 1 6 3 B 1 6 4 B 1 6 5 B 1 6 6 B 1 6 7 B 1 6 8 B 1 6 9 B 1 7 0 B 1 7 1 B 1 7 2
5. Conclusion
The "Who is who list in SEE mountain research" was a fantastic tool to delineate the "population" to be analyzed. Through a name generating technic, it is impossible to have an exhaustive view of all the ties of the network. Indeed, people could have been for instance willing to mention more than five persons. It is important to stress that SNA offers a snapshot of the structure of a network, i.e. it is time contingent. A respondent connected to the two largest subnetworks would have participated to the survey, the whole structure of the network would have been recomposed. Focusing on a scientific network the use of bibliometrics or scientometric social network analysis, i.e. the examination of interconnections among texts and authorship, could be a promising tool to determine the connections among the nodes of network, because of the nature of scientific activity oriented towards publications (Sun and Manson 2011).
Beyond revealing the general structure of the “Southeastern European Mountain Research network” and identifying the key players in it, the SNA aimed to address two main hypotheses. The SNA showed the country of work plays a structuring role in the network. Scientific branches play a lesser structuring roles, but these could be refined by looking at scientific disciplines, rather than branches. The balance between social and natural sciences is not achieved but this is no surprise in mountain research. Moreover, some "interdisciplinary" scientists can bridge the gap.
As the research has been built with the science-policy interaction as a background, it seems appropriate to conclude with this topic. The goal of the network is to enhance international research collaboration in the region and on the region. In the survey, the greatest mentioned "impediment for building scientific networks in the SEE mountain region", was the lack of funding. In accordance to this observation, funding was also high ranked in the actions that "should be taken to promote transnational scientific collaboration in the SEE mountain region". However, another final motive emerges. It is the fostering of sustainable development in the mountains of South-East Europe. Several participants to the 2012 Ankara conference stressed with emphasis the importance of such political instrument as a SEE mountain convention. In this specific regional case study, scientists seem not to be eager to limit themselves to be providers of "neutral" and "objective" science to decision-makers. On the contrary, they appear willing to engage themselves in the advocacy of regional strategies with the ultimate goal to tackle conservation and sustainability issues, in other words to be scientists who aim to make a difference.
Acknowledgements
This research was supported by various research projects: "Mountlennium: Reaching Millennium Development Goals through Regional Mountain Governance" (Swiss Network for International Studies), "European Regional Mountain Initiatives : From Pyrenees to Caucasus" (CR11I1-137989,
Swiss National Science Foundation)"Glo-rete: Globalization and reerritorialisation of environmentalinitiatives in Central Europe" (CR1011_125414, Swiss National Science Foundation) and“Eco-TREG: Ecoregional Territoriality: Rescaling Environmental Governance" (COST Action IS 0802).
I am grateful to Sybille Ducommun for her thoughtful guidance in the social network analysis. Dusan Djordjevic for clearing parts of the data. Finally, I would like to thank the participants to the 2012 Ankara conference "Mountain Resources and their Response to Global Change" and the participants to the University of Geneva "SCALE seminar" for their valuable inputs.
References
Balsiger, J., VanDeveer, S. 2012. Navigating Regional Environmental Governance, Global Environmental Politics, 12/3, 1-17. Borgatti, S., Everett, M. G., Freeman, L. C. 2002. UCINET for Windows: Software for Social Network Analysis. Analytic
Technologies, Harvard.
Debarbieux, B., Rudaz, G. 2010. Les faiseurs de montagne: Imaginaires politiques et territorialités, XVIIIe–XXIe siècle. CNRS Editions, Paris.
Forsyth, T. 2003. Critical Political Ecology: The Politics of Environmental Science. Routledge, London.
Jasanoff, S. 1990. The Fifth Branch: Science Advisers as Policymakers. Harvard University Press, Cambridge MA.
Keller, A. 2009. Science in Environmental Policy: The Politics of Objective Advice. MIT Press, Cambridge MA.
Knoke D., Yang S. 2008. Social Network Analysis. Sage, Thousand Oaks CA.
Kohler, T., Pratt, J., Balsiger, J., Debarnieux, B., Rudaz G., and Maselli, D. 2012. Sustainable Mountain Development –
Green Economy and Institutions: From Rio 1992 to Rio 2012 and beyond. Swiss Agency for Development and
Cooperation, Bern.
Nechodom M. 2005. Institutional and policy contexts of biosphere reserves: potential roles for social science in sustainable development strategies. Editors: Lee, C., Schaaf, T. 2005. Global Change Impacts in Mountain Biosphere Reserves:
l’Aquila and Granada Workshops. UNESCO, Paris, 195-208.
O'Neill, K. 2009. The Environment and International Relations. Cambridge University Press, Cambridge UK
Rudaz, G. 2011. The Cause of Mountains: The Politics of Promoting a Global Agenda, Global Environmental Politics, 11-/4, 43-65.
Sun, S., Manson, S. 2011. Social Network Analysis of the Academic GIScience Community. The Professional Geographer, 63/1, 18-33.
United Nations. 1992. Agenda 21. United Nations, New York.
United Nations. 2012. The Future We Want. United Nations, New York.
Vogler, J. 2003. Taking Institutions Seriously: How Regime Analysis Can Be Relevantto Multilevel Environmental Governance, Global Environmental Politics 3/2, 25– 39.
Wasserman, S., Faust, K. 1999. Social network analysis: Methods and applications. Cambridge University Press, New York. Zimmerer, K., editor. 2006. Globalization and New Geographies of Conservation. University of Chicago Press, Chicago.