Introduction
Compared to green plants, mushrooms can build up large concentrations of some heavy metals (Stijve & Roschnic, 1974; Kuusi et al., 1981). An important factor is the absorption of these elements in the body after ingestion. It has been suggested that little or none of the Cd present in fungi is absorbed during passage through the intestinal tract (Schellman et al., 1980). However, other studies indicate that Cd uptake may be fairly high (Gast et al., 1988; Vetter, 1994; Melgar et al., 1998).
The fact is that the accumulation of metals by fungi has been shown primarily by the high Cd levels found in the Agaricus L.: Fr. genus (Kuusi et al., 1981). It was determined that some macrofungi have the ability to accumulate heavy metals such as Cd (Stijve & Besson,
1976; Schmitt & Meisch, 1985; Jorhem & Sundström, 1995; Kalac et al., 1996).
The description of the contents and factors influencing the accumulation of heavy metals in various macrofungi has been the target of many studies in recent years (Kojo & Lodenius, 1989; Falandysz & Chwir, 1997; Melgar et al., 1998; Garcia et al., 1998; Sesli & Tüzen, 1999; Falandysz et al., 2000; Demirbafl, 2001).
The concentrations of Al, Cd and Pb in 17 edible, inedible and poisonous species of mushrooms were determined in the eastern part of Slovenia by Mandic et al. (1992). According to their results, although the mean content of Cd in edible mushrooms was lower than it was in inedible, poisonous and deadly poisonous mushrooms, the mean content of lead in edible mushrooms was higher than it was in inedible mushrooms (Mandic et al., 1992).
Heavy Metal Levels in Some Macrofungi
Fadime YILMAZ
Mu¤la University, Ula Ali Koçman Vocational High School, Program of Fungi, 48640 Ula, Mu¤la - TURKEY
Mustafa IfiILO⁄LU
Mu¤la University, Faculty of Science and Arts, Department of Biology, 48000 Mu¤la - TURKEY
Melek MERD‹VAN
Dicle University, Faculty of Science and Arts, Department of Chemistry, 21000 Diyarbak›r - TURKEY
Received: 23.05.2001 Accepted: 29.04.2002
Abstract: This study was done on edible, inedible and poisonous macrofungi collected around the Bal›kesir-Manisa highway from two different areas (roadside and background area) in 1998-1999. Cu, Zn, Fe, Mn, Co, Cd, Ni and Pb contents were determined by atomic absorption spectrophotometer in 256 samples belonging to 24 macrofungi species. The habitat, edibility and distribution of the taxa in the families were listed. According to mean dry weight (DW), Mn, Co and Cd contents were high in Omphalotus olearius (DC.: Fr.) Fr., which is a poisonous macrofungus species compared to the others; however, Fe levels were also extremely high. The lowest Cu, Mn and Fe contents were found in Laetiporus sulphureus (Bull.: Fr.) Murr., which is an edible macrofungus. The highest Pb and Zn contents were determined in Lycoperdon perlatum Pers. as 6.5 mg/kg and 274 mg/kg respectively. The contents of Ni and Cd seemed to be lower the near road.
Key Words: Heavy metals, macrofungi, Turkey
Baz› Makrofunguslarda A¤›r Metal Seviyeleri
Özet: Bu çal›flma 1998-1999 y›llar›nda, Bal›kesir-Manisa karayolu çevresinde, iki farkl› alandan toplanan (yol kenar› ve yola uzak alan), yenen, yenmeyen ve zehirli makrofunguslar üzerinde yap›lm›flt›r. 24 makrofungus türüne ait 256 örnekte Cu, Zn, Fe, Mn, Co, Cd, Ni ve Pb içerikleri atomik absorpsiyon spektrofotometresiyle tespit edilmifltir. Taksonlar›n familyalar içinde da¤›l›fl›, yenilebilirlikleri ve habitatlar› liste halinde verilmifltir. Ortalama kuru a¤›rl›klar›na (DW) göre, zehirli bir mantar türü olan Omphalotus olearius (DC.: Fr.) Fr.’de Mn, Co ve Cd içerikleri di¤er türlerle karfl›laflt›r›ld›¤›nda yüksek, Fe de ise afl›r› yüksek bulunmufltur. En düflük Cu, Mn, Fe içerikleri yenebilen bir makrofungus olan Laetiporus sulphureus (Bull.: Fr.) Murr.’da bulunmufltur. En yüksek Pb ve Zn içerikleri Lycoperdon perlatum Pers.’de s›ras›yla 6.5 mg/kg ve 274 mg/kg olarak tespit edilmifltir. Ni ve Cd içeriklerinin yola yak›n alanda daha düflük oldu¤u gözlenmifltir.
The concentrations of Pb in 95 samples of 13 species (seven mycorrhizals and six saprophites) collected from two different areas (polluted and unpolluted) in NW Spain were determined by Garcia et al. (1998). The following factors were considered; species and ecology, as well as morphological portion and traffic pollution. The average lead concentration of the samples was 1 ppm dry weight. Saprophite species presented higher levels than mycorrhizal ones. Coprinus comatus (Müll.: Fr.) S.F.Gray reached the maximum mean concentration of 2.06 and 2.79 ppm of dry weight in the hymenophore and the rest of the fruit body. The morphological portion statistically did not show a significant difference between the two portions (Garcia et al., 1998). This species, as other researchers have indicated, can be considered a bioindicator for lead contamination (Quinche, 1992).
The highest Pb levels found in samples collected near roads were 2.35 mg/kg for the species Agaricus bitorquis (Quél.) Sacc. and 7.00 mg/kg for Hypholoma fasciculare (Huds.: Fr.) Kummer. The highest mean concentration of Cu was 51.0 mg/kg for Tricholoma terreum (Schaeff.: Fr.) Kummer and the highest mean Mn concentration was 35.9 mg/kg for Laccaria laccata (Scop.: Fr.) Bk & Br. (Tüzen et al., 1998).
Hg, Pb, Cd, Fe, Cu, Mn, Zn, Co and As contents were determined spectrometrically in the fruiting bodies of 109 wild and two cultivated macrofungi specimens by Sesli & Tüzen (1999). The macrofungi specimens were collected from the East Black Sea region of Turkey. According to this study, no difference between sapropytic and mycorrhizal forming species was observed. Trace element concentrations were highest in the macrofungi of the family Tricholomataceae. The highest Pb content was 5.64 µg/g dry weight found in Hypholoma fasciculare collected from a roadside (Sesli & Tüzen, 1999).
Seventeen different species of wild mushrooms growing in the East Black Sea region and one cultivated mushroom were analysed spectrometrically for trace element (Pb, Cd, Hg, Cu, Mn and Zn) levels by Demirbafl. According to the results, the highest mean Pb level was 6.88 mg/kg for the species Hypholoma fasciculare collected from a roadside (Demirbafl, 2001).
Turkey has a very rich flora of mushrooms because it possesses favourable environmental conditions for the growth of edible, inedible and poisonous macrofungi. However, the Turkish public rarely consumes wild edible
macrofungi. In many European countries fungi collection is very popular though the amount collected is quite insignificant (Jorhem & Sundström, 1995).
The purpose of this study was to determine the contents of eight heavy metals in 24 macrofungi collected from roadside and background areas. The other aim was to compare the toxicity of heavy metals, the habitat and edibility of species and traffic pollution.
Materials and Methods
The macrofungi samples were collected from a roadside ecosystem (Bal›kesir-Manisa highway) between autumn 1998 and summer 1999. The study area (Figure 1) includes forest and lawns that have been exposed to pollutants from automobile traffic for many years. The samples were classified and evaluated in two categories: roadside and background area. The sampling was done between 0 and 200 m from the road (roadside) and more than 200 m (as background area). Metal levels in 256 samples from 24 species of edible, inedible and poisonous mushrooms were analysed.
To identify the specimens, the habitat and morphological characteristics of the macrofungi found in the localities were recorded and photographed. The macrofungus specimens were then brought to the laboratory and their spore prints were extracted and measured. Specimens were identified by reference books (Moser, 1983; Breitanbach & Kranzlin, 1984).
The samples were cleaned without washing, cut and dried at 40 ºC in an oven for 48 h after being air dried for 5 days. A sample with a mass of 0.5-2 g was weighed and placed into a porcelain crucible and ashed at 450 ºC for 15-24 h, then the ash was dissolved in 2 mL conc. HNO3, evaporated to dryness, heated again at 450 ºC for
3 h and dissolved in 1 mL conc. H2SO4, 1 mL conc. HNO3
and diluted with deionised water up to a volume of 25 mL. All samples were run in duplicate.
A Perkin Elmer model SIM AA 900 graphite furnace atomic absorption spectrophotometer with Zeeman background correction at wavelengths of 283.3 nm for Pb, 228.8 nm for Cd, 232.0 nm for Ni and 240.7 nm for Co and a Pye Unicam 929 flame atomic absorption spectrophotometer with deuterium background correction at 213.9 nm for Zn, 279.5 nm for Mn, 248.3 nm for Fe and 324.8 nm for Cu were used.
0 10 20 30 km x : Lokalities MAN‹SA Akhisar Demirtafl BALIKES‹R De¤irmenbo¤az› N Susurluk Ankara
Figure 1. Map of the study area.
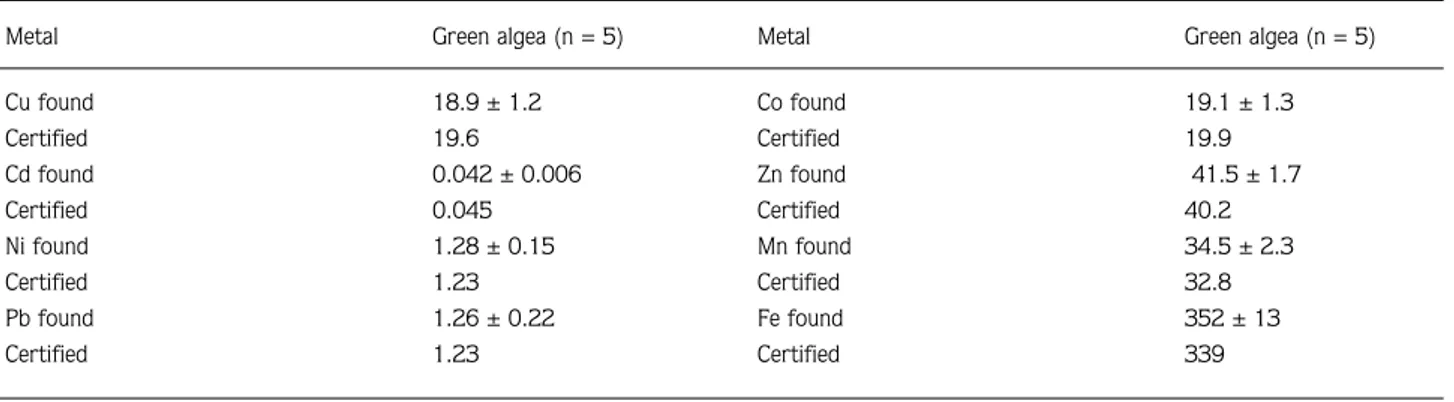
Metal Green algea (n = 5)
Cu found 18.9 ± 1.2 Certified 19.6 Cd found 0.042 ± 0.006 Certified 0.045 Ni found 1.28 ± 0.15 Certified 1.23 Pb found 1.26 ± 0.22 Certified 1.23
Metal Green algea (n = 5)
Co found 19.1 ± 1.3 Certified 19.9 Zn found 41.5 ± 1.7 Certified 40.2 Mn found 34.5 ± 2.3 Certified 32.8 Fe found 352 ± 13 Certified 339
A certified reference material (CRM) consisting of green algae (MBH, reference materials) was developed for survey and analysed together with the samples (Table 1).
Detection limits were calculated as 3 times the standard deviation of a large number of blanks taken through the entire analytical procedure. Detection limits for each element were 0.015 µg/L for Mn, 2.2 x 10⁻⁴ µg/L for Cd, 0.009 µg/L for Cu, 0.009 µg/L for Co, 0.038 µg/L for Zn, 0.085 µg/L for Fe and 0.0048 µg/L for Pb.
Correlations between metal concentrations were tested by regression analysis. Metal concentrations
from the test were compared statistically by two-tailed tests.
Results and Discussion
Twenty-four species of wild macrofungi were collected. The total number of samples from the roadside was 127 and from the background area 129.
The result of the CRM analysis showed good agreement with the certified levels in Table 1. The habitat and edibility of macrofungi are shown in Table 2.
Element concentrations in the mushroom species Table 2. Habitat and edibility of macrofungi species.
No Family and species Habitat Edibility
Rhizopogonaceae
1. Rhizopogon luteolus Fr. Sandy conifer woods Edible
Lycoperdaceae
2. Lycoperdon perlatum Pers. Woodland Edible
Polyporaceae
3. Laetiporus sulphureus (Bull.: Fr.) Murr. On living and dead wood of broadleaf trees Edible Bolataceae
4. Suillus bellinii (Inz.) Watl. In conifer forests Edible
Paxillaceae
5. Omphalotus olearius (DC.: Fr.) Fr. On the roots or at the base of certain trees Poisonous Hygrophoraceae
6. Hygrophorus hedyricii Vel. Under pine and betula Inedible
Tricholomataceae
7. Clitocybe dealbata (Sow.: Fr.) Kummer In grassy area Poisonous
8. C. subspadicae (Lge.) Bon&Chevassut In conifer forests Inedible
9. Laccaria laccata (Scop.: Fr.) Bk & Br. In hardwood and coniferous forest Edible
10. Marasmius oreades (Bolt.: Fr.) Fr. In meadows and pastures, in grassy forests Edible
11. Tricholoma auratum (Fr.) Gill. In sandy pine woods Poisonous
12. T. batschii Gulden In conifer forests Inedible
13. T. stans (Fr.) Sacc. In conifer forests Inedible
14. T. terreum (Schaeff.: Fr.) Kumm. On calcerous soils in coniferous forests Edible
Lepiotaceae
15. Lepiota alba (Bres.) Sacc. Meadows Inedible
16. Leucoagaricus pudicus Bull. Grassy places Inedible
Agaricaceae
17. Agaricus placomyces Peck. On wood Poisonous
18. A. subperonatus (Lge.) Sing. In grassy woods Edible
Strophoriaceae
19. Hypholoma fasciculare (Huds : Fr.) Kummer. On dead decidious and coniferous woods Poisonous Cortinariaceae
20. Hebeloma sinapizans (Paulet: Fr.) Gill. Decidious and coniferous woods Poisonous
21. Inocybe geophylla (Sow.: Fr.) Kumm. var. violaceae Pat. In mixed and coniferous woods Poisonous Russulaceae
22. Lactarius deliciosus Fr. Under coniferous tress, especially pine Edible
23. Russula delica Fr. Under both broad-leaved and coniferous trees Edible
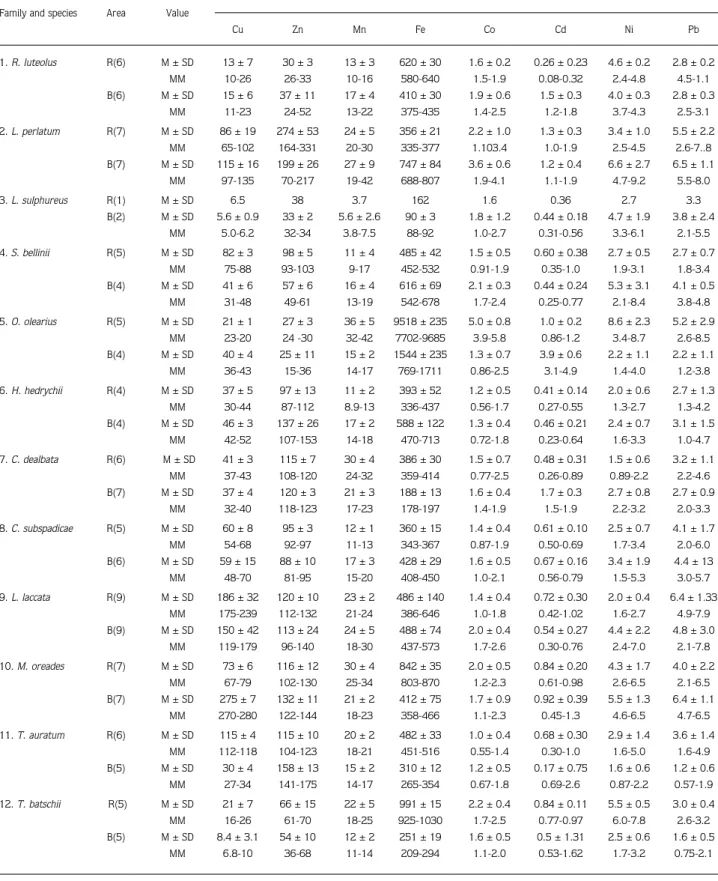
Table 3. Metal content in individual macrofungi species (mg/kg, dry weight). Data are represented as means (M), standard deviations (SD) and minimum-maximum (MM).
Elements Family and species Area Value
Cu Zn Mn Fe Co Cd Ni Pb 1. R. luteolus R(6) M ± SD 13 ± 7 30 ± 3 13 ± 3 620 ± 30 1.6 ± 0.2 0.26 ± 0.23 4.6 ± 0.2 2.8 ± 0.2 MM 10-26 26-33 10-16 580-640 1.5-1.9 0.08-0.32 2.4-4.8 4.5-1.1 B(6) M ± SD 15 ± 6 37 ± 11 17 ± 4 410 ± 30 1.9 ± 0.6 1.5 ± 0.3 4.0 ± 0.3 2.8 ± 0.3 MM 11-23 24-52 13-22 375-435 1.4-2.5 1.2-1.8 3.7-4.3 2.5-3.1 2. L. perlatum R(7) M ± SD 86 ± 19 274 ± 53 24 ± 5 356 ± 21 2.2 ± 1.0 1.3 ± 0.3 3.4 ± 1.0 5.5 ± 2.2 MM 65-102 164-331 20-30 335-377 1.103.4 1.0-1.9 2.5-4.5 2.6-7..8 B(7) M ± SD 115 ± 16 199 ± 26 27 ± 9 747 ± 84 3.6 ± 0.6 1.2 ± 0.4 6.6 ± 2.7 6.5 ± 1.1 MM 97-135 70-217 19-42 688-807 1.9-4.1 1.1-1.9 4.7-9.2 5.5-8.0 3. L. sulphureus R(1) M ± SD 6.5 38 3.7 162 1.6 0.36 2.7 3.3 B(2) M ± SD 5.6 ± 0.9 33 ± 2 5.6 ± 2.6 90 ± 3 1.8 ± 1.2 0.44 ± 0.18 4.7 ± 1.9 3.8 ± 2.4 MM 5.0-6.2 32-34 3.8-7.5 88-92 1.0-2.7 0.31-0.56 3.3-6.1 2.1-5.5 4.S. bellinii R(5) M ± SD 82 ± 3 98 ± 5 11 ± 4 485 ± 42 1.5 ± 0.5 0.60 ± 0.38 2.7 ± 0.5 2.7 ± 0.7 MM 75-88 93-103 9-17 452-532 0.91-1.9 0.35-1.0 1.9-3.1 1.8-3.4 B(4) M ± SD 41 ± 6 57 ± 6 16 ± 4 616 ± 69 2.1 ± 0.3 0.44 ± 0.24 5.3 ± 3.1 4.1 ± 0.5 MM 31-48 49-61 13-19 542-678 1.7-2.4 0.25-0.77 2.1-8.4 3.8-4.8 5. O. olearius R(5) M ± SD 21 ± 1 27 ± 3 36 ± 5 9518 ± 235 5.0 ± 0.8 1.0 ± 0.2 8.6 ± 2.3 5.2 ± 2.9 MM 23-20 24 -30 32-42 7702-9685 3.9-5.8 0.86-1.2 3.4-8.7 2.6-8.5 B(4) M ± SD 40 ± 4 25 ± 11 15 ± 2 1544 ± 235 1.3 ± 0.7 3.9 ± 0.6 2.2 ± 1.1 2.2 ± 1.1 MM 36-43 15-36 14-17 769-1711 0.86-2.5 3.1-4.9 1.4-4.0 1.2-3.8 6. H. hedrychii R(4) M ± SD 37 ± 5 97 ± 13 11 ± 2 393 ± 52 1.2 ± 0.5 0.41 ± 0.14 2.0 ± 0.6 2.7 ± 1.3 MM 30-44 87-112 8.9-13 336-437 0.56-1.7 0.27-0.55 1.3-2.7 1.3-4.2 B(4) M ± SD 46 ± 3 137 ± 26 17 ± 2 588 ± 122 1.3 ± 0.4 0.46 ± 0.21 2.4 ± 0.7 3.1 ± 1.5 MM 42-52 107-153 14-18 470-713 0.72-1.8 0.23-0.64 1.6-3.3 1.0-4.7 7. C. dealbata R(6) M ± SD 41 ± 3 115 ± 7 30 ± 4 386 ± 30 1.5 ± 0.7 0.48 ± 0.31 1.5 ± 0.6 3.2 ± 1.1 MM 37-43 108-120 24-32 359-414 0.77-2.5 0.26-0.89 0.89-2.2 2.2-4.6 B(7) M ± SD 37 ± 4 120 ± 3 21 ± 3 188 ± 13 1.6 ± 0.4 1.7 ± 0.3 2.7 ± 0.8 2.7 ± 0.9 MM 32-40 118-123 17-23 178-197 1.4-1.9 1.5-1.9 2.2-3.2 2.0-3.3 8. C. subspadicae R(5) M ± SD 60 ± 8 95 ± 3 12 ± 1 360 ± 15 1.4 ± 0.4 0.61 ± 0.10 2.5 ± 0.7 4.1 ± 1.7 MM 54-68 92-97 11-13 343-367 0.87-1.9 0.50-0.69 1.7-3.4 2.0-6.0 B(6) M ± SD 59 ± 15 88 ± 10 17 ± 3 428 ± 29 1.6 ± 0.5 0.67 ± 0.16 3.4 ± 1.9 4.4 ± 13 MM 48-70 81-95 15-20 408-450 1.0-2.1 0.56-0.79 1.5-5.3 3.0-5.7 9.L. laccata R(9) M ± SD 186 ± 32 120 ± 10 23 ± 2 486 ± 140 1.4 ± 0.4 0.72 ± 0.30 2.0 ± 0.4 6.4 ± 1.33 MM 175-239 112-132 21-24 386-646 1.0-1.8 0.42-1.02 1.6-2.7 4.9-7.9 B(9) M ± SD 150 ± 42 113 ± 24 24 ± 5 488 ± 74 2.0 ± 0.4 0.54 ± 0.27 4.4 ± 2.2 4.8 ± 3.0 MM 119-179 96-140 18-30 437-573 1.7-2.6 0.30-0.76 2.4-7.0 2.1-7.8 10. M. oreades R(7) M ± SD 73 ± 6 116 ± 12 30 ± 4 842 ± 35 2.0 ± 0.5 0.84 ± 0.20 4.3 ± 1.7 4.0 ± 2.2 MM 67-79 102-130 25-34 803-870 1.2-2.3 0.61-0.98 2.6-6.5 2.1-6.5 B(7) M ± SD 275 ± 7 132 ± 11 21 ± 2 412 ± 75 1.7 ± 0.9 0.92 ± 0.39 5.5 ± 1.3 6.4 ± 1.1 MM 270-280 122-144 18-23 358-466 1.1-2.3 0.45-1.3 4.6-6.5 4.7-6.5 11. T. auratum R(6) M ± SD 115 ± 4 115 ± 10 20 ± 2 482 ± 33 1.0 ± 0.4 0.68 ± 0.30 2.9 ± 1.4 3.6 ± 1.4 MM 112-118 104-123 18-21 451-516 0.55-1.4 0.30-1.0 1.6-5.0 1.6-4.9 B(5) M ± SD 30 ± 4 158 ± 13 15 ± 2 310 ± 12 1.2 ± 0.5 0.17 ± 0.75 1.6 ± 0.6 1.2 ± 0.6 MM 27-34 141-175 14-17 265-354 0.67-1.8 0.69-2.6 0.87-2.2 0.57-1.9 12. T. batschii R(5) M ± SD 21 ± 7 66 ± 15 22 ± 5 991 ± 15 2.2 ± 0.4 0.84 ± 0.11 5.5 ± 0.5 3.0 ± 0.4 MM 16-26 61-70 18-25 925-1030 1.7-2.5 0.77-0.97 6.0-7.8 2.6-3.2 B(5) M ± SD 8.4 ± 3.1 54 ± 10 12 ± 2 251 ± 19 1.6 ± 0.5 0.5 ± 1.31 2.5 ± 0.6 1.6 ± 0.5 MM 6.8-10 36-68 11-14 209-294 1.1-2.0 0.53-1.62 1.7-3.2 0.75-2.1
Table 3. Continued.
Elements Family and species Area Value
Cu Zn Mn Fe Co Cd Ni Pb 13. T. stans R(5) M ± SD 60 ± 16 83 ± 5 10 ± 2 337 ± 11 2.2 ± 0.5 0.35 ± 0.35 5.5 ± 0.5 3.7 ± 0.5 MM 46-77 78-85 9.0-12 330-349 1.8-2.8 0.12-0.61 4.9-6.0 3.4-4.3 B(5) M ± SD 86 ± 25 82 ± 5 12 ± 3 375 ± 15 1.8 ± 0.4 0.55 ± 0.16 2.8 ± 0.3 2.6 ± 1.2 MM 67-114 77-85 9.6-15 359-388 1.6-2.2 0.38-0.69 2.5-3.2 1.8-4.0 14. T. terreum R(7) M ± SD 25 ± 3 179 ± 3 19 ± 4 741 ± 202 2.6 ± 1.5 0.56 ± 0.14 5.6 ± 2.1 4.4 ± 1.5 MM 22-28 175-182 15-22 508-872 1.5-4.6 0.41-0.69 2.9-7.3 2.3-6.0 B(7) M ± SD 39 ± 7 228 ± 57 20 ± 2 1042 ± 70 2.5 ± 1.2 1.2 ± 0.6 9.4 ± 2.1 5.4 ± 1.6 MM 32-46 188-427 18-21 966-1105 1.4-4.8 0.37-1.6 7.3-12 3.1-7.6 15. L. alba R(3) M ± SD 29 ± 5 86 ± 8 22 ± 11 779 ± 35 3.0 ± 0.9 0.83 ± 0.59 5.8 ± 1.4 5.8 ± 1.0 MM 18-34 88-102 14-36 750-798 2.4-3.7 0.22-1.8 4.8-6.8 4.7-6.4 B(2) M ± SD 35 ± 9 86 ± 17 21 ± 5 1039 ± 98 4.2 ± 1.6 1.0 ± 0.3 8.3 ± 4.0 6.0 ± 2.5 MM 28-41 74-98 17-24 969-1108 3.0-5.3 0.80-1.2 5.4-11 4.3-7.8 16. L. pudicus R(6) M ± SD 36 ± 7 90 ± 8 11 ± 6 318 ± 44 1.9 ± 1.0 1.2 ± 0.2 3.2 ± 1.5 3.7 ± 1.1 MM 28-1.8 100-182 9.4-22 274-362 1.2-2.6 1.0-1.5 2.1-4.2 3.0-4.7 B(6) M ± SD 27 ± 16 100 ± 34 9.4 ± 3.6 270 ± 121 2.1 ± 0.8 1.4 ± 0.7 3.8 ± 1.4 2.9 ± 1.1 MM 11-49 70-149 5.7-14 116-406 0.58-2.1 0.67-1.4 1.5-4.5 2.0-5.4 17. A. placomyces R(4) M ± SD 54 ± 3 68 ± 10 20 ± 5 892 ± 27 2.3 ± 1.0 0.60 ± 0.42 4.4 ± 3.1 3.7 ± 1.3 MM 52-57 58-77 15-25 854-934 1.4-3.8 0.36-0.96 2.3-9.0 2.0-5.2 B(3) M ± SD 59 ± 3 69 ± 3 23 ± 6 939 ± 36 2.7 ± 0.5 0.93 ± 0.29 11 ± 3 3.6 ± 1.4 MM 57-63 66-72 18-27 903-975 2.2-3.3 0.61-1.16 4.8-12 2.2-4.8 18.A. subperonatus R(4) M ± SD 63 ± 18 67 ± 8 32 ± 2 1452 ± 296 2.4 ± 0.3 0.69 ± 0.34 4.3 ± 0.3 3.5 ± 1.2 MM 42-77 57-78 31-35 1187-1771 2.1-2.6 0.35-0.82 4.1-4.5 2.3-5.0 B(4) M ± SD 91 ± 3 76 ± 10 37 ± 6 750 ± 364 2.2 ± 0.3 0.56 ± 0.30 5.0 ± 2.0 3.0 ± 1.1 MM 87-94 66-85 31-42 329-970 1.9-2.5 0.48-0.81 2.8-7.0 1.9-4.4 19.H. fasciculare R(5) M ± SD 31 ± 2 66 ± 26 20 ± 5 704 ± 12 2.1 ± 0.9 0.58 ± 0.17 4.0 ± 0.8 3.5 ± 1.2 MM 29-34 36-171 15-23 612-795 1.1-3.3 0.39-0.71 2.9-4.8 2.1-5.0 B(7) M ± SD 36 ± 3 143 ± 30 18 ± 2 388 ± 20 1.9 ± 0.7 0.80 ± 0.30 3.5 ± 1.2 3.3 ± 1.3 MM 3.4-40 79-147 15-19 365-404 1.3-2.9 0.45-0.96 2.4-5.2 2.2-5.0 20.H. sinapizans R(5) M ± SD 162 ± 46 178 ± 9 20 ± 7 535 ± 101 1.6 ± 0.5 2.0 ± 1.5 3.8 ± 1.0 3.2 ± 1.1 MM 109-192 168-187 14-32 423-621 1.1-2.1 1.0-3.7 2.8-5.2 2.2-4.4 B(5) M ± SD 144 ± 19 115 ± 6 13 ± 10 303 ± 23 1.2 ± 0.4 0.49 ± 0.24 3.5 ± 1.9 2.8 ± 0.5 MM 132-158 108-127 9.0-38 279-326 0.79-1.7 0.22-0.67 1.6-5.7 2.3-3.4 21.Inocybe geophylla R(8) M ± SD 26 ± 8 116 ± 6 15 ± 8 376 ± 144 2.4 ± 1.1 1. ± 0.5 4.0 ± 1.0 3.5 ± 1.8 var. violacea MM 20-32 111-120 8.2-17 274-478 1.2-3.4 0.60-1.4 3.2-5.1 1.6-5.2 B(10) M ± SD 24 ± 3 132 ± 9 24 ± 9 1020 ± 182 2.5 ± 1.4 1.4 ± 0.7 11 ± 6 4.0 ± 2.0 MM 22-33 123-144 13-35 866-1217 1.3-4.2 0.98-2.3 2.4-17 1.9-6.9 22. L. deliciosus R(5) M ± SD 47 ± 8 88 ± 5 12 ± 6.8 493 ± 23 2.3 ± 0.6 0.39 ± 0.23 3.8 ± 1.9 3.0 ± 0.1 MM 44-70 82-91 8.0-19 466-510 1.9-3.1 0.27-0.71 1.7-5.8 2.8-3.0 B(5) M ± SD 24 ± 10 83 ± 8 29 ± 6 412 ± 12 3.2 ± 0.9 0.50 ± 0.19 15 ± 3 3.3 ± 0.5 MM 17-39 73-88 22-33 401-425 2.0-4.0 0.33-0.74 13-19 3.0-4.0 23.R. delica R(4) M ± SD 73 ± 8 57 ± 12 9.6 ± 3.7 244 ± 12 1.5 ± 0.7 0.31 ± 0.46 3.2 ± 0.9 2.7 ± 0.8 MM 66-82 49-72 7.8-15 223-265 0.65-2.0 0.16-0.75 2.2-4.0 1.8-3.4 B(4) M ± SD 75 ± 7 67 ± 16 14 ± 4 698 ± 79 3.0 ± 0.4 0.84 ± 0.53 2.8 ± 1.4 4.1 ± 0.4 MM 67-83 49-78 10-21 621-780 2.6-3.2 0.23-1.2 1.2-3.6 3.6-4.4 24. R. foetens R(5) M ± SD 58 ± 7 82 ± 16 12 ± 5 238 ± 44 2.2 ± 1.5 1.4 ± 0.5 3.6 ± 1.3 2.4 ± 0.5 MM 53-66 89-95 7.6-19 196-284 0.57-3.3 1.1-2.0 2.2-4.7 1.8-2.8 B(5) M ± SD 57 ± 10 72 ± 10 18 ± 69 382 ± 10 2.0 ± 0.6 1.9 ± 0.5 4.0 ± 0.9 5.2 ± 1.9 MM 45-64 62-86 12-29 372-393 1.3-2.5 1.2-2.4 2.8-4.6 3.0-7.2
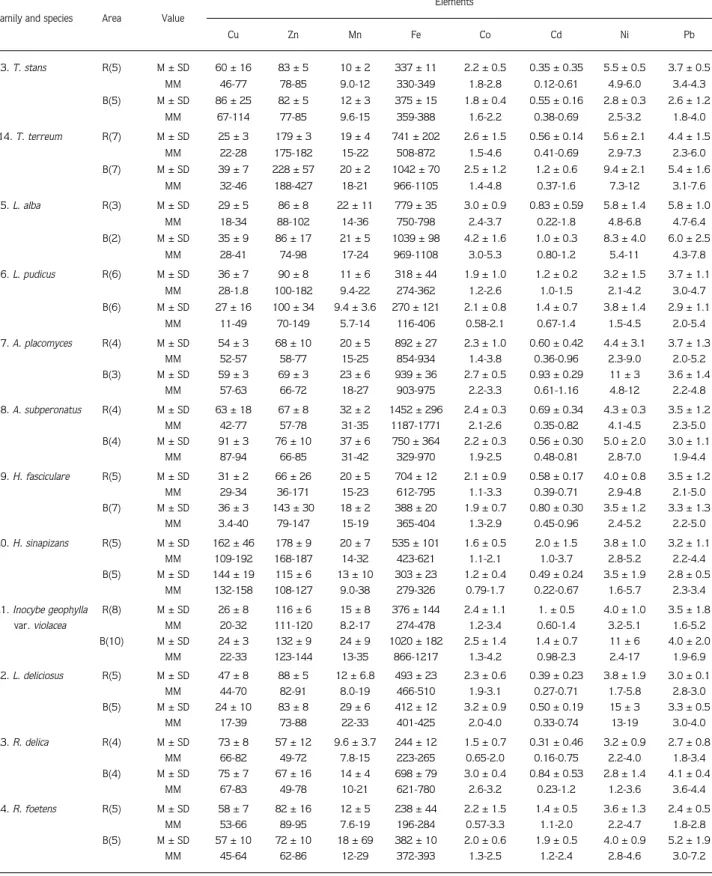
Species Co-Ni Cd-Co Mn-Co Pb-Ni Cd-Ni Cu-Ni r R. luteolus 0.87c L. sulphureus 0.60a 0.79c S. bellinii 0.50a 0.70b 0.75b 0.73b H. hedrychii 0.78c T. batschii 0.90d 0.85c T. stans 0.86c 0.73a 0.81c A. placomyces 0.79c 0.90d 0.64a A. subperonatus 0.76b 0.74b H. sinapizans 0.82c 0.87d 0.78c
Species Cd-Pb Mn-Ni Zn-Co Zn-Pb Fe-Zn Cu-Zn
r R. luteolus 0.73a L. perlatum 0.71b L. sulphureus 0.72b 0.79c S. bellinii 0.75b T. batschii 0.60a
T. stans 0.83d 0.79b 0.71a 0.54a 0.77b
A. placomyces 0.62b
A. subperonatus 0.75b
H. sinapizans 0.78b
Species Cu-Cd Zn-Mn Co-Pb Cu-Co Cu-Ni Co-Ni
r O. olearius 0.78c L. laccata 0.77b M. oreades 0.77c T. auratum 0.77c 0.75b T. terreum 0.80d 0.82d L. pudicus 0.67a H. fasciculare 0.73b 0.79c L. deliciosus 0.82d 0.80d R. delica 0.78b R. foetens 0.81b
Species Cd-Co Mn-Pb Mn-Ni Cd-Ni Zn-Cd Cu-Pb
r
T. terreum 0.82c
L. pudicus 0.60a
H. fasciculare 0.62a 0.73b 0.82c 0.66a
R. delica 0.79b 0.78b
R. foetens 0.74a 0.74b 0.69a
a: P < 0.10, b: P < 0.05, c: P < 0.02, d: P < 0.01
Table 4. Significant correlations (r) between metal pairs in mushrooms.
were analysed and the results are given in Table 3. In this table, the number of samples (n), mean concentrations and standard deviations (M ± SD), and minimum-maximum (MM) levels are indicated for both groups.
The significant linear correlations found for metal concentrations in mushrooms from the roadside are indicated in Table 4.
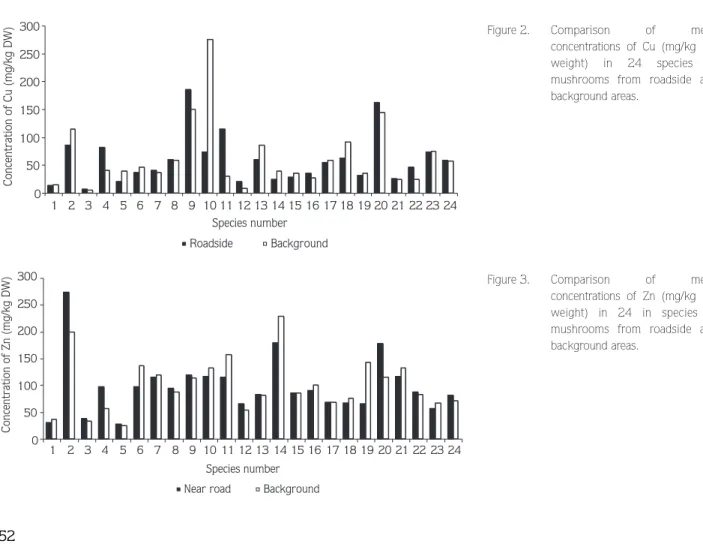
Cu concentrations ranged from 2 to 239 mg/kg for samples from the roadside and from 4.96 to 280 mg/kg for samples from the background area. The highest mean level was found in Marasmius oreades (Bolt.: Fr.) Fr. from the background area and the lowest mean levels for both areas in Laetiporus sulphureus. The variation within the two studied areas was fairly low except for Marasmius oreades and Tricholoma auratum (Fr.) Gill. (Figure 2).
Zn content in mushrooms ranged from 24 to 331 mg/kg for samples from the roadside and from 15 to 427 mg/kg for background area samples. The highest Zn contents were found in Lycoperdon perlatum for roadside Tricholoma terreum for background areas. The lowest
zinc content was found in Omphalotus olearius for both areas. Poisonous mushrooms were generally higher in zinc content in background areas (Figure 3). The correlation between Zn and Pb was significant in Laetiporus sulphureus (P < 0.02).
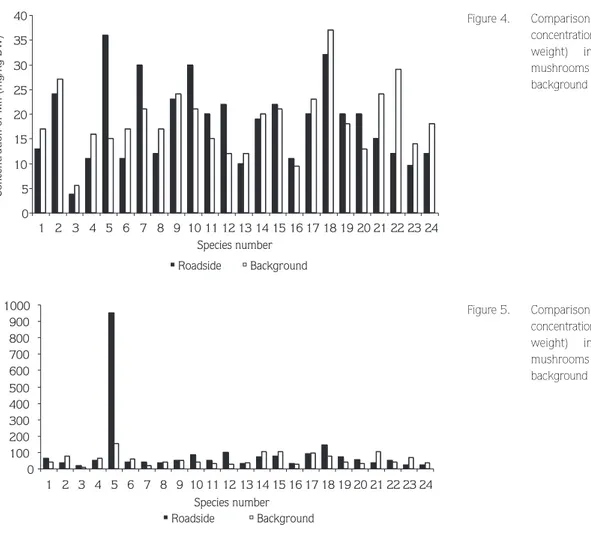
The minimum and maximum concentrations of Mn in collected samples ranged from 3.7 to 42 mg/kg for roadside and from 3.8 to 42 mg/kg for background areas. The highest mean concentrations were found in Omphalotus olearius for roadside areas and Agaricus subperonatus (Lge.) Sing. The lowest mean concentrations were found in Laetiporus sulphureus for both areas. The Mn content of edible mushrooms was higher in background areas (Figure 4). The correlation between Mn and Co was significant in L. sulphureus (P < 0.02).
In this study, it was found that the trace metal concentrations were statistically significant lowest in L. sulphureus, which is edible. Its habitat is on the living and dead wood of broadleaf trees. Fungal species growing on wood contain, in general, lower concentrations of heavy metals than fungi growing on soil (Mutsch et al., 1979).
0 50 100 150 200 250 300 1 2 3 4 5 6 7 8 9 10 11 12 13 14 15 16 17 18 19 20 21 22 23 24 Species number Concentration of Cu (mg/kg DW) Roadside Background 0 50 100 150 200 250 300 Species number Concentration of Zn (mg/kg DW)
Near road Background
1 2 3 4 5 6 7 8 9 10 11 12 13 14 15 16 17 18 19 20 21 22 23 24
Figure 2. Comparison of mean
concentrations of Cu (mg/kg dry weight) in 24 species of mushrooms from roadside and background areas.
Figure 3. Comparison of mean
concentrations of Zn (mg/kg dry weight) in 24 in species of mushrooms from roadside and background areas.
The Fe contents of mushrooms ranged from 162 to 9685 mg/kg for roadside and from 88 to 1711 mg/kg for background areas. The highest concentration of Fe was found in Omphalotus olearius, with a mean of 9518 mg/kg (roadside) and 1544 mg/kg (background area). Concentrations of Fe in the other species were very low (Figure 5).
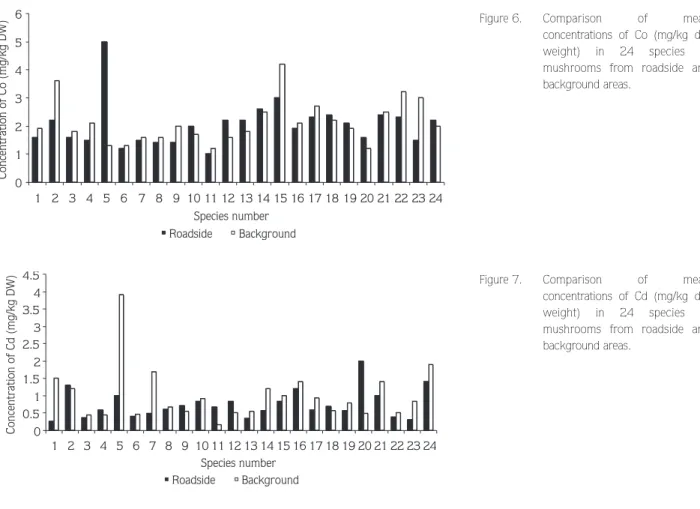
The values of Co concentrations in samples ranged from 0.55 to 5.8 mg/kg for roadside and from 0.67 to 5.3 mg/kg for background areas. Relatively high concentrations were found in Omphalotus olearius for roadside but Lepiota alba (Bres.) Sacc., Lycoperdon perlatum, Lactarius deliciosus Fr. and Russula delica Fr. for background areas (Figure 6).
Cadmium concentrations ranged from 0.08 to 3.7 mg/kg for samples from roadside and from 0.22 to 4.9 mg/kg for samples from background areas. The highest mean concentration was determined in Omphalotus olearius to be 3.9 mg/kg for background areas. The ability
to accumulate cadmium appeared highest for Hebeloma sinapizans (Paulet: Fr.) Gill. in roadside areas (Figure 7). The level of samples from the background area were found statistically significant higher than the other area. The correlation between Cd and Ni was significant in H. sinapizans (P < 0.01). There were also significant correlations between Cd and Ni for Hypholoma fasciculare and Cd and Co for Tricholoma terreum (P < 0.02).
Omphalotus olearius is a wood-decaying poisonous macrofungus. Its habitat is on the roots or at the base of certain trees like Pinus sp. and Olea sp. Wood decaying fungi take up heavy metals absorption from the substrate. Literature data indicate that heavy metal content decreases from the soil through the roots to the stems (Salt et al., 1995).
Very high concentrations of cadmium have been found in the genus Agaricus (Lodenius et al., 1981; Schmitt & Meisch, 1985; Quinche, 1987; Kojo & Lodenius, 1989; Vetter, 1994). Tyler (1980) also found no correlation
0 5 10 15 20 25 30 35 40 1 2 3 4 5 6 7 8 9 10 11 12 13 14 15 16 17 18 19 20 21 22 23 24 Species number Concentration of Mn (mg/kg DW) Roadside Background 0 100 200 300 400 500 600 700 800 900 1000 1 2 3 4 5 6 7 8 9 10 11 12 13 14 15 16 17 18 19 20 21 22 23 24 Species number Concentration of Fe (mg/kg DW) Roadside Background
Figure 4. Comparison of mean
concentrations of Mn (mg/kg dry weight) in 24 species of mushrooms from roadside and background areas.
Figure 5. Comparison of mean
concentrations of Fe (mg/kg dry weight) in 24 species of mushrooms from roadside and background areas.
between the cadmium contents of mushrooms and that of the soil or substrate. Because it has been suggested that Cd could be a growth stimulation factor, this phenomenon proved to be of taxonomical value and was not the result of environmental contamination with Cd from the soil (Tyler, 1980). Traffic pollution was not a significant factor for cadmium accumulation in fungi (Melgar et al., 1998).
In this study, Cd contents were higher in Omphalotus olearius, Lycoperdon perlatum, Hebeloma sinapizans, Clitocybe dealbata (Sow.: Fr.) Kummer and Russula foetens Fr. than in Agaricus species and the traffic pollution factor did not show significant differences. High Cd concentrations were probably not caused by pollution but by species-dependent factors, so we agree with the opinion of other authors.
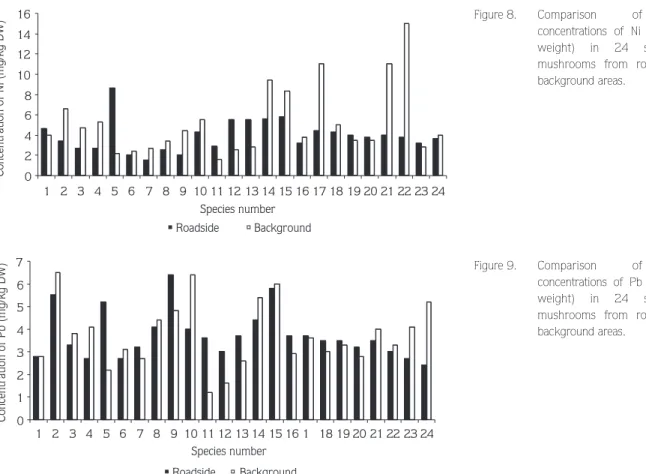
The minimum and maximum values of Ni in samples ranged from 0.89 to 8.7 mg/kg for roadside areas and from 0.87 to 19 mg/kg for background areas. Statistically significant highest mean concentrations of Ni
were found in Tricholoma terreum, Lepiota alba, Lactarius deliciosus, Agaricus placomyces Peck. and Inocybe geophylla (Sow.: Fr.) Kumm. var. violacea Pat. for samples from background areas. The Ni level of samples from background areas was relatively higher (Figure 8). The correlation between Co and Ni was significant in Lactarius deliciosus, Tricholoma batschii Gulden and T. terreum (P < 0.01).
Lead concentrations in the samples ranged from 1.1 to 7.9 mg/kg for roadside and from 0.57 to 8 mg/kg for background areas. We found the highest concentrations of lead in Laccaria laccata, Marasmius oreades,
Lycoperdon perlatum and Lepiota alba. Mean
concentrations for Omphalotus olearius, Laccaria laccata, Tricholoma stans (Fr.) Sacc., T. auratum and T. batschii were higher in roadside areas (Figure 9). The correlation between Co and Pb was significant in Lactarius deliciosus and Tricholoma terreum. The correlation between Pb-Ni as well as Cd and Pb were significant for Agaricus placomyces and Tricholoma stans respectively (P < 0.01).
0 1 2 3 4 5 6 1 2 3 4 5 6 7 8 9 10 11 12 13 14 15 16 17 18 19 20 21 22 23 24 Species number Concentration of Co (mg/kg DW) Roadside Background
Figure 6. Comparison of mean
concentrations of Co (mg/kg dry weight) in 24 species of mushrooms from roadside and background areas. 0 0.5 1 1.5 2 2.5 3 3.5 4 4.5 1 2 3 4 5 6 7 8 9 10 11 12 13 14 15 16 17 18 19 20 21 22 23 24 Species number Concentration of Cd (mg/kg DW) Roadside Background
Figure 7. Comparison of mean
concentrations of Cd (mg/kg dry weight) in 24 species of mushrooms from roadside and background areas.
Marasmius oreades and Lacccaria laccata are saprophite edible mushrooms. They live in grassy forests, on forest paths, in gardens and in parks. The lead content of saprophite mushrooms were higher than those of mycorrhizal species. The fruit bodies of mushrooms accumulate remarkably high concentrations of lead, especially in the vicinity of highways or other lead sources. Our results agree with the data of other authors (Laaksovirta & Alakuijaka, 1978; Mornand, 1990; Jorhem & Sundström, 1995). Mushrooms can be used as bioindicators for lead soil pollution (Lodenius et al., 1981; Quinche, 1987).
Other studies indicate that several species of Lycoperdaceae have a capacity for the bioaccumulation of Pb. In this study, the Pb content of Lycoperdon perlatum agree with other authors (Tyler, 1980; Jorhem & Sundström, 1995).
The highest Pb concentrations in studies by Sesli & Tüzen (1999) and Tüzen et al. (1998) were found in collected roadside mushrooms belonging to the family Tricholomataceae. Our study agreed with other studies (Sesli & Tüzen, 1998; Tüzen et al., 1998).
In relation to the pollution source near main roads, Jorhem & Sundström (1995) concluded that lead was derived mainly from the contaminated roadside soil rather than from atmospheric deposition. The exposure time for many mushrooms is very short, which makes the deposition of Pb from vehicle exhausts a small problem that is continuing to decrease as the use of leaded petrol is phased out (Jorhem & Sundström, 1995).
The occurrence and distribution of different toxic components in certain mushrooms is not only a mycological theoretical problem, but also has practical environmental and toxicological aspects (Vetter, 1994). According to FAO/WHO (1989, 1993) acceptable weekly intakes of cadmium and lead for adults are 0.42-0.49 and 1.5-1.75 mg, respectively. The Pb and Cd levels in all studied species from both areas can be considered to be high and mushrooms from these sites should not be consumed.
In this study, the metal contents of macrofungi collected from two different areas were determined to be statistically different. Element content differed according to edibility, habitat and collection areas but no
0 2 4 6 8 10 12 14 16 1 2 3 4 5 6 7 8 9 10 11 12 13 14 15 16 17 18 19 20 21 22 23 24 Species number Concentration of Ni (mg/kg DW) Roadside Background
Figure 8. Comparison of mean
concentrations of Ni (mg/kg dry weight) in 24 species of mushrooms from roadside and background areas. 0 1 2 3 4 5 6 7 1 2 3 4 5 6 7 8 9 10 11 12 13 14 15 16 1 18 19 20 21 22 23 24 Species number Concentration of Pb (mg/kg DW) Roadside Background
Figure 9. Comparison of mean
concentrations of Pb (mg/kg dry weight) in 24 species of mushrooms from roadside and background areas.
relationship was observed among those factors. In this study element concentrations were primarily species-dependent. It was, therefore, rather difficult to determine the effect of environmental factors on the
concentrations of elements. Similar studies which include the analysis of various elements on a group of macrofungi species should be performed in order to explain the effect of environmental factors.
References
Breitanbach J, Kranzlin F (1984). Fungi of Switzerland. Vol. 2-3. Lucerne: Verlag Mycologia.
Demirbafl A (2001). Levels of trace elements in the fruiting bodies of mushrooms growing in the East Black Sea region. Energy Education Science & Technology 7(2): 67-81.
Falandysz J, Chwir A (1997). The concentrations and bioconcentrations factors for mercury in mushrooms from the Mierzeja Wislana sand-bar, Northern Poland. Sci Total Environ 203: 221-228. Falandysz J, Brzostowski A, Nosewicz M, Danisiewicz D, Frankowska A,
Apanasewicz D, Bielawski L (2000). Mercury in edible mushrooms from the area of the Trojmiejski Landscape Park. Bromat Chem Toksykol 33 (2):177-182.
FAO/WHO (1989). Evaluation of certain food additives and contaminants, 33. Report of the Joint FAO/WHO. Geneva: WHO Technical Report Series 776.
FAO/WHO (1993). Evaluation of certain food additives and contaminants. Geneva : WHO Technical Report Series 837.
Garcia MA, Alonsa J, Fernandez MI, Melgar MJ (1998). Lead content in edible wild mushrooms in Northwest Spain as indicator of environmental contamination. Arch Environ Contam Toxicol 34(4): 330-335.
Gast CH, Jansen E, Bierling J, Haanstra L (1988). Heavy metals in mushrooms and their relationship with soil characteristics. Chemosphere 17(4): 789-799.
Jorhem L, Sundström B (1995). Levels of some trace elements in edible fungi. Z Lebensm Unters Forsch 201: 311-316.
Kalac P, Niznanska M, Bevilaqua D, Staskova I (1996). Concentrations of mercury, copper, cadmium and lead in fruiting bodies of edible mushrooms in the vicinity of a mercury smelter and a copper smelter. Sci Total Environ 177: 251-258.
Kojo MR, Lodenius M (1989). Cadmium and mercury in macrofungi. Mechanisms of transport and accumulation. Angew Botanik 63: 279-292.
Kuusi T, Laaksovirta K, Livkkonen-Lilja H, Lodenius M, Piepponen S (1981). Lead, cadmium and mercury contents of fungi in the Helsinki area and in unpolluted control areas.Z Lebensm Unters Forsch 173: 261-267.
Laaksovirta K, Alakuijala P (1978). Lead, cadmium and zinc contents of fungi in the parks of Helsinki. Ann Bot Fennici 15: 253-257. Lodenius M, Kuusi T, Laaksovirta K, Liukkonen-Lilja H, Piepponen S
(1981). Lead, cadmium and mercury contents of fungi in Mikkeli, SE Finland. Ann Bot Fennici 18: 183-186.
Mandic ML, Grgic J, Grgic Z, Seruga M (1992). The natural levels of aluminum, cadmium and lead in wildlife mushrooms in Eastern Croatia. Deutscuhe Lebensmittel Rundschau 88(3):76-77.
Melgar MJ, Alonso J, Perez-Lopez M, Garcia MA (1998). Influence of some factors in toxicity and accumulation of cadmium from edible wild macrofungi in NW Spain. J Environ Sci Health B33(4): 439-455.
Mornand J (1990). Présence de métaux lourds dans les champignons. Bull oc Myc Fr 106: 31-46.
Moser M (1983). Keys to Agarics and Boleti. London: Gustav Fischer Verlag.
Mutsch F, Horak O, Kinzel H (1979). Spurenelemente in höheren pilzen. Z Pflanzenphysiol 94:1-10.
Quinche JP (1987). Le cadmium un element present en traces dans les sols, les plantes et les champignons. Revue Suisse Agric 19: 71-77.
Quinche JP (1992). Les teneurs en huit éléments traces des carpophores de Coprinus comatus. Mycol Helv 5: 133-142.
Salt DE, Blaylock M, Kumar NPBA, Dushenkov V, Ensley BD, Chet I, Raskin I (1995). Phytoremediaton: a novel strategy for the removel of toxic metals from the environment using plants. Biotechnology 13: 468-474.
Schellman B, Hilz M-J, Opitz O (1980). Cadmium-und Kupferausscheidung Nach Aufnahme Von Champignon-Mahizeiten.Z Lebensm Unters. Forsch 171:189192.
Schmitt JA, Meisch HU (1985). Cadmium in mushrooms-distribution, growth effects and binding. Trace Elements Med 2: 163-166. Sesli E, Tüzen M (1999). Levels of trace elements in the fruiting bodies
of macrofungi growing in the East Black Sea region of Turkey. Food Chem 65: 453-460.
Stijve T, Besson R (1976). Mercury cadmium and selenium contant of mushroom species belonging to the Genus Agaricus. Chemosphere 2:151-158.
Stijve T, Roschnik R, (1974). Mercury and methyl mercury content of different species of fungi. Mitt Geb Lebensmittelunters Hyg 65: 209-220.
Tyler G (1980). Metals in sporophores of Basidiomycetes.Transactions of the British Mycological Society 74: 41-49.
Tüzen M, Özdemir M, Demirbafl A (1998). Study of heavy metals in some cultivated and uncultivated mushrooms of Turkish origin. Food Chemistry 63(2): 247-251.
Vetter J (1994). Data on arsenic and cadmium contents of some common mushrooms. Toxicon 32: 11-15.