497 http://journals.tubitak.gov.tr/medical/ © TÜBİTAK
doi:10.3906/sag-1807-282
Reference ranges for serum immunoglobulin (IgG, IgA, and IgM) and
IgG subclass levels in healthy children
Rumeysa Olcay BAYRAM1, Hülya ÖZDEMIR1, Ayça EMSEN1, Hatice TÜRK DAĞI2, Hasibe ARTAÇ1,*
1Department of Pediatric Immunology and Allergy, Faculty of Medicine, Selçuk University, Konya, Turkey 2Department of Medical Microbiology, Faculty of Medicine, Selçuk University, Konya, Turkey
* Correspondence: [email protected]
1. Introduction
The serum immunoglobulin levels are the most important screening tests for determining primary and secondary immunodeficiencies (1). They are also important in evaluating different clinical conditions such as autoimmune diseases and chronic liver diseases (2,3). Reference ranges according to age for immunoglobulins (IgG, IgA, and IgM) and IgG subclass concentrations (IgGSc) vary depending on the region, source population, applied method, and time. For this reason, these values need to be updated for an accurate diagnosis in the same ethnic group and same region.
Primary immune deficiencies form a group of more than 350 diseases that affect the development and/or function of the immune system and are characterized by susceptibility to infections, autoimmune diseases and malignancy, and inherited gene defects. They are classified into nine different groups according to the component of the immune system that they affect (4). In pediatric clinical practice, severe, persistent, opportunistic or
recurrent infections are the most frequent indication for determination of serum immunoglobulin levels. The knowledge of immunoglobulin isotype provides useful insight into complex humoral immune response. The antibody deficiencies are the most common types of the primary immunodeficiencies. According to the European Society for Immunodeficiencies, the proportion of antibody deficiencies accounts for about 60% of all primary immunodeficiencies (5). This rate was found to be 73% in Turkey and 92% in the province of Konya in previous studies (6,7).
The initial laboratory examination of humoral immunity consists of measuring levels of various immunoglobulin isotypes (IgG, IgA, IgM, and possibly IgGSc) in serum and comparison with values from normal age-matched controls. The assessment is clinically important when they are within the normal age-specific reference range. Because of the limited number of studies (8–10) and the necessity of an update, this study aimed to determine reference intervals in healthy children by measuring the levels of serum immunoglobulin and IgGSc.
Background/aim: The serum immunoglobulin levels are used routinely in clinical practice because they provide key information on
the humoral immune status. This study aimed to determine the age-related reference values of serum immunoglobulin levels in healthy children.
Materials and methods: A total of 330 healthy children, aged between 0 and 18 years, were included in this study. The serum
immunoglobulin levels were measured using a nephelometric method in a total of 11 groups, each group consisting of 30 individuals, and IgG subclasses in 6 groups of children aged more than 2 years.
Results: The serum IgG levels were high during the newborn period, decreased until the sixth month, and again increased to a maximum
level at the age of 18 years. The level of IgA was found to be extremely low in the newborn period and then increased with age. While the lowest value was in the newborn period for serum IgM level, the highest value was in the 16- to 18-year-old period. The IgG subclasses varied depending on the age groups.
Conclusion: The updated reference intervals of immunoglobulin levels in children may be used for the accurate diagnosis of immune
deficiencies.
Key words: Healthy children, IgG subclasses, reference interval, serum immunoglobulins
Received: 30.07.2018 Accepted/Published Online: 20.01.2019 Final Version: 18.04.2019
2. Materials and methods 2.1. Study population
A total of 330 children without any diseases, between the ages of 0 and 18 years, were included in the study. During the first step for the study, serum samples of 540 healthy children were collected after written informed consent was obtained from all their parents. A form, which included information on sex, height, weight, date of birth, age at the time of admission, address and telephone information, the history of immune deficiency, allergic and chronic diseases was filled out. Of these serum samples collected over a 2-year period, 210 of the participants were removed from the study due to recurrent infections and various reasons including allergic, rheumatological, and gastrointestinal diseases detected during the children’s follow-up. Healthy children were divided into 11 groups according to age as follows: 30 newborns between 0 and 1 month; 30 children each between 1 and 3 months, 4 and 6 months, 7 and 12 months, 13 and 24 months, 25 and 36 months, 3 and 5 years, 6 and 8 years, 9 and 11 years, and 12 and 16 years, and 16 and 18 years. The serum immunoglobulin levels were measured using a nephelometric method in a total of 11 groups, each group consisting of 30 individuals, and IgG subclasses in 6 groups of children aged more than 2 years. This study was approved by the Ethical Committee of Selçuk University Medical Faculty.
2.2. Laboratory analysis
The levels of serum IgA, IgG, IgM, and IgG1, IgG2, IgG3, IgG4 were measured by the nephelometric method using the IMMAGE 800 device (Beckman Coulter, Inc., Brea, CA, USA). The values of serum immunoglobulin and IgG subgroup levels were expressed in mg/dL. The IMMAGE Immunochemistry Systems kits for IgA, IgG, and IgM and the kits for the IMMAGE 800 device (The Binding Site Group Ltd., UK) for the IgGSc were used. For measuring IgA, IgG, and IgM parameters (IMMAGE Immunochemistry Systems, Chemistry References, Beckman Coulter, Inc.) and IgGSc (The Binding Site Ltd.), an internal quality control study was performed using two levels of control serum. An international interlaboratory comparison program (RIQAS International Quality Assessment Scheme, UK) was followed for the external quality control.
2.3. Statistical analysis
SPSS for Windows 15.0 was used for statistical analyses. While the IgG, IgA, and IgM values were examined for the groups after 1–30 days, 1–3 months, 4–6 months, 7–12 months, 13–24 months, 25–36 months, 3–5 years, 6–8 years, 9–11 years, 12–16 years, and 16–18 years; the IgG1, IgG2, IgG3, and IgG4 values were measured for the groups 25–36 months, 3–5 years, 6–8 years, 9–11 years, 12–16 years, and 16–18 years. Descriptive statistics, such as geometric mean, arithmetic mean, minimum, and
maximum values, and mean ± 2 standard deviation values for each age group, were given. A 95% confidence interval was also established for each age group.
The data were divided into subgroups according to sex and age group. The difference between the age groups and sex (IgG, IgA, IgM, IgG1, IgG2, IgG3, and IgG4) was investigated. When comparing the differences between the two groups, the t-test was used in independent groups showing normal distribution and the Mann–Whitney U test was used for abnormal distribution. When comparing the mean between more than two groups, the one-way analysis of variance (ANOVA) was used for normal distribution and the Kruskal–Wallis test was used for the abnormal distribution. The significance level was accepted as P < 0.05.
3. Results
In this study, 177 of 330 patients were male and 153 were female. When serum immunoglobulins and IgGSc were evaluated according to sex, the serum IgM and IgG2 levels were higher in females (P = 0.004 and 0.011, respectively). The serum IgM levels were significantly different at the age groups including 1–30 days, 6–8 years, and 12–16 years (P = 0.04, P = 0.002 and P = 0.01, respectively). The serum IgG2 levels were higher in females at the age of 6–8 years and 16–18 years (P = 0.04 and P = 0.003, respectively). No significant difference in IgG, IgA, IgG1, IgG3, and IgG4 was observed between boys and girls (Table 1).
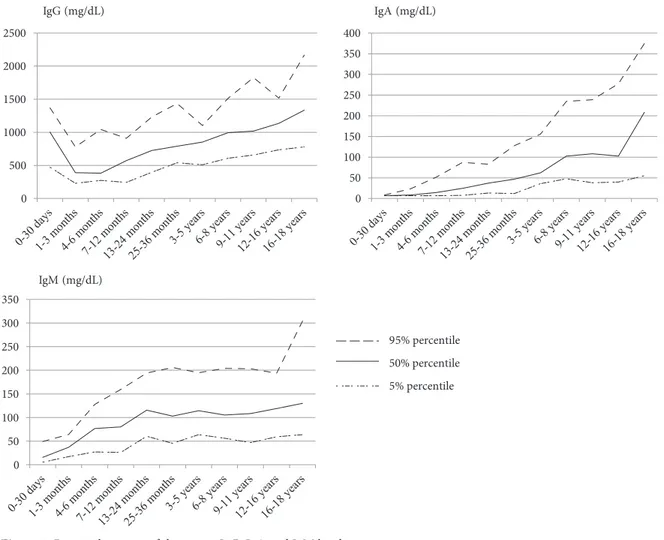
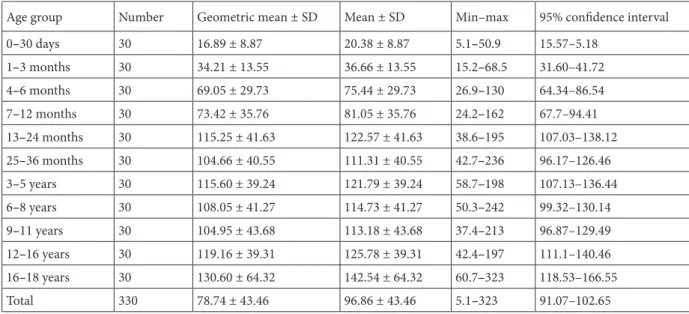
The difference in the IgG, IgA, IgM, and IgGSc according to age was statistically analyzed using the ANOVA and Kruskal–Wallis tests (Table 2). The geometric mean, arithmetic mean, standard deviation, minimum and maximum values, and 95% confidence intervals for the serum IgG, IgA, IgM, and IgGSc concentrations are shown in Tables 3–9.
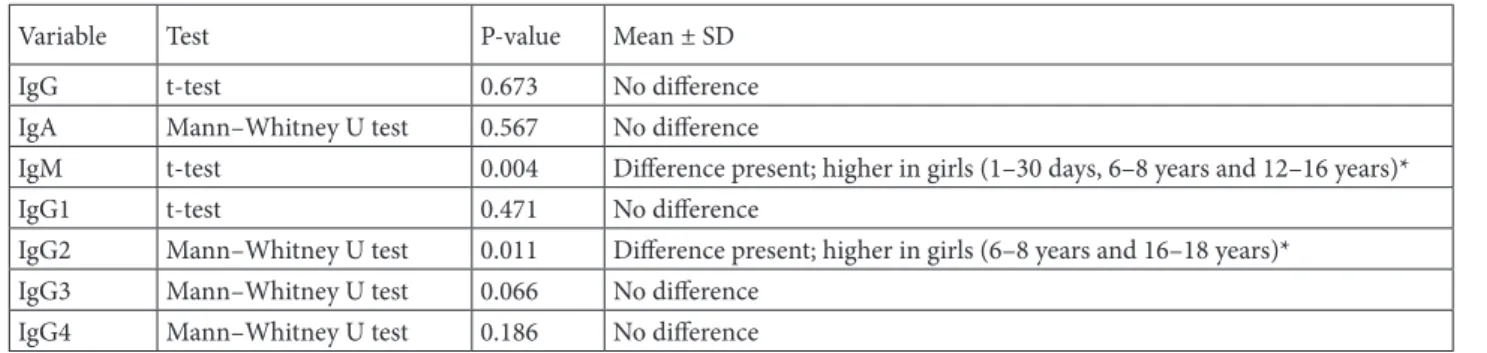
3.1. Serum immunoglobulin levels (IgG, IgA, IgM) Age-related changes in the serum IgG, IgA, and IgM (the 5%, 50%, 95% percentile ranges) are shown in Figure 1. According to age groups, the serum IgG levels were found to be high in the newborn period (0–30 days) due to maternal IgG. These parameters were the lowest level due to loss of antibodies from the mother and inadequate synthesis in the second and third groups (1–6 months). Starting from the 6th month, the serum IgG levels increased, reaching maximum values at 16–18 years of age (Table 3).
No significant difference was detected according to age for serum IgA levels. Although the IgA levels were very low during the neonatal period, they increased with age and reached their maximum value at the age of 18 years (Table 4).
The IgM levels increased steadily after neonatal period but were low slightly in the 25- to 36-month group and after 6 years of age until the age of 11 years compared to the
Table 1. Examination of variables according to sex.
Variable Test P-value Mean ± SD
IgG t-test 0.673 No difference
IgA Mann–Whitney U test 0.567 No difference
IgM t-test 0.004 Difference present; higher in girls (1–30 days, 6–8 years and 12–16 years)*
IgG1 t-test 0.471 No difference
IgG2 Mann–Whitney U test 0.011 Difference present; higher in girls (6–8 years and 16–18 years)*
IgG3 Mann–Whitney U test 0.066 No difference
IgG4 Mann–Whitney U test 0.186 No difference
IgG: Immunoglobulin G, IgA: Immunoglobulin A, IgM: Immunoglobulin M
* The difference in the serum IgM and IGG2 levels according to sex was detected in these age groups.
Table 2. Examination of variables according to age.
Variable Test P-value Decision
IgG ANOVA 0.000 Difference present (it increased with age, except for the 0- to 1-month age group; the highest value was found in the 16- to 18-year age range)
IgA Kruskal–Wallis test 0.567 No difference
IgM ANOVA 0.000 Difference present (while the highest value was found in the 16- to 18-year age range, the lowest was found in the 0- to 1-month age group) IgG1 ANOVA 0.000 Difference present (while the highest value was found in the 16- to 18-year age range, the lowest was found in the 3- to 5-year age group) IgG2 Kruskal–Wallis test 0.011 Difference present (the value increased with age)
IgG3 Kruskal–Wallis test 0.066 No difference
IgG4 Kruskal–Wallis test 0.186 No difference
ANOVA: Analysis of variance
IgG; Immunoglobulin G, IgA: Immunoglobulin A, IgM: Immunoglobulin M
Table 3. Age-related serum IgG levels in healthy children (mg/dL).
Age group Number Geometric mean ± SD Mean ± SD Min–max 95% confidence interval
0–30 days 30 913.85 ± 262.19 953 ± 262.19 399–1480 855.1–1050.9 1–3 months 30 409.86 ± 145.59 429.5 ± 145.59 217–981 375.14–483.86 4–6 months 30 440.17 ± 236.8 482.43 ± 236.8 270–1110 394.01–570.86 7–12 months 30 536.79 ± 186.62 568.97 ± 186.62 242–977 499.28–638.65 13–24 months 30 726.79 ± 238.61 761.7 ± 238.61 389–1260 672.6–850.8 25–36 months 30 786.41 ± 249.14 811.5 ± 249.14 486–1970 718.47–904.53 3–5 years 30 823.19 ± 164.19 839.87 ± 164.19 457–1120 778.56–901.18 6–8 years 30 982.86 ± 255.53 1014.93 ± 255.53 483–1580 919.52–1110.35 9–11 years 30 1016.12 ± 322.27 1055.43 ± 322.27 642–2290 935.09–1175.77 12–16 years 30 1123.56 ± 203.83 1142.07 ± 203.83 636–1610 1065.96–1218.18 16–18 years 30 1277.20 ± 361.89 1322.77 ± 361.89 688–2430 1187.63–1457.9 Total 330 773.94 ± 361.76 852.92 ± 361.76 217–2430 813.75–892.1 IgG: Immunoglobulin G
0 500 1000 1500 2000 2500 0 50 100 150 200 250 300 350 400 0 50 100 150 200 250 300 350 IgG (mg/dL) IgA (mg/dL) 95% percentile 50% percentile 5% percentile IgM (mg/dL)
Figure 1. Percentile ranges of the serum IgG, IgA and IgM levels.
Table 4. Age-related serum IgA levels in healthy children (mg/dL).
Age group Number Geometric mean ± SD Mean ± SD Min–max 95% confidence interval
0–30 days 30 6.77 ± 0.45 6.79 ± 0.45 6.67–8.75 6.62–6.95 1–3 months 30 9.58 ± 5.16 10.53 ± 5.16 6.67–24.6 8.57–12.49 4–6 months 30 17.23 ± 9.77 19.86 ± 9.77 6.67–53 14.70–25.01 7–12 months 30 23.63 ± 12.37 29.41 ± 12.37 6.68–114 21.06–37.77 13–24 months 30 34.09 ± 17.1 37.62 ± 17.1 13.1–103 31.34– 47.85 25–36 months 30 48.87 ± 24.52 59.77 ± 24.52 6.67–135 46.05–71.38 3–5 years 30 62.75 ± 34.05 68.98 ± 34.05 35.7–192 56.27–81.7 6–8 years 30 97.38 ± 49.66 106.9 ± 49.66 44.8–276 88.36–125.45 9–11 years 30 102.27 ± 47.05 115.99 ± 47.05 32.6–262 94.69–137.29 12–16 years 30 112.16 ± 47.51 120.90 ± 47.51 36.4–305 99.29–172.11 16–18 years 30 179.21 ± 89.92 201.84 ± 89.92 46.3–385 168.26– 235.41 Total 330 41.04 ± 32.13 70.78 ± 32.13 6.67–385 64.07–80.54 IgA: Immunoglobulin A
other age groups. After the age of 11 years, they increased again and reached their maximum value in the 16 to 18 year age group (Table 5).
3.2. Serum immunoglobulin G subclass levels (IgG1, IgG2, IgG3, IgG4)
The 5%, %50, and %95 percentile ranges (in increasing order to levels in the graphs) for the IgG subclasses are shown in Figure 2. According to age, the highest value was in the 16 to 18 years of age range for serum IgG1 level, while the lowest value was in the 3 to 4 years of age. The serum IgG2 values increased with age. No statistically significant difference was observed in the serum IgG3 and IgG4 levels according to age (Tables 6–9).
The IgG1 levels were the lowest in the 25- to 36-month group and increased after 36 months until the age of 9 years. A second decline was seen in the 9- to 11-year age group, and another increase was seen at the age of 12–16 years. After the age of 16 years, they reached the adult level with a third decline (Table 6).
The IgG2 levels increased from the 25th month onward and reached maximum values at the age of 16–18 years (Table 7).
The IgG3 levels showed a partial decline at the age of 6–8 years and then continued to increase steadily. The levels reached a maximum value at the age of 16–18 years (Table 8).
Although the IgG4 levels showed fluctuations at the age of 2–11 years, they continued to increase after the age of 11 years and reached the maximum values in the 16- to 18-year age group (Table 9).
4. Discussion
The first stage in evaluating possible underlying immunodeficiency is the measurement of blood count and serum immunoglobulin levels (11). The standards for changes in antibody production by age during childhood vary according to different ethnic groups and settlement regions. Hence, the immunoglobulin levels should be compared with age-appropriate reference values according to the 95% confidence interval. In this study, the distribution of serum immunoglobulins and IgGSc according to age and sex were examined in children and the reference intervals were determined.
In the present study, the serum IgG levels were extremely high in the newborn period due to the IgG passed on from the mother. These parameters fell to the lowest level due to loss of antibodies from the mother and inadequate synthesis in the baby in the second and third groups (1–6 months). Again, the serum IgG levels increased with age, starting from the 6th month, reaching maximum values at 16–18 years of age. However, the IgA levels were extremely low in the newborn period and increased with age, reaching their maximum values at the age of 18 years. These results were compatible with the findings of studies conducted in Turkey and quoted in the literature (8–10, 12). The IgM levels did not show a continuous increase in our study, contrary to the previous studies (8–10, 12). The continuous increase seen in the 1st month fluctuated till 2 years of age. Low values were determined in the 25- to 36-month group, and then from the ages of 6 years until 11 years. After the age of 11 years,
Table 5. Age-related serum IgM levels in healthy children (mg/dL).
Age group Number Geometric mean ± SD Mean ± SD Min–max 95% confidence interval
0–30 days 30 16.89 ± 8.87 20.38 ± 8.87 5.1–50.9 15.57–5.18 1–3 months 30 34.21 ± 13.55 36.66 ± 13.55 15.2–68.5 31.60–41.72 4–6 months 30 69.05 ± 29.73 75.44 ± 29.73 26.9–130 64.34–86.54 7–12 months 30 73.42 ± 35.76 81.05 ± 35.76 24.2–162 67.7–94.41 13–24 months 30 115.25 ± 41.63 122.57 ± 41.63 38.6–195 107.03–138.12 25–36 months 30 104.66 ± 40.55 111.31 ± 40.55 42.7–236 96.17–126.46 3–5 years 30 115.60 ± 39.24 121.79 ± 39.24 58.7–198 107.13–136.44 6–8 years 30 108.05 ± 41.27 114.73 ± 41.27 50.3–242 99.32–130.14 9–11 years 30 104.95 ± 43.68 113.18 ± 43.68 37.4–213 96.87–129.49 12–16 years 30 119.16 ± 39.31 125.78 ± 39.31 42.4–197 111.1–140.46 16–18 years 30 130.60 ± 64.32 142.54 ± 64.32 60.7–323 118.53–166.55 Total 330 78.74 ± 43.46 96.86 ± 43.46 5.1–323 91.07–102.65 IgM: Immunoglobulin M
they increased again and reached their maximum value in the age group of 16 to 18 years.
Previous studies explored the normal values of immunoglobulin levels which obtained by different methods, such as enzyme-linked immunosorbent
assay (ELISA), radioimmunoassay, turbidimetry, and nephelometry, in children and adults (12–14). The International Federation of Clinical Chemistry and Laboratory suggests that each laboratory should calculate its own reference values and publish, together with the
0 200 400 600 800 1000 1200 1400 25-36
months years3-5 years6-8 years9-11 12-16years 16-18years
0 100 200 300 400 500 600 700 25-36
months years3-5 years6-8 years9-11 12-16years 16-18years
0 50 100 150 200 250 25-36
months years3-5 years6-8 years9-11 12-16years 16-18years
0 20 40 60 80 100 120 140 160 25-36
months years3-5 years6-8 years9-11 12-16years 16-18years
IgG1 (mg/dL) IgG2 (mg/dL)
IgG3 (mg/dL) IgG4 (mg/dL)
95% percentile 50% percentile 5% percentile
Figure 2. Percentile ranges of the serum IgG subclasses (IgG1, IgG2, IgG3 and IgG4) levels. Table 6. Age-related serum IgG1 levels in healthy children (mg/dL).
Age group Number Geometric mean ± SD Mean ± SD Min–max 95% confidence interval
25–36 months 30 510.74 ± 192.04 531.7 ± 192.04 309–1450 459.98–603.41 3–5 years 30 506.73 ± 82.28 513.93 ± 82.28 273–679 483.20–544.65 6–8 years 30 567.94 ± 121.64 581 ± 121.64 292–781 535.87– 626.72 9–11 years 30 634.17 ± 216.39 660.23 ± 216.39 410–153 579.43–741.03 12–16 years 30 635.52 ± 131.01 648.53 ± 131.01 344–958 599.61–697.45 16–18 years 30 645.35 ± 229.62 674.5 ± 229.62 403–1520 588.75–760.24 Total 180 580.41 ± 179.97 601.7 ± 179.97 273–1530 575.22–628.17 IgG1: Immunoglobulin G1
National Committee for Clinical Laboratory Standard, guiding standards for laboratories (15). Studies on reference intervals of serum immunoglobulins and IgGSc, which were used in the diagnosis and follow-up of various immunological diseases, demonstrated that these values changed depending on the methods used, patient population, age, and sex. The inconsistencies seen in some of the earlier studies might be due to the method of analysis. In the earlier studies, the serum immunoglobulins
and IgGSc were measured using radial immunodiffusion, which was then changed with a method developed based on ELISA using monoclonal antibodies. Nowadays, the nephelometric measurement method, which is faster and has less variability, is more commonly used (14,16). In the present study, the immunoglobulin levels were measured by the nephelometric method.
The first study performed on this subject in Turkey was in 1996 in Ankara, where the normal values of the IgG, IgA,
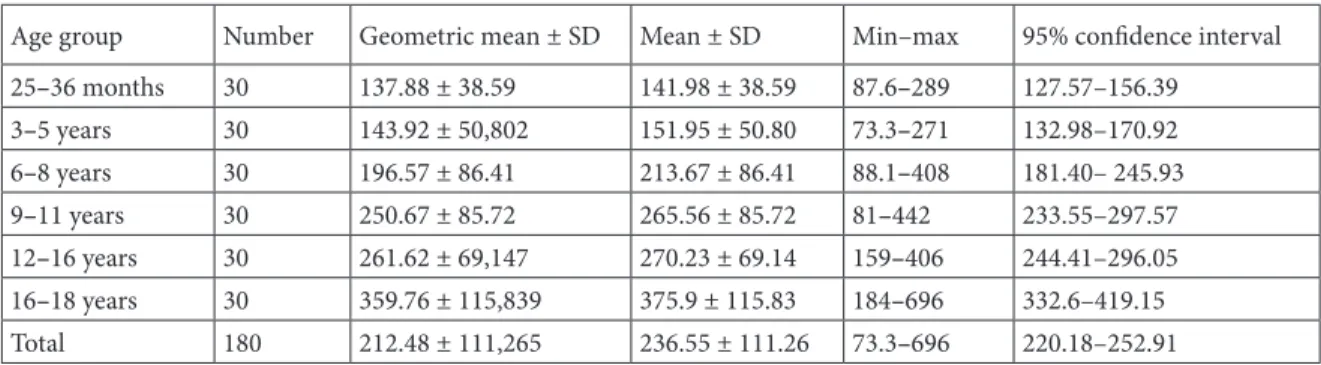
Table 7. Age-related serum IgG2 levels in healthy children (mg/dL).
Age group Number Geometric mean ± SD Mean ± SD Min–max 95% confidence interval
25–36 months 30 137.88 ± 38.59 141.98 ± 38.59 87.6–289 127.57–156.39 3–5 years 30 143.92 ± 50,802 151.95 ± 50.80 73.3–271 132.98–170.92 6–8 years 30 196.57 ± 86.41 213.67 ± 86.41 88.1–408 181.40– 245.93 9–11 years 30 250.67 ± 85.72 265.56 ± 85.72 81–442 233.55–297.57 12–16 years 30 261.62 ± 69,147 270.23 ± 69.14 159–406 244.41–296.05 16–18 years 30 359.76 ± 115,839 375.9 ± 115.83 184–696 332.6–419.15 Total 180 212.48 ± 111,265 236.55 ± 111.26 73.3–696 220.18–252.91 IgG2: Immunoglobulin G2
Table 9. Age-related serum IgG4 levels in healthy children (mg/dL).
Age group Number Geometric mean ± SD Mean ± SD Min–max 95% confidence interval
25–36 months 30 15.53 ± 8.54 18.37 ± 8.54 7.86–57.5 13.67–23.07 3–5 years 30 30.81 ± 15.42 40.75 ± 15.42 7.86–122 28.84–52.65 6–8 years 30 39.33 ± 23.05 50.94 ± 23.05 7.86–157 37.11–64.77 9–11 years 30 25.36 ± 15.39 35.51 ± 15.39 7.86–93.8 24.95–46.07 12–16 years 30 31.03 ± 16.73 39.51 ± 16.73 7.86–119 29.53–49.49 16–18 years 30 38.89 ± 23.08 50.16 ± 23.08 7.86–157 36.32–64.01 Total 180 28.71 ± 15.76 39.21 ± 157.66 7.86–157 34.56–43.86 IgG4: Immunoglobulin G4
Table 8. Age-related serum IgG3 levels in healthy children (mg/dL).
Age group Number Geometric mean ± SD Mean ± SD Min–max 95% confidence interval
25–36 months 30 48.78 ± 16.90 51.73 ± 16.90 19.8–75 45.41–58.04 3–5 years 30 44.05 ± 21.55 45.26 ± 21.55 20.8–93.2 37.21–53.30 6–8 years 30 56.82 ± 30.55 65.53 ± 30.55 18.9–135 53.01–78.06 9–11 years 30 77.59 ± 37.37 84.19 ± 37.37 34.1–200 70.24–98.15 12–16 years 30 75.30 ± 31.86 81.39 ± 31.86 35.2–150 69.49–93.28 16–18 years 30 86.33 ± 43.29 95.12 ± 43.29 29.3–200 78.95–111.28 Total 180 62.72 ± 37.13 70.53 ± 30.13 18.9–200 65.19–75.837 IgG3: Immunoglobulin G3
and IgM levels were determined using the turbidimetric method. The serum IgG fell to 39% of the adult level after 31 days. It was 52% at the age of 1 year, increased to 97% of the adult level at the age of 7 years, and elevated above the adult level between the ages of 11 and 16 years (8). Tezcan et al. observed a continuous increase in the IgM levels in the 1st month, reaching close to the adult level at early ages. Between the ages of 13 and 16 years, the levels reached the adult levels. Although the IgA levels were extremely low during the neonatal period, they increased with age and passed 90% of the adult level at the age of 13 years. These results were consistent with the findings of our study.
The second study was conducted in 2006 by Aksu et al. using the nephelometric method, and the reference ranges of IgG, IgA, IgM, and IgGSc were determined. In that study, the levels of serum IgG and IgGSc were higher in the newborn period (0–30 days) due to maternal IgG. In children in the second group (1–5 months), these parameters fell to the lowest level due to loss of antibodies from the mother and inadequate synthesis in the baby. After the 6th to 8th month, an increase in immunoglobulins and IgGSc according to age was observed. The IgG, IgA, IgG1, and IgG2 levels increased until the age of 9–10 years, and then reached a plateau. The IgG3 and IgG4 levels increased up to the ages of 7–8 years and then reached a plateau. The IgM levels increased earlier and reached a balanced value after the first year of life (9). In our study, all immunoglobulin levels increased with age and no plateau was observed.
The third study was carried out in İzmir in 2010 using the nephelometric method, and the reference ranges of IgG, IgA, IgM, and IgGSc were determined. In females, the reference intervals of all tests were found to be higher in females compared with males (10). No newborn separation was done, and neonates were evaluated after 0–6 months. In that study, the IgG values in the 95% confidence interval were found to be lower in the first 12 months and then increased in the later age groups. This might be due to the fact that fewer data were available on the age groups in that study and statistical analysis was lacking.
The IgG subclass deficiencies are defined as one or both of the IgGSc below normal values according to age, while the IgG, IgA, and IgM values are normal. Studies have shown that IgG1 and IgG3 levels reach 75% of the adult level at 5 years of age. The level of IgG2 reaches 75% of the adult level at 14 years of age. However, the normal limits of IgG4 could not be fully determined and IgG4 deficiency should not be diagnosed under the age of 10 years (1). In our study, the level of IgG1 reached 76% of the 16- to 18-year age group values at the age of 3–5 18-years, and the level of IgG2 reached approximately 70% of the 16- to 18-year age group level between 9 and 11 years of age and the level of IgG3 between the ages of 6 and 8 years. The level of IgG4 the 3- to 5-year age group reached 80% of the biggest
childhood age group. IgG4 is a blocking antibody and does not bind to its complement. Its level decreases in allergic diseases and increases with allergen immunotherapy. We observed that the adult levels can be reached earlier in the population used in this study. It is also important for determining the upper limits that regulate IgG4-related diseases.
Several studies have reported IgGSc in healthy children and adults (17,18). We observed the IgG1, IgG2, and IgG3 levels increased with age. The maximum reference values for all IgGSc were reached in the 16- to 18-year age group. The results were broadly similar to those reported in previous studies. Fluctuations in IgG4 levels were observed between the age groups in our study, whereas IgG4 concentrations continued to increase with age in some studies (18). Our results are similar to the findings of a Thai study (19).
The present study had some limitations. Our population included healthy children who live in Konya and therefore the selected samples may not totally reflect the Turkish population. However, Konya is a big city in the Central Anatolia including admixture of Turkish children, so we think that the updated reference values may be used in Turkey. The relatively small study population may reduce the power of the study and the national database is needed for serum immunoglobulin levels in a larger Turkish population.
In conclusion, the present study provided usable data on normal values and age-related changes in serum immunoglobulins and IgGSc. It constituted a step in establishing a reliable reference source for laboratories. It made an important contribution, especially in determining the reference values of regional immunoglobulins and IgGSc, for the childhood age group. Previous studies suggested that issues, such as difficulties encountered in identifying reference individuals, limitations of small laboratories, and standardization of regional and biological variations, need to be resolved with multicentered and national reference policies. A healthy regional database should be maintained with the participation of larger sample groups and by continuing these studies. The reference values for serum immunoglobulin levels and IgGSc in healthy children were updated with this study. Autosomal recessive inherited primary immune deficiencies are common in Turkey with high rates of consanguineous marriages. This study is important in terms of being a reference source for assessing immunoglobulin levels for accurate diagnosis, treatment, and follow-up of primary and secondary immunodeficiencies in children.
Acknowledgments
We thank the children and their families for participating. The study was supported by the Scientific Research Projects of Selçuk University (Project No: 15102034).
References
1. Bonilla FA, Khan DA, Ballas ZK, Chinen J, Frank MM, Hsu JT, Keller M, Kobrynski LJ, Komarow HD, Mazer B et al. Practice parameter for the diagnosis and management of primary immunodeficiency. J Allergy Clin Immunol 2015; 136: 1186-1205.
2. Zhang H, Li P, Wu D, Xu D, Hou Y, Wang Q, Li M, Li Y, Zeng X, Zhang F et al. Serum IgG subclasses in autoimmune diseases. Medicine (Baltimore) 2015; 94: e387.
3. Fallatah HI, Akbar HO. Elevated serum immunoglobulin G levels in patients with chronic liver disease in comparison to patients with autoimmune hepatitis. Libyan J Med 2010; 5: 4857.
4. Bousfiha A, Jeddane L, Picard C, Ailal F, Bobby Gaspar H, Al-Herz W, Chatila T, Crow YJ, Cunningham-Rundles C, Etzioni A et al. The 2017 IUIS Phenotypic classification for primary immunodeficiencies. J Clin Immunol 2018; 38: 129-143. 5. Grimbacher B. ESID Registry Working Party. The European
Society for Immunodeficiencies (ESID) registry 2014. Clin Exp Immunol 2014; 178: 18-20.
6. Kilic SS, Ozel M, Hafizoglu D, Karaca NE, Aksu G, Kutukculer N. The prevalences [correction] and patient characteristics of primary immunodeficiency diseases in Turkey--two centers study. J Clin Immunol 2013; 33: 74-83.
7. Yorulmaz A, Artaç H, Kara R, Reisli İ. Retrospective evaluation of 1054 patients with primary immunodeficiency. Asthma Allergy Immunology 2008; 6: 127-134.
8. Tezcan İ, Berkel Aİ, Ersoy F, Sanal Ö. Sağlıklı Türk çocukları ve erişkinlerde türbimetrik yöntemle bakılan serum immünglobülin düzeyleri. Çocuk Sağlığı ve Hastalıkları Dergisi 1996; 39: 649-656 (article in Turkish).
9. Aksu G, Genel F, Koturoğlu G, Kurugöl Z, Kütükçüler N. Serum immunoglobulin (IgG, IgM, IgA) and IgG subclass concentrations in healthy children: a study using nephelometric technique. Turk J Pediatr 2006; 48: 19-24.
10. Baskın Y, Yiğitbaşı T, Afacan G. Reference intervals for serum immunoglobulin (IGA, IGG, IGM) and IGG subclasses in healthy subjects. Turk J Biochem 2010; 35: 325-332.
11. Vries E, European Society for Immunodeficiencies (ESID) members. Patient-centred screening for primary immunodeficiency, a multi-stage diagnostic protocol designed for non-immunologists: 2011 update. Clin Exp Immunol 2012; 167: 108-119.
12. Belldegrin A, Shoenfeld Y, Pick Al, Vana D. Age related distribution of serum immunoglobulin concentration in 1003 healthy children and adults. Biomedicine 1980; 33: 8-12. 13. Stiehm ER, Fudenberg HH. Serum levels of immune globulins
in health and disease: a survey. Pediatrics 1966; 37: 715-727. 14. Pressac M, Allouche F, Circaud R, Aymard P. Evaluation of
human IgG subclass assays on Beckman array. Ann Clin Biochem 1995; 32: 281-288.
15. Solberg HE. The IFCC recommendation on estimation of reference intervals. The RefVal program. Clin Chem Lab Med 2004; 42: 710-714.
16. Soldin SJ, Bailey J, Beatey J, Bjorn S, Hicks JM. Pediatric reference ranges for immunoglobulins G, A and M on the Behring nephelometer. Clin Chem 1996; 42: S308.
17. Parker AR, Skold M, Ramsden DB, Ocejo-Vinyals JG, López-Hoyos M, Harding S. The clinical utility of measuring IgG subclass immunoglobulins during immunological investigation for suspected primary antibody deficiencies. Lab Med 2017; 48: 314-325.
18. Schauer U, Stemberg F, Rieger CH, Borte M, Schubert S, Riedel F, Herz U, Renz H, Wick M, Carr-Smith HD et al. IgG. IgG subclass concentrations in certified reference material 470 and reference values for children and adults determined with the binding site reagents. Clin Chem 2003; 49: 1924-1929. 19. Sitcharungsi R, Ananworanich J, Vilaiyuk S, Apornpong T,
Bunupuradah T, Pornvoranunt A, Nouanthong P, Phasomsap C, Khupulsup K, Pancharoen C et al. HIV-NAT 108 Study Group. Nephelometry determined serum immunoglobulin isotypes in healthy Thai children aged 2-15 years. Microbiol Immunol 2012; 56: 117-122.