T.C.
SELÇUK UNIVERSITY
GRADUATE SCHOOL OF NATURAL AND APPLIED SCIENCE
TRADE OPPORTUNITY OF POTENTIAL AGRICULTURAL
COMMODITIES
BETWEEN TURKEY AND INDONESIA Hari HARYADI
Master Thesis
Agricultural Economics Department
May-2014 KONYA All Rights Are Reserved
i
iii ÖZET YÜKSEK LİSANS
TURKİYE VE ENDONEZYA ARASINDA TARIMSAL EMTIALARA DAYALI TİCARET FIRSATLARI
Hari HARYADI
Selçuk Üniversitesi Fen Bilimleri Enstitüsü Tarım Ekonomisi Anabilim Dalı Danışman: Prof. Dr. Cennet OĞUZ
2014, 120 Sayfa Jüri
Prof. Dr. Cennet OĞUZ Prof. Dr. Kenan PEKER Doç. Dr. SEYİT ALİ KAYIŞ
Bu çalışma Haziran 2013 ile Ocak 2014 tarihleri arasında Endonezya ve Türkiye’de gerçekleştirilmiştir. Bu çalışmanın amacı Türkiye ile Endonezya arasında ticaret hacmine sahip 3 önemli tarımsal emtianın ticaret potansiyelini ve endüstriyel cazibesini SWOT analizi yöntemi ile analiz etmektir. Ticaret hacmine sahip 3 önemli emtianın sanayi rekabet gücü de ayrıca ele alınmıştır. Bu çalışmada nitel,nicel birincil ve ikincil veriler kullanılmıştır. Birincil veriler araştırma amaçları uyarınca gayelı örnekleme yöntemi ile elde edilmiştir ve veriler üzerinde Online/yüzyüze görüşme usulü ile uzmanların görüşleri alınarak Odak Grup Tartışması (OGT) gerçekleştirilmiştir. İkincil verileri Birleşmiş Milletler (UN) Comtrade, FAOSTAT, IMF, Dünya Bankası, Ticaret Bakanlıkları, Tarım Bakanlıkları ve diğer ilgili kurumların verileri oluşturmaktadır. Çalışmanın açıklayıcı verileri, SWOT (Güçlü yanlar, Zayıf yanlar, Fırsatlar, Tehditler) matris metodu, SOR (Stratejik yönelim) matris metodu, İç Faktör Analizi (IFAS), Dış Faktör Analizi (EFAS), Stratejik Konumu ve Eylem Değerlendirme (SPACE) ve Porter'ın Beş Rekabet Güçleri Matrisi yöntemleri kullanılarak analiz edilmistir. Çalışmanın sonucunda Türkiye’nin Endonezya’ya ihraç etmekte güçlü olduğu ilk üç ürün Buğday, Mısır ve Pamuk olarak tespit edilmiştir. Endonezya’nın Türkiye’ye ihraç etmekte güçlü olduğu ilk üç ürün ise Palm Yağı, Kauçuk ve Muz şeklinde belirlenmiştir. Türkiye ve Endonezya arasında tarımsal emtia ticaretinin eşit koşullu durumda olduğu iç-dış faktörlerin analizi diyagramına göre (X = 0.67; Y = 1.42), (X = 1.31; Y = 0.57) tespit edilmiştir. Bu tespit ile SOR analizinden elde edilen sonuçlar neticesinde çalışmanın ana tavsiyesini Türkiye’nin piyasada rekabet gücünü arttırmak için uygulayacağı strateji öncelikle saldırı stratejisi daha sonra savunma stratejisidir. Öncelikli saldırı stratejisinin ulusal tarım sanayisinin iki ülke arasında pazar payı elde etme kabiliyeti için daha faydalı olduğu yapılan analiz ile tespit edilmiştir.
iv ABSTRACT MS THESIS
TRADE OPPORTUNITY OF POTENTIAL AGRICULTURAL COMMODITIES BETWEEN TURKEY AND INDONESIA
Hari HARYADI
THE GRADUATE SCHOOL OF NATURAL AND APPLIED SCIENCE OF SELÇUK UNIVERSITY
THE DEGREE OF MASTER OF SCIENCE IN AGRICULTURAL ECONOMICS
Advisor : Prof. Dr. Cennet OĞUZ 2014, 120 Pages
Jury
Prof. Dr. Cennet OĞUZ Prof. Dr. Kenan PEKER Doç. Dr. SEYİT ALİ KAYIŞ
This study was conducted from June 2013 to January 2014 in Indonesia and Turkey. The aims of this study to analyze the Strengths, Weaknesses, Opportunities, and Threats (SWOT) of trade relations in macro-scale of the agricultural commodities, to analyze the industry attractiveness, trade potential, also strategic orientation of the three leading agricultural commodities traded between Turkey and Indonesia, and to analyze the industry competitive forces of the three leading agricultural commodities traded. The data used are primary and secondary data both quantitatively and qualitatively. The primary data obtained from deep interview by purposive sampling, Focus Group Discussion (FGD) method by online and offline communication either, also experts acquisition. The secondary data obtained from UN Comtrade, FAOSTAT, IMF, World Bank, Ministry of Commerce, Ministry of Agriculture and other relevant agencies. Descriptive data were analyzed using the SWOT Matrix method, the SOR (Strategic Orientation) Matrix method, Internal Factor Analysis (IFAS), External Factor Analysis (EFAS), Strategic Position and Action Evaluation (SPACE), and the Porter’s Five Competitive Forces Matrix. The result of this study those were most commodities while in Turkey in case it is needed by Indonesia based on the top three are: Wheat, Maize, and Cotton Lint. Most commodities in Indonesia in this case required by the Turkish based on the top three commodities: Palm Oil, Dry Natural Rubber, and Banana. Based on diagraming by the internal-external factor matrix, it is known that the condition of trade in agricultural commodities between Turkey and Indonesia were same condition on the Divest (X = 0.67; Y = 1.42) and (X = 1.31; Y = 0.57). Therefore, the main recommendations suggested by using the SOR analysis as conclusions of the study were attack strategy for Turkey and defence strategy then, attack before national agroindustrial ability has been better.
Keywords: Agricultural Commodities, Competitive Strategy, and International Trading.
v
ACKNOWLEDGMENTS
My journey through graduate student in Turkey has been a long and bumpy road. Thank you to those people who gave their interest, time and effort to make this study and this degree possible.
I dedicate my Thesis firstly to My lovely father and grand mother who past away during I studied in Turkey, Dr. Ir. Basuki and Hj. Marnis Jambak. Esepecially to my country Indonesia, hopefully this thesis could be give advantage to make relationship with Turkey stronger than before.
Thank you very much to Turkey Government who gave my opportunity, to continue my study in Selcuk University as a First Indonesian who studied Agricultural Economic in Turkey.
I give my appreciation to Head of Graduate School of Natural and Applied Science (Fen Bilimler Enstitusu) Prof. Dr. Aşır GENÇ who accepted my idea and have applicated to received Thesis or Disertation from Foreign Student who Studied in Selcuk University in English Language.
My sincere appreciation goes to my advisor, Prof. Dr. Cennet OĞUZ, for her guidance, support, and constant supervision throughout my graduate career. It is because of her persistence and belief in me that I have completed this research. Prof. Dr. Cennet OĞUZ was always available for feedback, encouragement, and advice when I needed it most. Her positive attitude made this a tolerable experience and has better prepared me for future endeavors.
In addition I am extremely grateful to the faculty and staff of the Department of Agricultural Economics Department Selcuk University, Prof. Dr. Kenan PEKER, Assoc. Prof. Dr. Yusuf ÇELIK, Assoc. Prof. Dr. Zeki BAYRAMOĞLU, Assit. Prof.Dr. Mithat DIREK, Dr. Hasan ARISOY, Dr. Zuhal KARAKAYACI, Dr. Arzu KAN, Research Assist. Aysun YENER, and Research Assist.Gurhan OZAYDIN. The research, teaching, and extension opportunities offered to me as a graduate assistant were invaluable and helped me to become a better person, researcher, and scholar.
vi
Thank you very much to Prof. Dr. Masyhuri as Professor in Department of Agricultural Economics Gadjah Mada University who give me some advices during I make research in Indonesia.
Thank you very much to all Reviewers : Prof. Dr. Cennet OĞUZ, Prof. Dr. Kenan PEKER, and Assoc. Prof. Dr. Seyit ALI KAYIS who give good advice to me during Thesis Defense.
Thank you very much to Indonesian Amabassador in Ankara (Excelency Mrs. Nahari Agustini) and Turkey Ambassador in Jakarta (Excelency Mr. Zakarya AKÇAM) who helped me during I studied in Turkey.
Thank you very much to Selcuk University Rector (Prof. Dr. Hakkı GÖKBEL) and Gadjah Mada University Rector (Prof. Dr. Paratikno) who trust me become mediator to make partnership between Selcuk University and Gadjah Mada University becomes true. Hopefully at 2015 this partnership in Mevlana Exchange Program could be begin.
Additional thanks must be also be extended to Prof. Dr. Musa ÖZCAN as Vice Rector of Selcuk University for his qualitative inspiration and professional support.
The completion of this research and degree has been directly influenced by my exceptional friends especially Mr. Adhita Sriprabakusuma and Mr. Qadaruddin Fajri Adi who support and help me during research in Indonesia.
Thank you very much to Mr. Hanif Salim as Commercial Counsellor in Indonesia Embassy Ankara and Mr. Okan ÖZTURK as Commercial Counsellor in Turkey Embassy Jakarta, Mr.George Iwan Marantika as Vice Chairman Permanent Committee Bilateral Cooperation in Indonesia Chamber of Commerce and Industry, Mr. Drg. Eddy Purjanto as Vice President in Special Province of Yogyakarta Chamber of Commerce and Industry to shared idea and knowledge related trade relation between Indonesia and Turkey for completed my thesis.
I have made many memories in Ankara, Izmir and Konya and beyond celebrating the good and the bad days. I will remember all the lunches, conferences, class trips, and parties that we experienced together throughout the
vii
country. Special thanks goes to Indonesian Students Association in Turkey especially in Konya Province that I have been privileged to know in the last two years (Ahmad Faiz, Labib, Azam, Yasmin, Ruru, Uma, Gusti, Dian, Helmy, Mulki, Hari Pebrianto, Yasin, Agung, Asrul, and etc). These individuals are not only my friends, but have truly become my extended family.
Finally, thanks to my mother, Ermaini Basuki, my sisters Tri Handayani Basuki , dr. Reny Setyowati Basuki and Dian Prasetyani Basuki and my brother in-laws, dr. Adiguno Suryo Wicaksono, my nephew Syafira Surya Paramesti. Their support and encouragement has always been greatly appreciated. I hope someday to repay all the special people in my life that have touched me in so many ways. Thank you very much.
Sincerely Yours,
viii TABLE OF CONTENTS Page Özet ….……… iii Abstract ... iv Acknowledgments…………..………... v
Table of Contents……….. viii
List of Table ... xii
List of Figure... xiii
List of Acronyms and Abbreviations……….. xiv
1. INTRODUCTION ... 1
1. 1. Background of the Study ... 1
1. 2. Significance of the Study ... 4
1. 3. The Aims of the Study ... 4
2. AGRICULTURAL STRUCTURE IN TURKEY AND INDONESIA... 5
2. 1. Turkey’s Agricultural Structure ... 5
2. 2. Indonesia’s Agricultural Structure ... 9
3. MATERIAL AND METHOD ... 16
3. 1. Material………... 16
3. 2. Method………... 16
3. 2. 1. Data Processing Method……... 16
3. 2. 2. SWOT Analysis ... 17
3. 2. 3. Strategic Orientation (SOR) Analysis ... 19
3. 2. 4. Internal Factor Analysis (IFAS) ... 23
3. 2. 5. External Factor Analysis (EFAS) ... 24
3. 2. 6. Diagraming SWOT to Strategic Position and Action Evaluation (SPACE) ... 25
ix
3. 2. 7. Porter’s 5 Competitive Industry Forces…... 30
4. LITERATURE………..……… 32
5. TRADE OPPORTUNITY FROM TURKEY TO INDONESIA IN AGRICULTURAL COMMODITIES………37
5. 1. Wheat………..……….……….. 37
5. 2. Maize …..………..………... 42
5. 3. Cotton Lint ……… 46
6. TRADE OPPORTUNITY FROM INDONESIA TO TURKEY IN AGRICULTURAL COMMODITIES... 52
6. 1. Palm Oil ………..………... 52
6. 2. Natural Rubber ……… 60
6. 3. Banana... 65
7. ANALYSIS OF THE RESEARCH……... 70
7. 1. Analysis Trading Opportunity of Agricultural Commodities from Indonesia to Turkey………... 70
7. 1. 1. SWOT Matrix Agricultural Commodity Trading from Indonesia to Turkey ... 70
7. 1. 2. Internal Factor Analysis (IFAS) from Indonesia to Turkey ... 71
7. 1. 3. External Factor Analysis (EFAS) from Indonesia to Turkey.... 71
7. 1. 4. Matrix Internal-External from Indonesia to Turkey ... 72
7. 1. 5. Grand Strategy Matrix from Indonesia to Turkey ... 72
7. 1. 6. Strategic Orientation Matrix from Indonesia to Turkey ... 73
7. 1. 7. Porter’s 5 Competitive Industry Forces for Crude Palm Oil Commodity... 74
7. 1. 8. Porter’s 5 Competitive Industry Forces for Natural Rubber Commodity ... 75
x
7. 1. 9. Porter’s 5 Competitive Industry Forces for Banana
Commodity ... 76
7. 2. Analysis Trading Opportunity of Agricultural Commodities from Turkey to Indonesia ………... 77
7. 2. 1. SWOT Matrix of Agricultural Commodity Trading from Turkey to Indonesia ... 77
7. 2. 2. Internal Factor Analysis (IFAS) from Turkey to Indonesia ... 78
7. 2. 3. External Factor Analysis (EFAS) from Turkey to Indonesia ... 78
7. 2. 4. Internal-External Matrix from Turkey to Indonesia ... 79
7. 2. 5. Grand Strategy Matrix from Turkey to Indonesia ... 79
7. 2. 6. Strategic Orientation Matrix from Turkey to Indonesia ... 80
7. 2. 7. Porter’s 5 Competitive Industry Forces for Wheat Commodity… 81 7. 2. 8. Porter’s 5 Competitive Industry Forces for Maize Commodity…. 82 7. 2. 9. Porter’s 5 Competitive Industry Forces for Cotton Lint Commodity ... 83
8. DISCUSSION ... 84
8. 1. Analysis for Trading on Agricultural Commodities from Turkey to Indonesia………... 84
8. 2. Analysis for Trading on Agricultural Commodities from Indonesia to Turkey ………... 90
9. CONCLUSION AND OPINION... 97
9. 1. Conclusion ... 97
xi
REFERENCES…….. …... 100 APPENDIX ... 107 BIOGRAPHY... 120
xii LIST OF TABLE
No Table Name of Table Page
Table 1. Total Production Three Primary Commodities in Turkey (2008-2011)...7
Table 2. Turkey’s Agricultural Products and Finished Products Foreign Trade (Million Dollars)... 8
Table 3. Basic Social Indicators of Indonesia... 9
Table 4. Main Economic Indicators of Indonesia... 12
Table 5. Total Production Three Primary Commodities in Indonesia (2008-2011)...………..12
Table 6. Top Import Agricultural Product in Indonesia (2008-2011)...13
Table 7. Top Export Agricultural Product in Indonesia (2008-2011)...14
Tabel 8. SWOT Matrix... 18
Tabel 9. SOR Intepretation... 23
Table 10. Turkey wheat imports Marketing Year (2012-2013)... 37
Table 11. Flour Exports, Top Ten Countries in Terms of Value (Ton/$)... 39
Table 12. Shares of 5 Major Exporters in Global Trade in Flour (percent)... 41
Table 13. World Country Production for Natural Rubber (2011)...62
xiii LIST OF FIGURE
No Figure. Name of Figure Page
Figure 1. Turkey Geographical Map ... 5
Figure 2. Indonesia Geographical Map ... 11
Figure 3. Strategy Orientation Process ... 19
Figure 4. SOR-Matrix Example ... 21
Figure 5. SPACE Matrix ... 25
Figure 6. Rangkuti’s Internal-External Matrix ... 28
Figure 7. Porter’s Five Competitive Forces ... 31
Figure 8. Turkey's Wheat Flour Exports in (1995-2010)...38
Figure 9. Turkish Flour Exports to Southeast Asia in (2012)...40
Figure 10. Import Cotton Priode (2009-2013)...48
Figure 11. Export Cotton lint from Turkey (2008-2013) ... 49
Figure 12. Palm Oil Picture ... 55
Figure 13. Palm Oil Harvest Time ... 56
Figure 14. Oil Palm Cultivation in 43 Oil Palm Producing Countries in (2006)..57
Figure 15. Indonesia Primary Palm Production Areas ... 60
Figure 16. Top Production Natural Rubber (2011)... 62
Figure 17. The number of Business Communities in Each Region Rubber Commodities ... 63
Figure 18. Potential Region Rubber Processing Industry ... 64
Figure 19. World Top Production Banana (2011)... 67
xiv
LIST OF ACRONYMS AND ABBREVIATIONS
ASEAN = Association of South East Asian Nations AEC = Asian Economic Community
BRIC = Brazilia, Rusia, Indonesia, China BCI = Better Cotton Initiative
CTEP = Comprehensive an assessment Trade and Economic Partnership CPO = Crude Palm Oil
CKO = Crude Kernel Oil
CME = Chicago Mercantile Exchange
D-8 Country = Organization of Eight Developing Countries predominantly Muslim
EU = European Union
EFAS = External Factor Analysis FAO = Food Agriculture Organisation FGD = Focus Group Discussion FDI = Foreign Direct Investment
FAOSTAT = Food Agriculture Organisation Statistic
G-20 Country = The Group of Twenty (G20) is the premier forum for its members’ international economic cooperation and decision-making. Its membership comprises 19 countries plus the European Union.
GDP = Gross domestic product GE = Genetically Engineered
ha = A symbol from hectare. Is a unit of area equal to 10,000 square meters. Usually used to measure land.
xv IMF = International Monetary Fund ISE = Istanbul Stock Exchange IGE = Istanbul Gold Exchange IFAS = Internal Factor Analysis
IGEME = Ihracati Geliştirme Etüd Merkezi
ISPAT = Investment Support and Promotion Agency of Turkey JCM = Joint Commission Meeting
LCA = Life Cycle Assessment MY = Marketing Year
MINT = Mexico, Indoneia, Nigeria and Turkey
MINFAL = Turkey’s Ministry of Food, Agriculture and Livestock MoU = Memorandum of Understanding
NR = Natural Rubber
OIC = Organization of Islamic Conference
OECD = Organisation for Economic Co-operation and Development PPI = Producer Price Indices
Rp = Indonesia money symbol. The currency abbreviation for the Rupiah (Rp) SPACE = Strategic Position and Action Evaluation
SWOT = Strength, Weakness, Opportunity, Threat SOR = strategic orientation
SO Strategy = Strength-Opportunity ST Strategy = Strenght-Threat
SWOT-AHP = strength, weakness, opportunity, threat, and analysis hierarchy process
xvi
TL = Turkey money symbol. The currency abbreviation for the Turkish Lira / Türk Lirasi (TL),
TRY = Turkey money symbol. The currency abbreviation for the Turkish new lira / Türk Yeni (TRY)
TurkDex = Turkish Derivatives Exchange
TÜİK = Türkiye İstatistik Kurumu (Turkey Statistical Institute / TURKSTAT) USD = America money symbol. The currency abbreviation for the United State Dolar (USD)
USAID = United States Agency for International Development (USAID)
UN = United Nations
UN Comtrade = The United Nations Commodity Trade Statistics Database U.S = United State (America)
WO Strategy = Weakness-Opportunity WT Strategy = Weakness-Threat
1 1. INTRODUCTION
1. 1 Background of the Study
In the area of free trade, the distance is not considered as a factor barrier the expansion of the market. All countries can be considered as an important market for a country’s exporters. Turkey at the western end of Asia and Indonesia on the belly of the redefined East Asia has in recent time accomplished remarkable achievements. Both recovered from the global financial crisis of 2008-2009 faster than many other economies and are currently enjoying a promising acceleration of growth. Indonesia is a country with a strong influence in Southeast Asia while Turkey is a gateway to Europe. Turkey be viewed as a gateway of trade and investment because of its proximity to major markets such as Europe, the Middle East and the Caucasus. Besides the potential market with a population of over 70 million people, Turkey also has a very good trading system.
Diplomatic relations between Indonesia and Turkey has been officially opened since 1950. Indonesia opened its Embassy in Ankara in 1958. In addition to the equation mentioned earlier, Indonesia and Turkey have joined together as members of the Organization of Islamic Conference (OIC) and a member of the Organization of Eight Developing Countries predominantly Muslim (D8). Both countries also have a foreign policy vision that was similar. Turkey's foreign policy was based on the philosophical Teachings of Mustafa Kemal Ataturk that was Peace at Home, Peace in the World (YURTTA BARIŞ, DÜNYADA BARIŞ). Meanwhile, Indonesia’s foreign policy was also based on a vision that participates in the establishment of a world order based on peace and social justice.
In bilateral trade relations, Indonesia and Turkey have been doing seven times the Joint Commission Meeting (JCM) since 1985. A series of meetings indicated the strength of the relationship between the two countries to strengthen and develop economic and trade cooperation on the basis of mutual benefit. According to Foreign Ministry of Indonesia (2008).
2
After the Memorandum of Understanding (MoU) related to agricultural sector between Indonesia and Turkey on 20 January 2008, in 7th JCM held on 18th September 2008 in Ankara, the two countries agreed on the establishment of the Comprehensive an assessment Trade and Economic Partnership (CTEP), which leads to a form of free trade agreements. In addition, the two countries have signed several bilateral agreements as cooperation, among others Economic and Technical Cooperation Agreement, Double Taxation Avoidance Agreement, the Promotion and Protection Agreement Joint Investment and Information Exchange MoU between Bank Indonesia and the Banking Regulation and Supervision Agency of Turkey. According to Ministry of the Republic of Indonesia secretariat of state government office (2012), between Government of Republic of Indonesia and dan Government of Republic of Turkey agreed to increased cooperation in Industrial sector and technology development in an effort to accelerate the achievement of trade between the two countries amounted to U.S. $5 billion in the next five years. The agreement was reached on October 5, 2011 in Istanbul.
On 20 January 2008 had been signed Memorandum of Understanding (MoU) between The Government of The Republic of Indonesia and The Government of The Republic of Turkey on Agricultural Sector for a period of 5 (five) years (2008-2013). This Memorandum of Understanding (MoU) Parties shall carry out the cooperation between them in the following areas:
1. Plant production and plant protection; 2. Animal husbandry and animal health; 3. Food industry;
4. Research, rural development, irrigation and extension services;
5. Promotion of joint ventures in the field of agriculture between the private sectors of each country;
6. Other related areas that are of interest and mutually agreed upon by the Contracting Parties.
3
The Memorandum of Understanding (MoU) Parties agree to cooperate in the following forms:
1. Exchange of information, visit, experts, research results, study and training;
2. Organization of seminars, symposia, exhibitions and conferences; 3. Any other technical form of cooperation as mutually agreed upon by
the Contracting Parties.
(Anonymous, 2013)
Agriculture is a central theme on the development agenda: it is a key to triggering growth, reducing poverty, ensuring food security and meeting environmental goals (World Bank, 2008). Indonesia is currently the fourth-largest country in the world with a total population around of 250 million and the third largest agricultural economy in Asia after India and China (in terms of total arable land both used and available for use). The agricultural sector is one of the most important economic sectors in the country, contributing significantly to output and employment. If we see this condition, has the potential cooperation in agriculture between Indonesia and Turkey, then it is very promising.
Nevertheless, bilateral relations have improved with a fast pace since 2004. Besides bilateral cooperation, Turkey and Indonesia continue to work together within the framework of several international and regional organizations as members, such as the United Nations (UN) and its specialized institutions, Organization of the Islamic Cooperation (OIC), D-8 and G-20 (Republic of Turkey Ministry of Foreign Afairs, 2013).
4
Based on that condition, this research was conducted and wants to give information about Agricultural Sectors. Especially this thesis have special purpose for giving information to Indonesia and Turkey about trade opportunity by comparing the results of the production of most commodities and most import needs in both countries, we can determine which commodities have the potential trade. Most commodities in Indonesia in this case required by the Turkish based on the top three: Palm Oil, Dry Natural Rubber, and Banana. Most commodities while in Turkey in case it is needed by Indonesia based on the top three are: Wheat, Maize, and Cotton Lint. To support and optimize it then drafted this thesis aimed for giving information to Indonesia and Turkey about trade opportunity in Agricultural Economics sectors.
1. 2. Significance of the Study
This study is very important because it can provide strategic advice to the government through a comprehensive review of Turkey and the Government of Indonesia regarding the steps that should be done so that an increase in harmonious cooperation between the two countries in the economic field in particular trade in the agricultural commodities.
1. 3. The Aims of the Study The aims of this study are:
1. Analyze the strengths, weaknesses, opportunities, and threats of trade relations in macro-scale of the agricultural commodities between Indonesia and Turkey.
2. Analyze the industry attractiveness, trade potential, also strategic orientation of the three leading agricultural commodities traded between Indonesia and Turkey.
3. Analyze the industry competitive forces of the three leading agricultural commodities traded between Indonesia and Turkey.
5
2. AGRICULTURAL STRUCTURE IN TURKEY AND INDONESIA 1. 1. Turkey’s Agricultural Structure
Based on European Commission (2009), Republic of Turkey was established on 29th October 1923. Turkey has a total population of 71.5 million people (2009) and a continental land area of 783.562 km². The country has been experiencing solid economic growth in recent years. The EU is by far Turkey's main economic partner with 41.7 percent of the total trade and around 76 percent of foreign direct investment in 2010. Agriculture is still a very important sector of the economy. In 2010 it represented 10.1 percent of GDP and 24.7 percent of employment. Turkey is a major world producer and exporter in some sectors (e.g. fruit and vegetables). Social and economic development of rural areas is a major challenge for coming years.
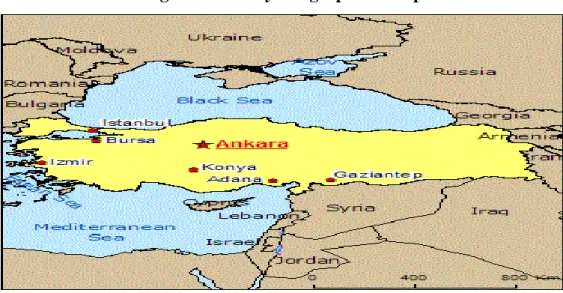
Agriculture is of key importance to Turkey, both in social and economic terms. About half of Turkey’s total land area is devoted to agriculture, which is slightly above the EU-27 average (41 percent). Turkish accession would therefore add about 39 million hectares to the EU’s agricultural area. This would represent 22 percent of the EU-27 agricultural area. In 2010 roughly 25.4 percent of the workforce was employed in agriculture (European Commission, 2009). From the Figure 1, shown that Turkey has a good geographical position in this world.
Figure 1. Turkey Geographical Map
6
Turkey’s agricultural imports and exports in 2009, excluding processed food, amounted to USD 4.6 billion (3.3 percent of the total imports) and USD 4.5 billion (4.4 percent of the total exports). Turkey is a major producer of cereals (Wheat, barley and Maize); other crops (Sugar beet, cotton, Potatoes and Tobacco); fruit and vegetables (especially apples, citrus, grapes, figs, hazelnuts, olives, and Tea); and sheep and goat meat.
Turkey’s agricultural exports are not highly diversified; fruits, nuts and vegetables are the major export categories (approximately 60 percent of total agricultural exports). Tobacco, cereals, and Sugar comprise a further 20 percent. Despite the overall trade deficit of Turkey, the agricultural trade balance is significantly positive, providing some relief to external accounts (The Ministry of Food, Agriculture and Animal, 2010). Generally, fruit and vegetables are Turkey’s most important agricultural exports with 40 percent and 42 percent share in total agricultural exports in 2008 and 2009, respectively (ISPAT, 2010).
The farm structure in Turkey shows similarities with some of the new member states. According to the 2001 census, there are approximately 3 million agricultural holdings in Turkey (compared to approximately 15 million in the EU-27), most of which are family farms employing family labor. Holdings are smaller than EU average (6 ha, compared to an EU-25 average of 13 ha). Subsistence and semi-subsistence farming is an important characteristic of Turkish agriculture. These farms are typically characterized by productivity of the factors of production being low and only a small fraction of production being marketed (European Commission, 2009). The agricultural sector represents 8.3 percent of the Gross Domestic Production (in 2009) (Republic of Turkey Prime Ministry, Investment Support and Promotion Agency of Turkey, Turkish Agriculture Industry Report, 2010) with employment in agriculture is 24 percent of total employment (5,2 million people in 2010) (The Heinrich Böll Foundation, 2007).
Although, agriculture has been declining in importance compared with the industrial and service sectors, it nonetheless continues to play a fundamental role in Turkish society, employing approximately a quarter of the workforce and generating most of the income and employment in rural areas (Vural and Karasu,
7
2007). Agriculture is one of the leading sectors in the Turkish economy. The share of agricultural production in Turkey’s GDP was 8.3 percent in 2009, decreased from 10.1 percent in 2000.
During this period, Turkey experienced a continuation in its economic transformation from agriculture towards industry and the services sector. Despite the decreasing share in GDP, the level of agricultural production in Turkey has been rising since 2000. Agricultural production in 2008 and 2009 amounted to TRY 73 billion and TRY 79 billion, respectively.1 The sector employed 5.2 million people as of March 2010, which constitutes 24 percent of the total employment in Turkey (ISPAT, 2010). Based on FAOSTAT (2013), total production of Cotton Lint, Maize, and Wheat commodities in Turkey in 2008-2011 are given in Table 1.
Table 1. Total Production Three Primary Commodities in Turkey 2008-2011.
Commodities Year (tones)
2008 2009 2010 2011
Cotton Lint 673,000 638,250 816,705 954,600 Maize 4,274,000 4,250,000 4,310,000 4,200,000 Wheat 17,782,000 20,600,000 19,674,000 21,800,000
Related to Turkish Agriculture Sector (2011), while the agricultural sector generates production of lower rates compared to the number of the employees employed in this sector, its share in the Turkey’s foreign trade is at lower rates as well. According to the classification of operations of the foreign trade, whereas the share of the agricultural export in the total production is 4.4-4.5 billion dollars as of 2009, the share of importation is 3.3 percent with 4.6 billion dollars. While the rate of the agricultural export to meet the import is fluctuated agricultural export and import interact in a balanced manner in 2011. In the Table 2 by the Turkish Statistics Institute, shown Turkey’s Agricultural Products and Finished Products Foreign Trade (Million Dollars).
8
Table 2. Turkey’s Agricultural Products and Finished Products Foreign Trade (Million Dollars).
2000 2001 2002 2003 2004 2005 2006 2007 2008 2009
Total export 27,775 31,334 36,059 47,253 63,167 73,476 85,535 107,272 132,027 102,129
Total Agriculture and Food Industry Export 3,520 3,967 3,642 4,688 5,840 7,653 7,853 8,917 10,616 10,486 Livestock and Food Substances 2,891 3,316 3,118 3,944 5,044 6,512 6,595 7,822 9,155 9,126
Livestock 2 44 31 8 7 5 9 7 13 24
Meat and Meat Products 13 19 17 23 27 41 36 54 103 174
Milk, Milk Products and Eggs 22 42 35 49 54 81 107 179 255 268
Fish and Other Seafod 89 73 121 152 212 243 259 303 408 339
Grains, Grain Products 406 327 299 409 520 892 876 1,037 1,385 1,482
Fruits and Vegetables 1,817 2,142 2,062 2,568 3,406 4,374 4,261 4,902 5,308 5,353
Sugar, Sugar Products and Honey 239 343 183 226 237 211 283 304 352 301
Coffee, Tea, Cacao, Spices and Products 140 149 172 243 297 309 345 463 500 472
Feed for animals 10 25 13 14 12 18 10 12 68 75
Various eatable products 153 152 185 251 274 338 409 561 763 638
Beverage and Tobaco 529 471 426 489 591 736 820 805 891 933
Beverages 37 36 41 70 113 146 135 161 186 176
Tobacco and Tobacco Products 491 435 385 419 478 590 685 644 705 757
Animal, Vegetable fats and oils waxes 100 180 98 255 205 405 438 290 570 427
Animal Liquid oils and Solid fats 2 - 3 5 1 - - - 26 3
Prepared vegetable oil and solid Fat 72 165 76 226 175 359 308 206 269 240
Processed liquid oils, solid , waxes 26 15 19 24 30 46 130 84 274 184
Total Import 54,503 41,399 51,554 69,340 97,540 116,774 139,576 170,063 201,964 140,926
Total Agriculture and Food Industry Import 1,899 1,353 1,689 2,366 2,620 2,660 2,959 4,266 7,182 5,192 Livestock and Food Substances 1,159 736,000 1,056 1,604 1,818 1,616 1,730 3,084 5,024 3,591
Livestock 33 23 16 12 10 14 16 24 41 34
Meat and Meat Products 2 1 - 1 1 1 1 1 4 2
Milk, Milk Products and Eggs 37 24 39 53 71 78 85 119 133 120
Fish and Seafood 37 12 19 33 55 69 85 97 119 108
Grains, Grain Products 408 193 392 722 558 226 212 1,024 2,208 1,285
Fruits and Vegetables 193 118 142 132 162 284 348 456 860 673
Sugar, Sugar Products and Honey 6 12 20 36 39 46 40 57 92 57
Coffee, Tea, Cacao, Spices and Products 124 122 156 255 291 275 297 374 391 389
Food subtances for Animals 207 136 144 200 401 341 317 550 773 556
Various eatable products 102 95 127 163 231 280 331 381 403 367
Drinks and Tobacco 365 296 218 250 270 299 296 353 456 479
Drinks 15 13 10 15 31 23 40 51 65 79
Tobacco and Tobacco Products 351 283 208 235 239 276 256 302 392 400
Animal, Vegetable liquid oils and solid fat; Wax 375 321 415 512 532 745 933 829 1,702 1,122
Animal Liquid oil and Solid fat 51 33 49 64 61 73 84 110 154 106
Prepared vegetable liquid oil and solid Fat 292 269 337 409 425 626 792 641 1,446 930
Processed liquid, solid Fat, waxes 33 19 29 39 46 46 57 78 102 87
9 2. 2. Indonesia’s Agricultural Structure
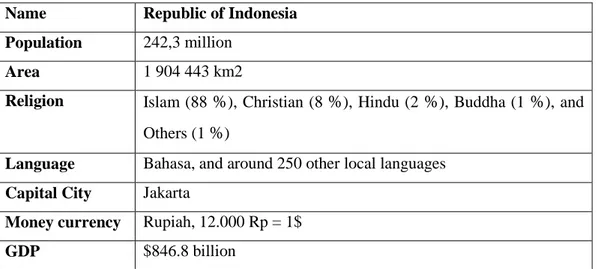
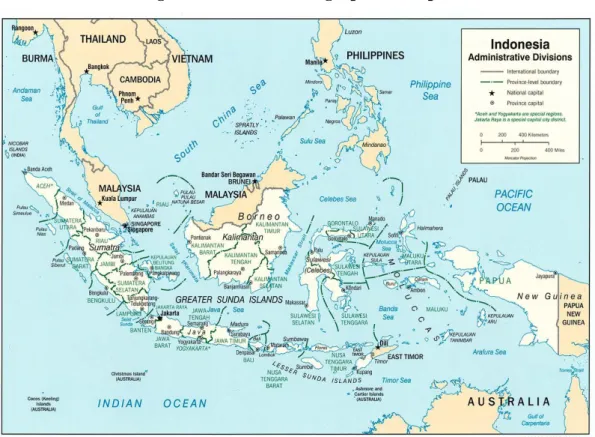
Today, Agriculture Indonesia’s economy is accepted enough and one of main sectors to play an important role. Agriculture (including fisheries and forestry), the predominant activity in terms of employment and production continues to be traditional. There are a lot of mineral resources in the country and evaluated quick enough in the last 30 years, and thus contribute significantly to mining sector, the balance of payments. Starting in the mid 1980s, rapid expansion of the agriculture sector in the manufacturing industry left behind for the first time in 1991 and 46.9 percent of GDP in 2010 was accounted for 38.3 percent of GDP in 2010 while the services sector share of agricultural sector was 14.8 percent. The effect of increasing the share of services sector of the tourism sector has developed over time. The national economy has been operating in many public enterprise. The government of Indonesia monopolize on the operation of many natural resources. From Table 3 and figure 2, given perspective about Basic Social Indicators of Indonesia and geographic condition in Indonesia.
Table 3. Basic Social Indicators of Indonesia.
Name Republic of Indonesia
Population 242,3 million
Area 1 904 443 km2
Religion Islam (88 %), Christian (8 %), Hindu (2 %), Buddha (1 %), and
Others (1 %)
Language Bahasa, and around 250 other local languages
Capital City Jakarta
Money currency Rupiah, 12.000 Rp = 1$
GDP $846.8 billion
Source: Badan Pusat Statistik (Center of Statistics Agency), 2013.
Indonesia has a lot of commodity and get the good reputation from the world. Because of this reputation, a lot of investor in this century interesting to invest their capital in Indonesia. With the GDP expected to reach US$ 1 trillion in 2012, Indonesia is the largest economy in Southeast Asia. Much less affected by
10
the global financial crisis compared to its neighboring countries, Indonesia’s economy grew by 6.3 percent in the first semester of 2012, making it the fastest growing G20 economy after China. Indonesia grew by 6.5 percent in 2011 and is expected to grow by 6.3 percent this year, providing a case for the country’s inclusion in the so-called BRIC (Brazilia, Rusia, Indonesia, China) economies (OECD, 2013).
Future economic expansion is expected to include more inclusive growth as nominal per-capita GDP is expected to quadruple by 2020, according to a Standard Chartered report. A large part of our economic success is a result of prudent fiscal stewardship that focused on reducing the debt burden. Indonesia’s debt to GDP ratio has sTeadily declined from 83 percent in 2001 to less than 25 percent by the end of 2011, the lowest among ASEAN countries, aside from Singapore which has no government debt. As a result, by early this year, Moody’s and Fitch had uplifted Indonesia’s credit rating to investment grade status. The rating reflects Indonesia’s resilience to the global financial crisis, improving government and external credit-metrics, and an ability to manage domestic political challenges to the reform agenda. Economically strong, politically stable and reform minded, Indonesia is an emerging global powerhouse in Asia (Indonesia Coordinating Investment board, 2013).
11
Figure 2. Indonesia Geographical Map.
Source: www.lib.utexas.edu.
Agriculture, fisheries and forestry sectors are also included country's most important source of employment. Significant export revenue for 53 percent of the population and providing job opportunities for the agricultural sector plays an important role in Indonesia's national economic growth. The share of agriculture in the form of crop revenue payments to the employees whether they are for domestic consumption greatly. A large part of the crop is not covered by the records of the country’s economy. Industrialized, the share of agriculture in GDP declined in Indonesia. In the early 1970s the share of agriculture in GDP ratio of 40-50 percent, this value decreased to 14.8 percent in 1997. Felt in the agricultural sector in the national economy in 1999 due to the contraction ratio, this ratio increased to 19.5 percent again. As 14.1 percent in 2005, this ratio was decreased. This rate was 14.8 percent in 2010.
12
Table 4. Main Economic Indicators of Indonesia.
Category 2006 2007 2008 2009 2010
GDP (billion dollars) 364,6 432,2 510,2 539,4 706,7
GDP real growth ( percent) 5,5 6,3 6,0 4,5 6,1
Inflation ( percent) 6,6 5,8 11,1 2,8 5,1
Per Capita GDP (purchasing power parity) 3.314 3.583 3.835 4.000 4.222 Exports (fob) (U.S. $ billion) 103,5 118,0 139,6 119,4 154,6 Imports (fob) (U.S. $ billion) 73,9 85,3 116,0 85,5 -118,7 Current Account Balance ($ billion) 10,9 10,5 0,1 10,7 6,9 Foreign Exchange Reserves ($ billion) 42,6 56,9 51,6 66,1 95,0 Total External Debt (U.S. $ billion) 132,5 142,6 150,8 156,7 160,9 Average Exchange Rate (Rp / $ parity) 9.020 9.419 10.950 9.400 9.121
Source: Ihracati Geliştirme Etüd Merkezi (2009)
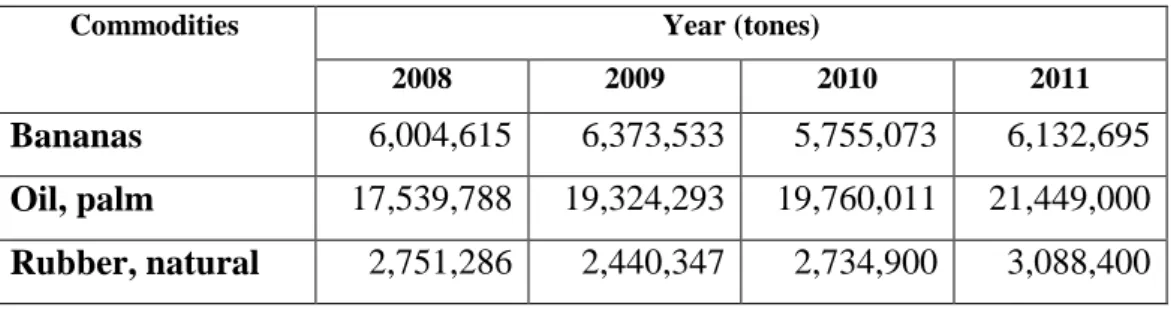
The major agricultural products grown are Rice, Corn, Sweet Potatoes, Soybeans, Peanuts, Natural Rubber, Coffee, Cocoa, Tea, Sugar, Tobacco, Pepper and Spices. Table 4 given data of main Economic Indicators of Indonesia. World’s the second largest Palm Oil producer is Indonesia, the fourth largest Coffee producer, is a leading source of rubber and Indian cane, and major oil producer and exporter of Spices (Anonymous, 2013). Based on FAOSTAT data (2013) on table 5 , total productions of three prior commodities in Indonesia between 2008 until 2011 are:
Table 5. Total Production Three Primary Commodities in Indonesia 2008-2011.
Commodities Year (tones)
2008 2009 2010 2011
Bananas 6,004,615 6,373,533 5,755,073 6,132,695 Oil, palm 17,539,788 19,324,293 19,760,011 21,449,000 Rubber, natural 2,751,286 2,440,347 2,734,900 3,088,400 Source: FAOSTAT (2013).
13
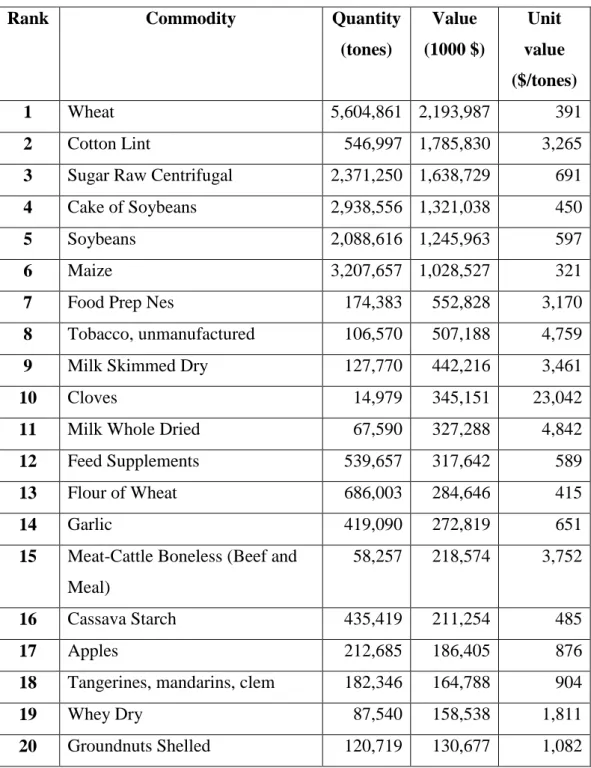
Table 6. Top Import Agricultural Product in Indonesia 2008-2011.
Rank Commodity Quantity
(tones) Value (1000 $) Unit value ($/tones) 1 Wheat 5,604,861 2,193,987 391 2 Cotton Lint 546,997 1,785,830 3,265
3 Sugar Raw Centrifugal 2,371,250 1,638,729 691
4 Cake of Soybeans 2,938,556 1,321,038 450
5 Soybeans 2,088,616 1,245,963 597
6 Maize 3,207,657 1,028,527 321
7 Food Prep Nes 174,383 552,828 3,170
8 Tobacco, unmanufactured 106,570 507,188 4,759
9 Milk Skimmed Dry 127,770 442,216 3,461
10 Cloves 14,979 345,151 23,042
11 Milk Whole Dried 67,590 327,288 4,842
12 Feed Supplements 539,657 317,642 589
13 Flour of Wheat 686,003 284,646 415
14 Garlic 419,090 272,819 651
15 Meat-Cattle Boneless (Beef and Meal)
58,257 218,574 3,752
16 Cassava Starch 435,419 211,254 485
17 Apples 212,685 186,405 876
18 Tangerines, mandarins, clem 182,346 164,788 904
19 Whey Dry 87,540 158,538 1,811
20 Groundnuts Shelled 120,719 130,677 1,082
14
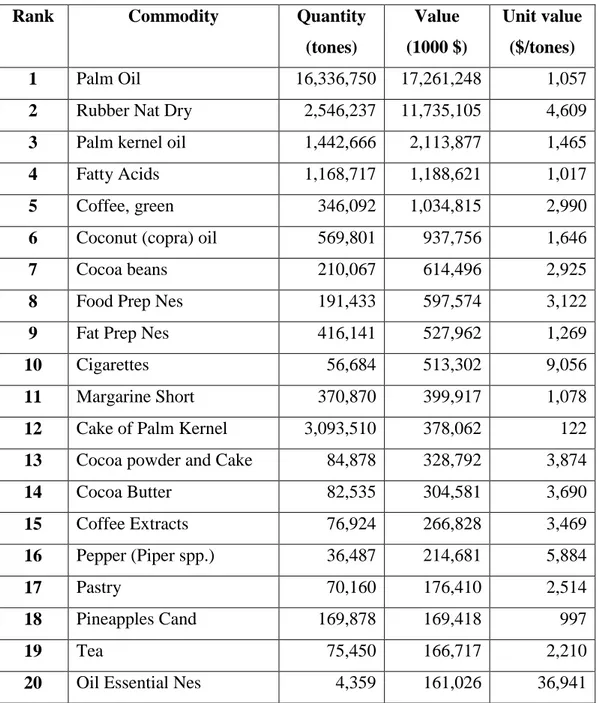
Table 7. Top Export Agricultural Product in Indonesia 2008-2011.
Rank Commodity Quantity
(tones) Value (1000 $) Unit value ($/tones) 1 Palm Oil 16,336,750 17,261,248 1,057
2 Rubber Nat Dry 2,546,237 11,735,105 4,609
3 Palm kernel oil 1,442,666 2,113,877 1,465
4 Fatty Acids 1,168,717 1,188,621 1,017
5 Coffee, green 346,092 1,034,815 2,990
6 Coconut (copra) oil 569,801 937,756 1,646
7 Cocoa beans 210,067 614,496 2,925
8 Food Prep Nes 191,433 597,574 3,122
9 Fat Prep Nes 416,141 527,962 1,269
10 Cigarettes 56,684 513,302 9,056
11 Margarine Short 370,870 399,917 1,078
12 Cake of Palm Kernel 3,093,510 378,062 122
13 Cocoa powder and Cake 84,878 328,792 3,874
14 Cocoa Butter 82,535 304,581 3,690 15 Coffee Extracts 76,924 266,828 3,469 16 Pepper (Piper spp.) 36,487 214,681 5,884 17 Pastry 70,160 176,410 2,514 18 Pineapples Cand 169,878 169,418 997 19 Tea 75,450 166,717 2,210
20 Oil Essential Nes 4,359 161,026 36,941
Source: FAOSTAT (2013).
In 2010, the rate of foreign investment in Agribusiness Sector reached U.S. $774 Million. In the third semester of the year 2011, the rate of investment of foreign investment declined to U.S. $307 Million. Table 6 and 7 shown FAO data related Top import and export agricultural product in Indonesia duruing 2008 until 2011. The number of companies that make investments also decreased. Business units of foreign investment that invest in the agribusiness sector in 2010 reached
15
185 units and in the third quarter of 2011 this number reached 95 living units. In 2010, approximately 97 percent of the investment value of foreign investment in this sector came from sub-sectors of food crops and plantation followed by fishery that contribute to the investment value of 2.3 percent and the livestock sector by 0.6 percent (Indonesia Investment Coordinating Board, 2011).
In world markets, Indonesia is the second largest country after Malaysia in trading palm and palm products. However, those products such as CPO (Crude Palm Oil) and CKO (Crude Kernel Oil) have low added value. However, Malaysia is the country's largest exporter for CPO (Crude Palm Oil) and CKO (Crude Kernel Oil) products that have been processed. The same thing is also happened in the commodity Cocoa. Indonesia is a major Cocoa producer country in Asia and has the potential to build for processing Cocoa industry thereby increasing job creation.
The investment value of Domestic Investment on agribusiness sector in Indonesia during the last five years peaked in 2010 amounted to USD 8.885 billion. However, in the third quarter of 2011, decreasing the value of this investment reached USD 3.612,8 billion. The number of business units of Domestic Investments that invest in the agribusiness sector reached 227 units. The proportion of sub-sector agribusiness investment 99 percent of the total domestic investment comes from the sub-sectors of food crops and plantations. On the other hand, the livestock sub-sector only gives the proportion of domestic investment by 0.4 percent of the total investment of Domestic Investment on agribusiness sector. While in the fisheries sector there has been no investment (Indonesia Investment Coordinating Board, 2011).
Rice is the basic food source in the country. Indonesia the world's third largest Rice producer in 1985 and 2004 led to self-sufficiency. In the intervening years, Indonesia has become one of the world's best Rice-importing countries. Java, Bali and Madura islands are the major Rice production centers. Industrialization and population density has led to the loss of arable land. Observed that reduction in Rice production in Indonesia since 1985.
16
Markets in the country every year, approximately 3.5 million tons (10 percent of demand), and that Indonesia has been importing Rice has become the most important importer of Rice. Between 1983-1993, Indonesia has lost a total of 1 million ha of arable Rice-plant. To reverse this trend in the management Riau, Jambi, South Sumatra, Bengkulu and West Kalimantan regions had an effort to make Rice for planting. The country of 54 million tons in 2005 shelled Rice (equivalent to 32.4 million tons of unshelled Rice) production was achieved, the need for 32 milion tons of brown Rice that has been exceeded (Anonymous, 2013).
3. MATERIAL AND METHOD 3. 1. Material
The data used are primary and secondary data both quantitatively and qualitatively. The primary data was taken from the interviews to the national agribusiness experts and practitioners. Quantitative secondary data consists of the data time series and cross section of the year 2008-2011 for trade data in two countries, Turkey and Indonesia. The secondary data obtained from UN Comtrade, FAOSTAT, IMF, World Bank, Ministry of Commerce, Ministry of Agriculture and other relevant agencies. The data used include data on total production, the volume of imports and exports, and international trade policy. The primary data obtained from deep interview by purposive sampling, Focus Group Discussion (FGD) method by online and offline communication either, also experts acquisition. While the qualitative data and other additional data that support the quantitative data obtained through the study of literature in the form of a thesis before, the internet and books related to the study, and respondent survey. This research started from June of 2013 until February of 2014.
3. 2. Method
3.2.1. Data Processing Method
In processing data were used both descriptive and quantitative methods. The studies determine which commodities have the potential trade. Most commodities in Indonesia in this case required by the Turkish based on the top
17
three of export quantity: Palm Oil, Dry Natural Rubber, and Banana. Most commodities while in Turkey in case it is needed by Indonesia based on the top three of export quantity: Wheat, Maize, and Cotton Lint. This data originally taken from FAOSTAT 2013.
Descriptive method was used to describe the capacity of supply and demand by knowing the volume of exports and imports of major agricultural commodities in the country of Turkey and Indonesia, examines the trade policy and global marketing strategy in the SWOT (Strength, Weakness, Opportunity, Threat) matrix method, the SOR (strategic orientation) matrix method, Internal Factor Analysis (IFAS), External Factor Analysis (EFAS), Strategic Position and Action Evaluation (SPACE), and the Porter’s Five Competitive Forces Matrix. Quantitative method was used to forecast the trend line of changes in demand and supply on the main commodity traded. The processing of data was performed via Microsoft Excel 2010 software and then proceeds to the stage of data interpretation.
3. 2. 2. SWOT Analysis
SWOT Analysis is a way to systematically identify the various factors to formulate corporate strategy. This analysis is based on the logic that maximizes the strength and opportunities, but at the same time can minimize the weaknesses and threats. Strategic decision-making process is always associated with the development of the mission, objectives, strategies and policies of the company. Thus strategic planner should analyze the company's strategic factors (strengths, weaknesses, opportunities, and threats) that exist today. It is called the analysis of the situation. The most popular models for the analysis of the situation were a SWOT Analysis (Rangkuti, 2005).
18 Tabel 8. SWOT Matrix.
External Internal STRENGTHS (S) WEAKNESSES (W)
OPPORTUNITIES (O)
STRATEGY SO STRATEGY WO
Creating strategies that use strengths to capitalize on
the opportunities
Creating strategies that minimize weaknesses to leverage on opportunities
THREATS (T) STRATEGY ST STRATEGY WT
Creating strategies that use strengths to overcome
threats
Creating strategies that minimize weaknesses to
avoid threats Source: Rangkuti (2005).
Based on table 8, results of SWOT analysis is made up of four alternative strategies that can be used as a material consideration by standard enterprise management (Rangkuti, 2005):
(1) SO Strategy (Strength-Opportunity). This strategy uses the company's internal strength to grab the opportunities that exist outside the company. So if the company has a weakness, the company should be able to overcome these weaknesses. whereas if the company is facing a threat, then the company should try to avoid it and try to concentrate on the opportunities. (2) WO Strategy (Weakness-Opportunity). This strategy aims to reduce the
company's internal weaknesses by using external opportunities. Sometimes companies face difficulties in taking advantage of opportunities because of internal weaknesses, therefore, depends on how the management company to use strategy and overcome its internal weaknesses.
(3) ST Strategy (Strenght-Threat). Through this strategy the company seeks to avoid or reduce the impact of external threats.
(4) WT Strategy (Weakness-Threat). This strategy is a tactic to survive (defensive) by reducing internal weaknesses and avoiding threats. A company that is faced with a number of internal weaknesses and external threats actually are in a dangerous position, the company has struggled to stay a float
19 3. 2.3 Strategic Orientation (SOR) Analysis
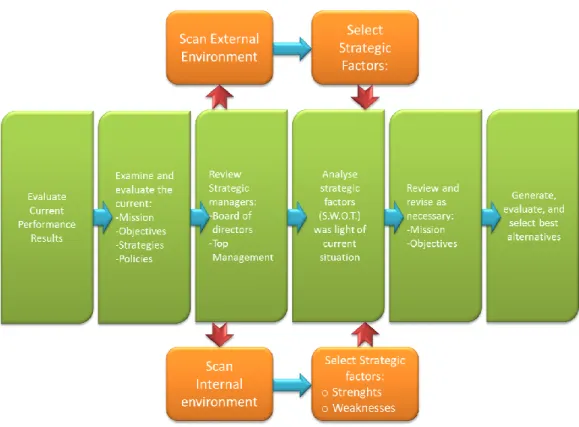
Strategy Orientation Model (SOR) or called formulation strategy was often referred to as strategic or long range planning. Regardless of the term used, the process is primarily analytical, not action oriented. The formulation process is concerned with developing a corporation’s mission, objectives, strategies and policies. In order to this, strategy makers must analyse the corporation’s strategic factors (key strengths, weaknesses, opportunities, and threats) in light of the current situation. With matrix shown in figure 3, known that step of strategy orientation process were:
Figure 3. Strategy Orientation Process.
From figure 3, shown before the Strategic Orientation starts, provide for each of the respondents the SWOT tables and the SOR matrix. To perform the analysis using the SOR method, made up of the follow steps (Vermeire and Gellycnk, 2009):
20 Step 1: Present the focus of the SOR
Tell about the aims of research and how the SOR-exercise helps to define the strategic goals that will lead to a successful. It is very important to explain the focus of the strategic orientation round. As it was discussed during the SWOT-analysis, the ability to keep the focus clear during the SOR determines the success of the analysis.
Step 2: Present SWOT
The SWOT-tables are input for the Strategic Orientation. Present the 2 S’s, W’s, O’s and T’s concluded upon after the interview round. Explain their meaning and motivate briefly. It can be expected that some of the respondents will disagree with the SWOT-table. Make clear to them that this is not a problem.
However, do not change the SWOT table at this stage. The discussion and voting in the next steps gives the participants the possibility to express their opinion and influence the strategy-building. The participants should now have a look at the SOR-matrix. Explain how they should read the matrix by showing some examples (adapt the model questions to your SWOT to make them more clear).
Step 3: Explain the voting system
The voting system score is attributed to the O’s and T’s, whereby it is considered to what extend they can help to face S’s and W’s. Thereby:
3 = very important 2 = important
1 = some importance 0 = not important / relevant
Further, a maximum number of 12 votes can be distributed per O and T. Note that this is a maximum, not a minimum: if the O or T are less important, less than 12 votes will be distributed. Consequently, a significant number of combinations can be left blank.
21 Step 4: Voting
Give the participants time to give their final votes. In contrast with the former step, the final votes are anonymous.
Step 5: Counting the votes
The individual SOR-matrix are aggregated to an overall matrix. After the first round, an assistant can collect the filled-in SOR-matRices and count them during the second SOR. After the second round, there is also some time for counting provided. Counting implies:
a. total scores per combination
b. total scores per row (S and T) and column (O and T) c. total scores per quadrant
Step 6: Reflection on the results
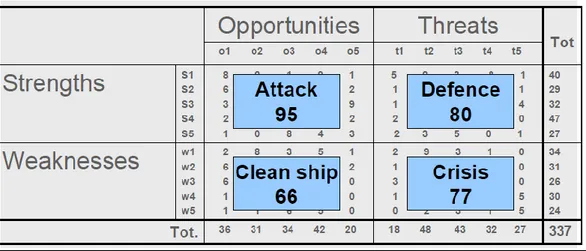
The results are presented to the participants and there is some time for reflection. In the model agenda, this time is very limited. It would be interesting to have a more profound discussion, however, there is the risk of overloading the agenda. For the example of SOR-Matrix, shown on the Figure 4.
Figure 4. SOR-Matrix Example.
22 Step 7: Intrepretation
In SOR Analysis process, we have to know how to do make interpretation based on our collected datas research. For the steps of make SOR Interpretation explained on Table. 9,
Tabel 9. SOR Intepretation.
The SOR-matrix contains a lot of information. After the session, it will be up to the regional partner to interpret it and to extract strategic objectives out of it. The partner can interpret the figures in different ways, however, following scores are crucial: Score
What does it tell ? What to do with it ?
Total scores per S (Strength), W (Weakness), O (Opportunity), T (Threat)
How important the different S’s, W’s, O’s, T’s are.
Strategy is aimed towards taking maximum benefit of external factors: therefore build strategy around the 2 or 3 most important O’s & T’s.
Score per combination How important the O or T is to deal with S or W.
Develop strategic objectives which deal with the combinations with the highest scores.
Total scores per quadrant What the general prospects are. High S-O: attack, the chances are good
High S-T: defence, we have the power to deal with the threats High W-O: clean ship or reorientation, work on the weaknesses
to take benefit of present opportunities
High W-T: crisis situation, the threats are serious and we don’t have the means to deal with them.
23 3.2.4. Internal Factor Analysis (IFAS)
IFAS analysis is used to analyze internal factors, which determine the strengths and weaknesses of the company. The results are used to manage opportunities in dealing with threats from the external environment. The company's strength can be used in a competitive weapon and weaknesses of the company must be corrected in order to face the changing environment. After the internal strategic factors of a company are identified, IFAS tables compiled to formulate internal strategic factors in the framework of the “Strengths and Weaknesses” company (Rangkuti, 2005).
Stages are: (1) Determine the strengths and weaknesses of the company in column 1, (2) Give the weight of each of these factors on a scale ranging from 1.0 (most important) to 0.0 (not important), based on the influence of these factors the strategic position of the company (all weight must not exceed the amount of the total score 1.00), (3) Calculate the rating (in column 3) for each factor to provide a scale ranging from 4 (outstanding) to 1 (poor) based on the influence of these factors on condition of the company (Rangkuti, 2005).
The variables (all variables are categorized as strengths) were given values ranging from +4 (very good) compared to the industry average or the main competitors. If variable negative is the opposite. For example, if a big company drawback compared to the industry average, its value is -4, whereas if the weakness of the company below the industry average, its value is -1, (4) multiply the weight in column 2 with the rating in column 3, to obtain the weighting factors in column 4. The result is a weighted score for each factor whose value varies from 4.0 (outstanding ) to 1.00 (poor), (5) Use the column 5 to give a comment or note why certain factors are sorted, and how the weighting is calculated, (6) Number of weighted scores (in column 4), to obtain a total weighted score for the company. This shows how the total value of a particular company reacts to internal strategic factors (Rangkuti, 2005).
24 3. 2.5. External Factor Analysis (EFAS)
Analysis of the external environment is the monitoring of an enterprise environment that identifies threats and opportunities that may affect the company and its strategy to achieve the company’s goals. External environment are factors beyond the company's control that may affect the choice of direction and action, organizational structure, and internal processes of the company (Rangkuti, 2005).
Given the close linkage between the enterprise and external environment factors, it is necessary to do an environmental analysis of the process to monitor the environment in determining the opportunities and threats to the existence of the enterprise. The following are ways of determining factors Internal Strategies (EFAS) (1) Prepare in column 1 (5 to 10 chances threats), (2) Give the weight of each factor in column 2, ranging from 1.0 (very important) up to 0.0 (not important) (Rangkuti, 2005).
These factors could potentially have an impact on strategic factors, (3) Calculate rating (column 3) for each factor to provide a scale ranging from 4 (outstanding) to 1 (poor) based on the influence of these factors on the condition of the company. Rating for scoring opportunities factor is positive (greater opportunities were rated +4, but if small chances were rated +1. Provision threat rating is the opposite. For example, if the value of the threat is very large, the rating is -4. Conversely, if the threat is small then the value of the rating is -1 (4) multiply the weight in column 2 with the rating in column 3 to obtain the weighting factors in column 4. The results represent a weighted score for each factor whose value varies from 4.0 (outstanding) to 1.0 (poor), (5) Use column 5 to give a comment or note why certain factors are selected and how the weighting score calculated, (6) Calculate the total weighting scores (in column 4) to obtain a total score weighting for the enterprise. The total value of these shows how companies react to external strategic factors (Rangkuti, 2005).
25
3. 2.6. Diagraming SWOT to Strategic Position and Action Evaluation (SPACE)
Diagraming SWOT Analysis conducted by Pearce and Robinson (2008) is divided into several strategies in four cells that comprise the aggressive strategy of the first cell, the second cell diversification strategy, the third cell strategies to improving, and the fourth cell yields defensive strategy. In this research, SWOT analysis was further developed by using SPACE analysis and Rangkuti’s Internal-External analysis.
According to David (2004) shown in the Figure 5 , SPACE Analysis Matrix presented by using a cartesian diagram consisting of four quadrants with the same size scale. The analysis can show clearly veldor lines are positive or negative, both for financial strength (Financial Strength), the power industry (Industry Strength), competitive advantage (Competitive Advantage) and the stability of the environment (Environmental Stability).
Figure 5. SPACE Matrix.
26 For the explanation is as follows:
Cell (1) Aggressive strategy. Is the most preferred strategy in which the company faced several environmental opportunities and a lot of forces that encourage the use of these opportunities? This strategy suggests a growth-oriented strategy to take advantage of this favorable situation. The company can use the strength and opportunity to avoid weaknesses and threats optimally. Alternative strategies that can be applied to a position that is aggressive market penetration, market development, product development, backward integration, forward integration, horizontal integration, concentric diversification, horizontal diversification, conglomerate diversification strategy or a combination of all that can be run, depending on the specific conditions encountered by the company.
Cell (2) Diversification strategy. Companies with specific strength to face unfavorable environment. This strategy will be used in long-term opportunities for products or other markets. In this quadrant implies the company remains close to the company's core competencies and does not taking excessive risks. Conservative strategy that is often used is market penetration, market development, product development and concentric diversification.
Cell (3) Defensive strategy. This strategy is used for companies facing major environmental threats while the company is in a relatively weak position. This situation clearly requires strategies that can reduce or limit involvement in product or market in order to survive. Indicates the company is at a competitive strategy. Competitive strategy is often used is backward integration, forward integration, horizontal integration, market penetration, market development, product development, and also joint ventures.
Cell (4) Strategies to improve itself. The company faces a conducive market environment, but constrained by the company's internal weaknesses. This strategy focuses company to overcome these weaknesses in order to be
27
more effective and efficient in serving the product or market. Suggest that companies should focus on improving internal weaknesses and avoid external threats, the strategy is often taken rationalization, divestiture, liquidation and concentric diversification.
Rangkuti (2005) Internal External Matrix is a model developed from the model of General Electric, the parameters used include the strength of the company's internal parameters and external influences facing the company. The purpose of the use of this model is to obtain corporate business strategy at a more detailed level. Identification of 9 cells corporate strategy, according Rangkuti (2005) cells ninth in principle it can be grouped into three main strategies, namely:
1. Growth strategy: a growth company itself (cells 1, 2, and 5) or diversification efforts (cells 7 and 8).
2. Stability strategy: the strategy is implemented without changing the direction of the strategy that has been applied.
3. Retrenchment strategy: the effort to minimize or reduce the efforts of the company.
28
Figure 6. Rangkuti’s Internal-External Matrix.
Source: Rangkuti (2005)
To obtain a more detailed explanation, of the nine strategies contained in the IE matrix of nine cells, from Figure 6 about Rangkuti’s Internal-External Matrix it can be explained as follows Rangkuti (2005) :
1. Growth strategy (Growth strategy)
Designed to achieve growth, both in sales, assets or profit, or a combination of all three. This can be achieved by lowering pRices, develop new products, increase the quality of products or services, or to improve access to a wider market. Attempt to do is to minimize the cost (minimize cost) in order to increase profits. This method is an important strategy if conditions in the company's rapid growth and there is a tendency for the competitors into a pRice war in an attempt to increase market share. Thus, companies that have not reached critical mass (a profit of large scale production) would be defeated, unless the company can focus on a particular market profitable.