arXiv:1012.1792v2 [hep-ex] 9 Dec 2010
CERN-PH-EP-2010-064
(Submitted to EPJC)
December 8, 2010
Measurement of the top quark-pair production cross section
with ATLAS in pp collisions at
√
s = 7 TeV
The ATLAS Collaboration
Abstract
A measurement of the production cross-section for top quark pairs (t¯t) in pp collisions at √s = 7 TeV is presented using data recorded with the ATLAS detector at the Large
Hadron Collider. Events are selected in two different topologies: single lepton (electron e or muon µ) with large missing transverse energy and at least four jets, and dilepton (ee, µµ or
eµ) with large missing transverse energy and at least two jets. In a data sample of 2.9 pb−1, 37 candidate events are observed in the single-lepton topology and 9 events in the dilepton topology. The corresponding expected backgrounds from non-t¯t Standard Model processes are estimated using data-driven methods and determined to be 12.2± 3.9 events and 2.5± 0.6 events, respectively. The kinematic properties of the selected events are consistent with SM
t¯t production. The inclusive top quark pair production cross-section is measured to be
σt¯t= 145± 31+42−27 pb
where the first uncertainty is statistical and the second systematic. The measurement agrees with perturbative QCD calculations.
1
Introduction
The observation of top quark pair (t¯t) production is one of the milestones for the early LHC physics programme. The measurement of the top quark pair production cross-section (σt¯t) in the various decay
channels is interesting for several reasons. Uncertainties on the theoretical predictions are now at the level of 10% and a comparison with experimental measurements performed in different channels will ultimately allow a precision test of the predictions of perturbative QCD. In addition, the abundant t¯t sample which is expected to be produced in the first years of data-taking can be exploited for improving many aspects of detector performance. Finally, t¯t production is an important background in various searches for physics beyond the Standard Model, and new physics may also give rise to additional t¯t production mechanisms or modification of the top quark decay channels.
In the Standard Model (SM) [1] the t¯t production cross-section in pp collisions is calculated to be 164.6+11.4−15.7 pb [2] at a centre of mass energy √s = 7 TeV assuming a top mass of 172.5 GeV, and top
quarks are predicted to decay to a W boson and a b-quark (t → Wb) nearly 100% of the time. Events with a t¯t pair can be classified as ‘single-lepton’, ‘dilepton’, or ‘all hadronic’ by the decays of the two W bosons: a pair of quarks (W → q¯q) or a lepton-neutrino pair (W → ℓν), where ℓ refers to a lepton. At the Tevatron the dominant production mechanism is q ¯q annihilation, and the t¯t cross section at √s = 1.8
GeV and at √s = 1.96 GeV have been measured by D0 and CDF [3] in all channels. The production of t¯t at the LHC is dominated by gg fusion. Recently, the CMS collaboration has presented a cross-section
measurement, σt¯t= 194± 72 (stat.) ± 24 (syst.) ± 21 (lumi.) pb in the dilepton channel using 3.1 pb−1of
data [4].
The results described in this paper are based on reconstructed electrons and muons and include small contributions from leptonically decaying tau leptons. The single-lepton mode, with a branching ratio1of 37.9% (combining e and µ channels), and the dilepton mode, with a branching ratio of 6.5% (combining
ee, µµ and eµ channels), both give rise to final states with at least one lepton, missing transverse energy
and jets, some with b flavour. The cross-section measurements in both modes are based on a straight-forward counting method. The number of signal events is obtained in a signal enriched sample after background subtraction. The main background contributions are determined using data-driven methods, since the theoretical uncertainties on the normalisation of these backgrounds are relatively large. For both single-lepton and dilepton channels, alternative methods of signal extraction and/or background estimation are explored. In particular, two template shape fitting methods, which use additional signal regions to exploit the kinematic information in the events, are developed for the single-lepton mode. In this paper these two fitting methods serve as important cross-checks of the counting method. The methods also provide alternative data-driven estimates of backgrounds and are expected to become more powerful when more data become available.
2
Detector and data sample
The ATLAS detector [5] at the LHC covers nearly the entire solid angle2 around the collision point.
It consists of an inner tracking detector surrounded by a thin superconducting solenoid, electromagnetic and hadronic calorimeters, and an external muon spectrometer incorporating three large superconducting toroid magnet assemblies.
The inner-detector system is immersed in a 2 T axial magnetic field and provides charged particle
1The quoted branching ratios also include small contributions from leptonically decaying taus. 2In the right-handed ATLAS coordinate system, the pseudorapidity η is defined as η =
− ln[tan(θ/2)], where the polar
angle θ is measured with respect to the LHC beamline. The azimuthal angle φ is measured with respect to the x-axis, which points towards the centre of the LHC ring. The z-axis is parallel to the anti-clockwise beam viewed from above. Transverse momentum and energy are defined as pT= p sin θ and ET = E sin θ, respectively.
tracking in the range|η| < 2.5. The high-granularity silicon pixel detector covers the vertex region and provides typically three measurements per track, followed by the silicon microstrip tracker (SCT) which provides four measurements from eight strip layers. These silicon detectors are complemented by the transition radiation tracker (TRT), which enables extended track reconstruction up to|η| = 2.0. In giving typically more than 30 straw-tube measurements per track, the TRT is essential to the inner detector momentum resolution, and also provides electron identification information.
The calorimeter system covers the pseudorapidity range |η| < 4.9. Within the region |η| < 3.2, electromagnetic calorimetry is provided by barrel and endcap lead-liquid argon (LAr) electromagnetic calorimeters, with an additional thin LAr presampler covering |η| < 1.8 to correct for energy loss in
material upstream of the calorimeters. Hadronic calorimetry is provided by the steel/scintillating-tile calorimeter, segmented into three barrel structures within|η| < 1.7, and two copper/LAr hadronic end-cap calorimeters. The solid angle coverage is completed with forward copper/LAr and tungsten/LAr calorimeter modules optimised for electromagnetic and hadronic measurements respectively.
The muon spectrometer comprises separate trigger and high-precision tracking chambers measuring the deflection of muons in a magnetic field with a bending integral from 2 to 8 Tm in the central region, generated by three superconducting air-core toroids. The precision chamber system covers the region
|η| < 2.7 with three layers of monitored drift tubes, complemented by cathode strip chambers in the
forward region, where the background is highest. The muon trigger system covers the range|η| < 2.4 with resistive plate chambers in the barrel, and thin gap chambers in the endcap regions.
A three-level trigger system is used to select interesting events. The level-1 trigger is implemented in hardware and uses a subset of detector information to reduce the event rate to a design value of at most 75 kHz. This is followed by two software-based trigger levels, level-2 and the event filter, which together reduce the event rate to about 200 Hz.
Only data where all subsystems described above are fully operational are used. Applying these requirements to √s = 7 TeV pp collision data taken in stable beam conditions and recorded until 30th
August 2010 results in a data sample of 2.9 pb−1. This luminosity value has a relative uncertainty of 11% [6].
3
Simulated event samples
Monte-Carlo simulation samples are used to develop and validate the analysis procedures, to calculate the acceptance for t¯t events and to evaluate the contributions from some background processes. For the t¯t signal the next-to-leading order (NLO) generator MC@NLO v3.41 [7], is used with an assumed top-quark mass of 172.5 GeV and with the NLO parton density function (PDF) set CTEQ66 [8].
For the main backgrounds, consisting of QCD multi-jet events and W/Z boson production in associ-ation with multiple jets, Alpgen v2.13 [9] is used, which implements the exact LO matrix elements for final states with up to 6 partons. Using the LO PDF set CTEQ6L1 [10], the following backgrounds are generated: W+jets events with up to 5 partons, Z/γ∗+jets events with up to 5 partons and with the
dilep-ton invariant mass mℓℓ > 40 GeV; QCD multi-jet events with up to 6 partons, and diboson WW+jets,
WZ+jets and ZZ+jets events. A separate sample of Z boson production generated with Pythia is used
to cover the region 10 GeV < mℓℓ < 40 GeV. The ‘MLM’ matching scheme of the Alpgen genera-tor is used to remove overlaps between the n and n + 1 parton samples with parameters RCLUS=0.7 and
ETCLUS=20 GeV. For all but the diboson processes, separate samples are generated that include b¯b and c¯c
quark pair production at the matrix element level. In addition, for the W+jets process, a separate sample containing W+c+jets events is produced. For the small background of single-top production MC@NLO is used, invoking the ‘diagram removal scheme’ [11] to remove overlaps between the single-top and the
t¯t final states.
NNLO calculations [2]. The cross-sections for W/Z+jets and diboson with jets have been rescaled by a factor 1.22 to match NNLO calculations of their inclusive cross-sections, as is done in [12]. The QCD multi-jet sample has not been rescaled as it is only used for validation studies.
Unless otherwise noted, all events are hadronised with Herwig, using Jimmy for the underlying event model. The same underlying-event tune has been used for all samples. After event generation, all samples are processed by the standard ATLAS detector and trigger simulation [15] and subject to the same reconstruction algorithms as the data.
3.1 Systematic uncertainties on the simulated samples
The use of simulated t¯t samples to calculate the signal acceptance gives rise to systematic uncertainties from the choice of generator, the amount of initial and final state radiation (ISR/FSR) and uncertainties on the PDF. The uncertainty due to the choice of generator is evaluated by comparing the predictions of MC@NLO with those of Powheg [16] interfaced to both Herwig or Pythia. The uncertainty due to ISR/FSR is evaluated by studies using the AcerMC generator [17] interfaced to Pythia, and by varying the parameters controlling ISR and FSR in a range consistent with experimental data [12]. Finally, the uncertainty in the PDFs used to generate t¯t and single-top events is evaluated using a range of current PDF sets with the procedure described in [12]. In addition, the impact of the assumed top-quark mass is tested with a set of samples generated with different masses.
Simulation-based predictions of W/Z+jets background events have uncertainties on their total cross-section, on the contribution of events with jets from heavy-flavour (b, c) quarks, and on the shape of kinematic distributions. The predictions of the total cross-section have uncertainties of up to O(50%) [18] increasing with jet multiplicity. Total W/Z cross-section predictions are not used in the cross-section analysis, but are used in simulation predictions shown in selected Figures. The heavy-flavor fractions in the W/Z+jets samples are always taken from simulation, as the present data sample is too small to measure them. Here a fully correlated 100% uncertainty on the predicted fractions of b¯b and c¯c quark pairs is assumed, as well as a separate 100% uncertainty on the fraction of events with a single c quark. The uncertainty on the shape of kinematic distributions, used in fit-based cross-checks of the single-lepton analysis, is assessed by varying internal generator parameters, and by comparing Alpgen with Sherpa [19].
For the small backgrounds from single-top and diboson production, only overall normalisation un-certainties are considered and these are taken to be 10% and 5%, respectively.
4
Object and event selection
For both the single lepton and the dilepton analysis, events are triggered by a single lepton trigger (elec-tron or muon) [20]. The detailed trigger requirements vary through the data-taking period due to the rapidly increasing LHC luminosity and the commissioning of the trigger system, but the thresholds are always low enough to ensure that leptons with pT >20 GeV lie in the efficiency plateau.
The electron selection requires a level-1 electromagnetic cluster with pT >10 GeV. A more refined
electromagnetic cluster selection is required in the level-2 trigger. Subsequently, a match between the selected calorimeter electromagnetic cluster and an inner detector track is required in the event filter. Muons are selected requiring a pT >10 GeV momentum threshold muon trigger chamber track at level-1,
matched by a muon reconstructed in the precision chambers at the event filter.
After the trigger selections, events must have at least one offline-reconstructed primary vertex with at least five tracks, and are discarded if any jet with pT >10 GeV at the EM scale is identified as out-of-time
The reconstruction of t¯t events makes use of electrons, muons and jets, and of missing transverse energy EmissT which is a measure of the energy imbalance in the transverse plane and is used as an indicator of undetected neutrinos.
Electron candidates are required to pass the electron selection as defined in Ref. [20], with pT >
20 GeV and|ηcluster| < 2.47, where ηcluster is the pseudorapidity of the calorimeter cluster associated to
the candidate. Candidates in the calorimeter transition region at 1.37 < |ηcluster| < 1.52 are excluded.
In addition, the ratio E/p of electron cluster energy measured in the calorimeter to momentum in the tracker must be consistent with that expected for an electron. Also, in order to suppress the background from photon conversions, the track must have an associated hit in the innermost pixel layer, except when the track passes through one of the 2% of pixel modules known to be dead. Muon candidates are reconstructed from track segments in the different layers of the muon chambers [22]. These segments are then combined starting from the outermost layer, with a procedure that takes material effects into account, and matched with tracks found in the inner detector. The final candidates are refitted using the complete track information from both detector systems, and required to satisfy pT > 20 GeV and
|η| < 2.5.
To reduce the background due to leptons from decays of hadrons (including heavy flavours) produced in jets, the leptons in each event are required to be isolated. For electrons, the ET deposited in the
calorimeter towers in a cone in η-φ space of radius ∆R = 0.2 around the electron position3 is summed,
and the ETdue to the electron (EeT) is subtracted. The remaining ET is required to be less than 4 GeV +
0.023· ETe. For muons, the corresponding calorimeter isolation energy in a cone of ∆R = 0.3 is required to be less than 4 GeV, and the scalar sum of track transverse momenta in a cone of ∆R = 0.3 is also required to be less than 4 GeV after subtraction of the muon pT. Additionally, muons are required to
have a separation ∆R > 0.4 from any jet with pT > 20 GeV, to further suppress muons from heavy
flavour decays inside jets.
Jets are reconstructed with the anti-kt algorithm [23] (∆R = 0.4) from topological clusters [24] of
energy deposits in the calorimeters, calibrated at the electromagnetic (EM) scale appropriate for the energy deposited by electrons or photons. These jets are then calibrated to the hadronic energy scale, using a correction factor obtained from simulation [24] which depends upon pT and η. If the closest
object to an electron candidate is a jet with a separation ∆R < 0.2 the jet is removed in order to avoid double-counting of electrons as jets.
Jets originating from b-quarks are selected by exploiting the long lifetime of b-hadrons (about 1.5 ps) which leads to typical flight paths of a few millimeters which are observable in the detector. The SV0 b-tagging algorithm[25] used in this analysis explicitly reconstructs a displaced vertex from the decay products of the long-lived b-hadron. As input, the SV0 tagging algorithm is given a list of tracks associ-ated to the calorimeter jet. Only tracks fulfilling certain quality criteria are used in the secondary vertex fit. Secondary vertices are reconstructed in an inclusive way starting from two- track vertices which are merged into a common vertex. Tracks giving large χ2 contributions are then iteratively removed until the reconstructed vertex fulfills certain quality criteria. Two-track vertices at a radius consistent with the radius of one of the three pixel detector layers are removed, as these vertices likely originate from material interactions. A jet is considered b-tagged if it contains a secondary vertex, reconstructed with the SV0 tagging algorithm, with L/σ(L) > 5.72, where L is the decay length and σ(L) its uncertainty. This operating point yields a 50% b-tagging efficiency in simulated t¯t events. The sign of L/σ(L) is given by the sign of the projection of the decay length vector on the jet axis.
The missing transverse energy is constructed from the vector sum of all calorimeter cells contained in topological clusters. Calorimeter cells are associated with a parent physics object in a chosen order: electrons, jets and muons, such that a cell is uniquely associated to a single physics object [26]. Cells
3The radius ∆R between the object axis and the edge of the object cone is defined as ∆R =
q
belonging to electrons are calibrated at the electron energy scale, but omitting the out-of-cluster correc-tion to avoid double cell-energy counting, while cells belonging to jets are taken at the corrected energy scale used for jets. Finally, the contributions from muons passing selection requirements are included, and the contributions from any calorimeter cells associated to the muons are subtracted. The remaining clustered energies not associated to electrons or jets are included at the EM scale.
The modelled acceptances and efficiencies are verified by comparing Monte-Carlo simulations with data in control regions which are depleted of t¯t events. Lepton efficiencies are derived from data in the Z boson mass window, and are validated by using them to estimate inclusive W and Z boson cross-sections. The acceptances for the jet multiplicity and ETmiss cuts are validated using a number of control regions surrounding the t¯t signal region in phase-space.
4.1 Systematic uncertainties for reconstructed objects
The uncertainties due to Monte-Carlo simulation modelling of the lepton trigger, reconstruction and selection efficiencies are assessed using leptons from Z → ee and Z → µµ events selected from the same data sample used for the t¯t analyses. Scale factors are applied to Monte-Carlo samples when calculating acceptances. The statistical and systematic uncertainties on the scale factors are included in the uncertainties on the acceptance values. The modelling of the lepton energy scale and resolution are studied using reconstructed Z boson mass distributions, and used to adjust the simulation accordingly.
The jet energy scale (JES) and its uncertainty are derived by combining information from test-beam data, LHC collision data and simulation [24]. The JES uncertainty varies in the range 6–10% as a function of jet pT and η. The jet energy resolution (JER) and jet finding efficiency measured in data
and in simulation are in agreement. The limited statistical precision of the comparisons for the energy resolution (14%) and the efficiency (1%) are taken as the systematic uncertainties in each case.
The b-tagging efficiency and mistag fraction of the SV0 b-tagging algorithm have been measured on data [25]. The efficiency measurement is based on a sample of jets containing muons and makes use of the transverse momentum of a muon relative to the jet axis. The measurement of the mistag fraction is performed on an inclusive jet sample and includes two methods, one which uses the invariant mass spectrum of tracks associated to reconstructed secondary vertices to separate light- and heavy-flavour jets and one which is based on the rate at which secondary vertices with negative decay-length significance are present in the data. Both the b-tagging efficiency and mistag fraction measured in data depend strongly on the jet kinematics. In the range 25 < pT(jet) < 85 GeV, the b-tagging efficiency rises
from 40% to 60%, while the mistag fraction increases from 0.2% to 1% between 20 and 150 GeV. The measurements of the b-tagging efficiencies and mistag fractions are provided in the form of pT-dependent
scale factors correcting the b-tagging performance in simulation to that observed in data. The relative statistical (systematic) uncertainties for the b-tagging efficiency range from 3% to 10% (10% to 12%). For the b-tagging efficiency, the scale factor is close to one for all values of jet pT. For light-flavour jets,
the simulation underestimates the tagging efficiency by factors of 1.27± 0.26 for jets with pT <40 GeV
and 1.07± 0.25 for jets with pT>40 GeV.
The LHC instantaneous luminosity varied by several orders of magnitude during the data-taking pe-riod considered for this measurement, reaching a peak of about 1× 1031cm−2s−1. At this luminosity, an average of about two extra pp interactions were superimposed on each hard proton-proton interaction. This ‘pileup’ background produces additional activity in the detector, affecting variables like jet recon-struction and isolation energy. No attempts to correct the event reconrecon-struction for these effects are made, since the data-driven determination of object identification and trigger efficiencies and backgrounds nat-urally include them. The residual effects on the t¯t event acceptance are assessed by using t¯t simulation samples with additional pileup interactions, simulated with Pythia, that were overlayed during event digitisation and reconstruction. In a scenario where on average two pileup interactions are added to each
change of acceptance observed in any of the channels is 3.6%. As the effect of pileup is small even in this pessimistic scenario, it is neglected in the acceptance systematics evaluation.
5
Single lepton analysis
5.1 Event selection
The single lepton t¯t final state is characterized by an isolated lepton with relatively high pT and missing
transverse energy corresponding to the neutrino from the W leptonic decay, two b quark jets and two light jets from the hadronic W decay.
The selection of events for the single-lepton analysis consists of a series of requirements on the reconstructed objects defined in Section 4, designed to select events with the above topology. For each lepton flavour, the following event selections are first applied:
• the appropriate single-electron or single-muon trigger has fired;
• the event contains one and only reconstructed lepton (electron or muon) with pT >20 GeV,
match-ing the correspondmatch-ing high-level trigger object;
• EmissT > 20 GeV and E miss
T + mT(W) > 60 GeV
4. The cut on Emiss
T rejects a significant fraction of
the QCD multi-jet background. Further rejection can be achieved by applying a cut in the (ETmiss,
mT(W)) plane; true W → ℓν decays with large EmissT have also large mT(W), while mis-measured
jets in QCD multi-jet events may result in large ETmissbut small mT(W). The requirement on the
sum of ETmissand mT(W) discriminates between the two cases;
• finally, the event is required to have ≥ 1jet with pT > 25 GeV and|η| < 2.5. The requirement on
the pT and the pseudorapidity of the jets is a compromise between the efficiency of the t¯t events
selection, and the rejection of W+jets and QCD multi-jet background.
Events are then classified by the number of jets with pT >25 GeV and|η| < 2.5, being either 1, 2, 3 or at
least 4. These samples are labeled ‘1-jet pre-tag’ through ‘≥4-jet pre-tag’, where the number corresponds to the jet multiplicity as defined above and pre-tag refers to the fact that no b-tagging information has been used. Subsets of these samples are then defined with the additional requirement that at least one of the jets with pT >25 GeV is tagged as a b-jet. They are referred to as the ‘1-jet tagged’ through ‘≥4-jet
tagged’ samples.
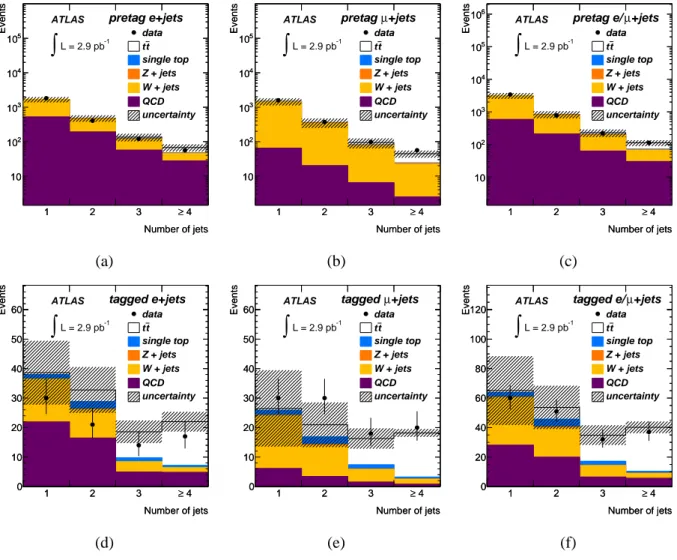
Figure 1 shows the observed jet multiplicity for events in the pre-tag and tagged samples, together with the sum of all expected contributions as expected from simulation, except for QCD multi-jet, which is taken from a data-driven technique discussed in Section 5.2. The largest fraction of t¯t events is concen-trated in≥4-jets bin of the tagged sample, which is defined as the signal region and used for the t¯t signal extraction in the primary method described in Section 5.5.1. One of the cross-check methods, discussed in Section 5.5.2, uses in addition the 3-jet tagged sample for signal extraction. Other regions are used as control samples for the determination of backgrounds.
Table 1 lists the numbers of events in the four tagged samples, as well as the number of events in the 3-jet and≥4-jet zero-tag samples, which comprise the events not containing b-tagged jets. These events are used for background normalisation in the second cross-check method described in Section 5.5.2. For all samples, Table 1 also lists the contributions estimated from Monte Carlo simulation for t¯t, W+jets,
Z+jets and single-top events. The quoted uncertainties are from object reconstruction and identification.
4Here m
T(W) is the W-boson transverse mass, defined as q
2pℓ Tp
ν
T(1− cos(φℓ− φν)) where the measured missing ETvector
For the data-driven estimates of W+jets and QCD multi-jet, the results of the procedures that will be detailed in Sections 5.3 and 5.4 are quoted. The uncertainty on the background prediction is mostly systematic and largely correlated between bins, and is also different in the electron and muon channels due to different sample composition in terms of QCD and W+jets fractions. QCD is larger than W+jets in the electron channel, while it is smaller for muons.
The estimated product of acceptance and branching fraction for t¯t events in the≥4-jet tagged signal
region, measured from Monte Carlo samples, are (3.1± 0.7)% and (3.2 ± 0.7)% for e+jets and µ+jets, respectively. About 90% of the selected t¯t events come from the corresponding t → W → e or µ decay including leptonic τ decays, and the acceptance for those events is 15± 3%. The remaining 10%
comes from dilepton events where one of the leptons was not reconstructed as electron or muon. The contribution from fully hadronic t¯t events is negligible. The uncertainties on the acceptance originate from physics process modelling and object selection uncertainties detailed in Sections 3.1 and 4.1.
5.2 Background determination strategy
The expected dominant backgrounds in the single-lepton channel are W+jets, which can give rise to the same final state as t¯t signal, and QCD multi-jet events. QCD multi-jet events only contribute to the signal selection if the reconstructed ETmissis sufficiently large and a fake lepton is reconstructed. Fake leptons originate in misidentified jets or are non-prompt leptons, e.g. from semileptonic decays of heavy quarks. In the pre-tag samples both W+jets and QCD multi-jet are dominated by events with light quarks and gluons. In the b-tagged samples, light-quark and gluon final states are strongly suppressed and their contributions become comparable to those with b¯b pairs, c¯c pairs and single c quarks, which are all of a similar magnitude.
The contribution of W+jet events and QCD multi-jet events to the≥4-jet bin are both measured with data-driven methods, as detector simulation and/or theoretical predictions are insufficiently precise. The remaining smaller backgrounds, notably single-top production and Z+jets production, are estimated from simulation.
5.3 Background with fake and non-prompt leptons
5.3.1 Background estimate in the µ+jets channel
In the µ+jets channel, the background to ‘real’ (prompt) muons coming from ‘fake’ muons in QCD multi-jet events, is predominantly due to final states with a non-prompt muon. As all other processes (t¯t, W+jets, Z+jets and single-top) in this channel feature a prompt muon from a W or Z boson decay, it is sufficient to estimate the number of events with a non-prompt muon to quantify the QCD multi-jet background.
The number of events in the sample with a non-prompt muon can be extracted from the data by con-sidering the event count in the signal region with two sets of muon identification criteria. The ‘standard’ and ‘loose’ criteria comprise the standard muon definition described in Section 4, with and without, respectively, the requirements on the lepton isolation.
The procedure followed at this point is the so-called ‘matrix method’: the number of events selected by the loose and by the standard cuts, Nloose and Nstdrespectively, can be expressed as linear combina-tions of the number of events with a ‘real’ (prompt) or a ‘fake’ muon:
Nloose = Nrealloose+ Nfakeloose,
Nstd = rNloosereal + f Nfakeloose, (1)
Number of jets 1 2 3 ≥ 4 Events 10 2 10 3 10 4 10 5 10 Number of jets 1 2 3 ≥ 4 Events 10 2 10 3 10 4 10 5 10 data t t single top Z + jets W + jets QCD uncertainty ATLAS -1 L = 2.9 pb
∫
pretag e+jets Number of jets 1 2 3 ≥ 4 Events 10 2 10 3 10 4 10 5 10 Number of jets 1 2 3 ≥ 4 Events 10 2 10 3 10 4 10 5 10 data t t single top Z + jets W + jets QCD uncertainty ATLAS -1 L = 2.9 pb∫
+jets µ pretag Number of jets 1 2 3 ≥ 4 Events 10 2 10 3 10 4 10 5 10 6 10 Number of jets 1 2 3 ≥ 4 Events 10 2 10 3 10 4 10 5 10 6 10 data t t single top Z + jets W + jets QCD uncertainty ATLAS -1 L = 2.9 pb∫
+jets µ pretag e/ (a) (b) (c) Number of jets 1 2 3 ≥ 4 Events 0 10 20 30 40 50 60 Number of jets 1 2 3 ≥ 4 Events 0 10 20 30 40 50 60 data t t single top Z + jets W + jets QCD uncertainty ATLAS -1 L = 2.9 pb∫
tagged e+jets Number of jets 1 2 3 ≥ 4 Events 0 10 20 30 40 50 60 Number of jets 1 2 3 ≥ 4 Events 0 10 20 30 40 50 60 data t t single top Z + jets W + jets QCD uncertainty ATLAS -1 L = 2.9 pb∫
+jets µ tagged Number of jets 1 2 3 ≥ 4 Events 0 20 40 60 80 100 120 Number of jets 1 2 3 ≥ 4 Events 0 20 40 60 80 100 120 data t t single top Z + jets W + jets QCD uncertainty ATLAS -1 L = 2.9 pb∫
+jets µ tagged e/ (d) (e) (f)Figure 1: Jet multiplicity distributions (i.e. number of jets with pT >25 GeV). Top row - pre-tag samples:
(a) electron channel, (b) muon channel and (c) electron/muon combined. Bottom row - tagged samples: (d) electron channel, (e) muon channel and (f) electron/muon combined. The data are compared to the sum of all expected contributions. For the totals shown, simulation estimates are used for all contributions except QCD multi-jet, where a data-driven technique is used. The background uncertainty on the total expectation is represented by the hatched area. The≥4-jet bin in the tagged sample represents the signal region.
e+jets channel
1-jet 2-jet 3-jet ≥4-jet 3-jet ≥4-jet
tagged tagged tagged tagged zero-tag zero-tag
QCD (DD) 21.9± 3.4 16.4± 4.0 4.9± 2.7 4.8± 3.1 52.0± 19 23.0± 11 W+jets (MC) 14.5± 10 9.5± 6.6 3.4± 2.7 1.5± 1.4 55.1± 26 15.1± 10 W+jets (DD) - - - 1.9± 1.1 - 9.3± 4.0 Z+jets (MC) 0.1± 0.1 0.3± 0.1 0.1± 0.1 0.2± 0.1 4.6± 2.2 1.7± 1.3 Single top (MC) 1.6± 0.3 2.6± 0.6 1.3± 0.3 0.7± 0.2 0.9± 0.2 0.4± 0.1 Total (non t¯t ) 38.1± 11 28.8± 7.7 9.7± 3.8 7.2± 3.4 112.6± 32 40.2± 15 t¯t (MC) 0.6± 0.2 4.0± 1.0 8.8± 1.8 14.9± 3.5 4.5± 0.8 5.4± 1.2 Total expected 39± 11 33± 8 19± 4 22± 5 117± 32 46± 15 Observed 30 21 14 17 106 39 (a) µ+jets channel
1-jet 2-jet 3-jet ≥4-jet 3-jet ≥4-jet
tagged tagged tagged tagged zero-tag zero-tag
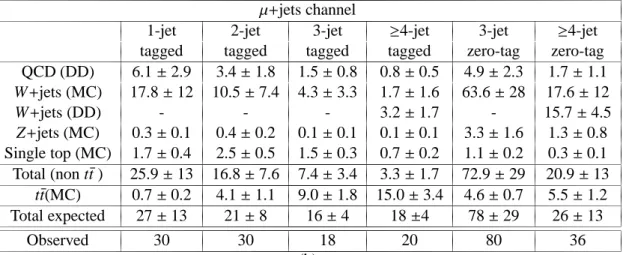
QCD (DD) 6.1± 2.9 3.4± 1.8 1.5± 0.8 0.8± 0.5 4.9± 2.3 1.7± 1.1 W+jets (MC) 17.8± 12 10.5± 7.4 4.3± 3.3 1.7± 1.6 63.6± 28 17.6± 12 W+jets (DD) - - - 3.2± 1.7 - 15.7± 4.5 Z+jets (MC) 0.3± 0.1 0.4± 0.2 0.1± 0.1 0.1± 0.1 3.3± 1.6 1.3± 0.8 Single top (MC) 1.7± 0.4 2.5± 0.5 1.5± 0.3 0.7± 0.2 1.1± 0.2 0.3± 0.1 Total (non t¯t ) 25.9± 13 16.8± 7.6 7.4± 3.4 3.3± 1.7 72.9± 29 20.9± 13 t¯t(MC) 0.7± 0.2 4.1± 1.1 9.0± 1.8 15.0± 3.4 4.6± 0.7 5.5± 1.2 Total expected 27± 13 21± 8 16± 4 18±4 78± 29 26± 13 Observed 30 30 18 20 80 36 (b)
Table 1: Number of tagged and zero-tag events with different jet multiplicities in (a) the single-electron and (b) the single-muon channel. The observed number of events are shown, together with the Monte-Carlo simulation estimates (MC) for t¯t, W+jets, Z+jets and single-top events, normalised to the data integrated luminosity of 2.9 pb−1. The data-driven estimates (DD) for QCD multi-jet (see Section 5.3) and W+jets (see Section 5.4) backgrounds are also shown. The ‘Total (non t¯t)’ row uses the simulation estimate for W+jets for all samples. The uncertainties on all data-driven background estimates include the statistical uncertainty and all systematic uncertainties. The numbers in the ‘Total expected’ rows are rounded to a precision commensurate with the uncertainty.
selection. If r and f are known, the number of events with non-prompt muons can be calculated from Equation 1 given a measured Nloose and Nstd. The relative efficiencies r and f are measured in data in control samples enriched in either prompt or non-prompt muons. The key issue in selecting these control regions is that they should be kinematically representative of the signal region so that the measured control-region efficiency can be applied in the signal region.
An inclusive Z → µ+µ−control sample is used to measure the prompt muon efficiency r = 0.990
±
0.003. No statistically significant dependence on the jet multiplicity is observed. For the measurement of the non-prompt muon efficiency two control regions are used: a Sample A with low missing transverse energy (EmissT < 10 GeV) and at least one jet with pT > 25 GeV, and a Sample B with the nominal
missing transverse energy requirement (EmissT > 20 GeV), at least one jet with pT > 25 GeV, and a
high muon impact parameter significance. Sample A is dominated by QCD multi-jet events as most QCD multi-jet events have little true EmissT and the cross-section is comparatively large. The contribution from events with prompt muons from W/Z+jets which remains in the EmissT < 10 GeV region has to be subtracted. Since the contribution of these processes is not accurately known, it is evaluated in an iterative procedure: the initial value obtained for f is used to predict the number of leptons in the full
ETmissrange. The excess of candidate lepton events in data is attributed to prompt muons from W/Z+jets, whose contribution to the ETmiss < 10 GeV region is then subtracted, obtaining a new value for f . The procedure converges in few iterations and it results in fA = 0.382± 0.007, where the quoted uncertainty
is statistical only. Sample B is kinematically close to the signal region, but the large impact parameter significance requirement selects muons that are incompatible with originating from the primary vertex and the sample is thus enriched in non-prompt muons. Here a value fB = 0.295± 0.025 is measured,
where the uncertainty is again statistical only.
Since both samples A and B are reasonable, but imperfect, approximations of the signal region in terms of event kinematics, the unweighted average f = 0.339± 0.013 (stat.) ± 0.061 (syst.) is taken as the central value. The systematic uncertainty is determined by half the difference between the control regions, multiplied by √2 to obtain an unbiased estimate of the underlying uncertainty, assuming that the two control regions have similar kinematics as the signal region. A single value of f is used to estimate the background in each of the four pre-tag µ+jets samples using Equation 1. The validity of this approach has been verified on samples of simulated events.
For the tagged samples, the estimated background in each pre-tag sample is multiplied by the mea-sured probability for a similar QCD multi-jet event to have at least one b-tagged jet. This results in a more precise measurement of the tagged event rate than a measurement of f in a tagged control sample, which has a large statistical uncertainty due to the relatively small number of tagged events. The b-tagging probabilities for QCD multi-jet events are 0.09±0.02, 0.17±0.03, 0.23±0.06 and 0.31±0.10 for 1 through≥4-jet, respectively. These per-event b-tag probabilities have been measured in a sample defined by the pre-tag criteria, but without the EmissT cut, and by relaxing the muon selection to the loose criteria. The systematic uncertainty on this per-event tagging probability is evaluated by varying the selection criteria of the sample used for the measurement.
The estimated yields of QCD multi-jet events in the tagged µ + (1, 2, 3 and≥4-jet), zero-tag µ + (3
and ≥4-jet) and the pre-tag µ + (1 and 2-jet) are summarised in Table 1 (b) and also shown in Table 2.
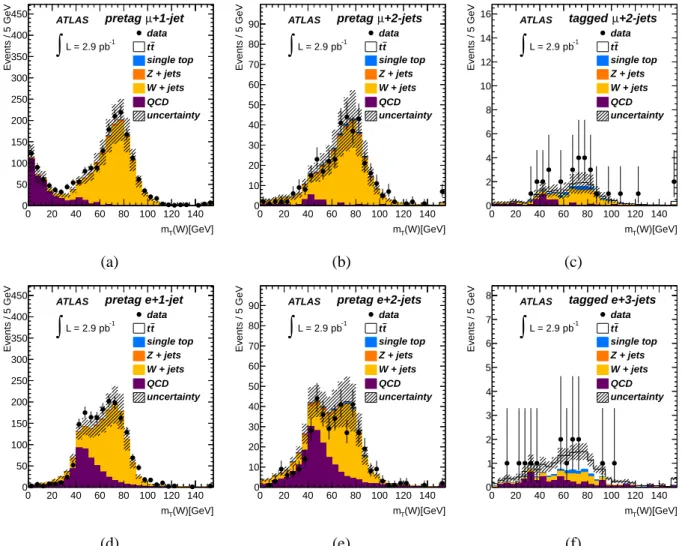
Figure 2 (a) shows the distribution of mT(W) for the 1-jet pre-tag sample without the EmissT + mT(W)
requirement, while Figures 2 (b) and (c) show mT(W) for the 2-jet pre-tag and for the 2-jet tagged samples
respectively after the EmissT + mT(W) requirement. Good agreement is observed comparing the data to the
estimated rate of QCD multi-jet events summed with the other (non-QCD) simulation predictions. The full QCD multi-jet background estimation procedure has been validated by applying the proce-dure on a sample of simulated events and comparing the result with the known amount of QCD multi-jet background in the sample. The systematic uncertainty on the µ+jets multi-jet background estimate is due to the control region uncertainty described above, and up to a relative 30% uncertainty originating from
(W)[GeV] T m 0 20 40 60 80 100 120 140 Events / 5 GeV 0 50 100 150 200 250 300 350 400 450 data t t single top Z + jets W + jets QCD uncertainty ATLAS -1 L = 2.9 pb
∫
+1-jet µ pretag (W)[GeV] T m 0 20 40 60 80 100 120 140 Events / 5 GeV 0 10 20 30 40 50 60 70 80 90 data t t single top Z + jets W + jets QCD uncertainty ATLAS -1 L = 2.9 pb∫
+2-jets µ pretag (W)[GeV] T m 0 20 40 60 80 100 120 140 Events / 5 GeV 0 2 4 6 8 10 12 14 16 data t t single top Z + jets W + jets QCD uncertainty ATLAS -1 L = 2.9 pb∫
+2-jets µ tagged (a) (b) (c) (W)[GeV] T m 0 20 40 60 80 100 120 140 Events / 5 GeV 0 50 100 150 200 250 300 350 400 450 data t t single top Z + jets W + jets QCD uncertainty ATLAS -1 L = 2.9 pb∫
pretag e+1-jet (W)[GeV] T m 0 20 40 60 80 100 120 140 Events / 5 GeV 0 10 20 30 40 50 60 70 80 90 data t t single top Z + jets W + jets QCD uncertainty ATLAS -1 L = 2.9 pb∫
pretag e+2-jets (W)[GeV] T m 0 20 40 60 80 100 120 140 Events / 5 GeV 0 1 2 3 4 5 6 7 8 data t t single top Z + jets W + jets QCD uncertainty ATLAS -1 L = 2.9 pb∫
tagged e+3-jets (d) (e) (f)Figure 2: Distributions of mT(W). Top row - µ+jets channel : (a) the 1-jet pre-tag sample (where the
ETmiss+ mT(W) requirement is not applied), (b) the 2-jet pre-tag sample and (c) the 2-jet tagged sample.
Bottom row - e+jets channel: (d) the 1-jet pre-tag sample, (e) the 2-jet pre-tag sample and (f) the 3-jet tagged sample. In each plot data are compared to the sum of the data-driven QCD estimate plus the contributions from W/Z+jets and top from simulation. The background uncertainty on the total expectation is represented by the hatched area.
the method validation studies on the simulation and, for the tagged samples, the uncertainty originating from the per-event b-tagging probabilities.
5.3.2 Background estimate in the e+jets channel
In the e+jets channel, the background consists of both non-prompt electrons and fake electrons where the latter include both electrons from photon conversion and misidentified jets with high EM fractions. The relative magnitude of the non-prompt and fake components is not well known, as it depends on the details of electron misreconstruction effects that are not perfectly modelled in the simulation as well as on the fraction of QCD multi-jet events with non-prompt electrons in the final state. As the ratio also varies with the event kinematics, the method of Equation 1, which relies on a representative control region to measure the input values of f , is not well suited for the electron channel.
A method, based on a binned likelihood template fit of the EmissT distribution, is used for the back-ground estimate. For each previously defined pre-tag and tagged sample, the data are fitted to a sum of four templates describing the ETmissdistribution of the QCD multi-jet, t¯t , W+jets and Z+jets components respectively. The fit is performed in the region with ETmiss < 20 GeV which is complementary to the signal region. To improve the statistical precision the requirement on EmissT + mT(W) is not applied. The
QCD multi-jet template is extracted from the data as described in the next paragraph, while the templates for the other processes are taken from the simulation. The fraction of QCD multi-jet events in the sig-nal region is then calculated by extrapolating the expected fraction of events for each component to the signal region using the template shape and accounting for the efficiency of the EmissT + mT(W) cut for
each template. The output of the fit is ρQCD, the predicted fraction of QCD multi-jet events in the signal
region, which is then multiplied by the observed event count.
The templates for the QCD multi-jet EmissT distributions are obtained from two data control regions. In the first region called ‘jet-electrons’, events are selected which have, instead of the standard electron, an additional jet which passes the standard electron kinematic cuts and has at least 4 tracks and an EM fraction of 80-95%. In the second region called ‘non-electrons’, the standard event selection is applied, except that the electron candidate must fail the track quality cut in the innermost layers of the tracking detector. Since both control samples are approximations of the signal region in terms of event kinematics, the unweighted average of ρQCDpredicted by the template fits using the jet-electron and
non-electron templates, respectively, is taken for the QCD multi-jet component. The uncertainty on ρQCDhas
a component from the template fit uncertainty, a component that quantifies the uncertainty related to the choice of control region, evaluated as the difference in ρQCD between the two regions divided by
√
2, and a component related to the method calibration performed on simulation samples. The latter varies between 2% and 36% depending on the sample.
The results for the QCD multi-jet background contribution to the e+jets channel are summarised in Table 1 (a), and are also shown in Table 2. The estimates for the tagged e+jets samples are performed directly in tagged control samples which have a sufficiently large number of events, and no per-event
b-tagging probabilities are used.
Figure 2 (bottom row) shows the distributions of mT(W) for (d) the e + 1-jet pre-tag, (e) the e +
2-jet pre-tag, and (f) the e + 3-jet tagged samples. Acceptable agreement is observed between data and the sum of the QCD multi-jet background estimated with the fitting method and the other backgrounds estimated from simulation.
5.4 W+jets background
The data-driven estimate for the W+jets background in both electron and muon channels is constructed by multiplying the corresponding background contribution in the pre-tag sample by the per-event b-tagging
probability:
Wtagged≥4-jet = Wpre-tag≥4-jet · ftagged≥4-jet. (2)
Here Wpre-tag≥4-jet is an estimate of the W+jets event count in the pre-tag ≥4 jet sample and f≥4-jettagged is the fraction of these events that are tagged, calculated as
ftagged≥4-jet = ftagged2-jet · f2corr→≥4, (3)
where ftagged2-jet is a measurement of the W+jets tag fraction in the 2-jet sample and f2corr→≥4 accounts for the difference in flavour composition between the 2-jet and≥4-jet samples as well as differences in the per-flavour event tagging probabilities, which may lead to different event rates after b-tagging.
For the first ingredient, Wpre-tag≥4-jet , the fact that the ratio of W+n+1 jets to W+n jets is expected to be approximately constant as a function of n is exploited [27, 28]. This is supported by the good agreement with the Standard Model expectation as shown in Figure 1. The number of W events in the≥4-jet pre-tag sample can thus be estimated as
Wpre-tag≥4-jet = Wpre-tag2-jet ·
∞
X
n=2
(Wpre-tag2-jet /Wpre-tag1-jet )n, (4)
where the sum is used to extrapolate to a sample with four or more jets. These rates are obtained by subtracting the estimated non-W boson contributions from the event count in the pre-tag 1-jet and 2-jet bins. The QCD multi-jet contribution is estimated from data as described in Section 5.3 and simulation-based estimates are used for the other backgrounds. The scaling behaviour of Equation 4 does not apply to W → τν events as their selection efficiency depends significantly on the jet multiplicity. This contribution is subtracted from the observed event count in the Wpre-tag1-jet and Wpre-tag2-jet control samples and is estimated separately in the electron and the muon channel using the simulation to predict the ratio of
(W → τν / W → ℓν). The data-driven technique is used for the estimation of the W → eν background in
the electron channel and the W → µν background in the muon channel. Table 2 compares the observed event yields in both the 1-jet and 2-jet samples with the estimated pre-tag backgrounds for both the electron and muon channels. Figures 2 (b) and 2 (e) show the mT(W) distribution for the 2-jet pre-tag
samples in the muon and electron channels, respectively.
1-jet pre-tag e 1-jet pre-tag µ 2-jet pre-tag e 2-jet pre-tag µ
Observed 1815 1593 404 370 QCD multijet (DD) 517± 89 65± 28 190± 43 20.0± 9.7 W(τν)+jets (MC) 39± 10 43± 11 11.7± 4.4 13.6± 5.1 Z+jets (MC) 19.0± 9.1 48± 12 11.6± 5.2 14.0± 4.8 t¯t (MC) 1.7± 0.8 1.7± 0.8 7.0± 3.0 7.7± 3.3 single-t (MC) 4.4± 0.7 5.0± 0.8 5.2± 0.8 5.1± 0.8 diboson (MC) 4.8± 4.8 5.7± 5.7 3.8± 3.8 4.4± 4.4
Total (non W(lν)+jets) 585± 90 168± 33 229± 44 65± 13
Estimated W(lν)+jets 1230± 100 1425± 52 175± 49 305± 23 Table 2: Observed event yields in the pre-tag 1-jet and 2-jet samples and estimated contributions from non-W processes and W → τν. The estimation for QCD multi-jet events is data-driven (DD), all other estimates are based on simulation (MC). The last row gives the number of W(lν)+jet events, estimated as the observed event count minus all other contributions.
The ratio between the 2-jet and 1-jet rates is measured with significantly poorer precision in the electron channel, because of the larger QCD multi-jet contamination. Since the ratio between the 2-jet and 1-jet rates is expected to be independent of the W boson decay mode, the muon channel estimation is used also for the electron channel, giving
Wpre-tag≥4-jet = 11.2± 2.2(stat.) ± 4.0(syst.), e channel,
Wpre-tag≥4-jet = 18.9± 4.1(stat.) ± 5.0(syst.), µchannel.
The leading systematic uncertainties are the uncertainty on the purity of the low jet multiplicity control samples and the uncertainty associated with the assumption that the (W + n + 1 jets)/(W + n jets) ratio is constant. The latter relative uncertainty has been evaluated to be 24% from the results reported in [29].
For the second ingredient, ftagged2-jet , the pre-tag yield is taken from Table 2 and the pre-tag non-W boson backgrounds (also from Table 2) are subtracted from this yield. This gives an estimate of the
W+jets contribution in the 2-jet pre-tag sample. The same is done in the tagged sample: the estimated
non-W boson backgrounds, as shown in Table 1, are subtracted from the measured yield after applying the tagging criteria resulting in an estimate of the W+jets contribution in the 2-jet sample after tagging. The ratio of the tagged to the pre-tag contributions represents the estimate of the fraction of tagged events in the 2-jet sample
ftagged2-jet = 0.060± 0.018(stat.) ± 0.007(syst.).
This quantity is computed from the muon channel only, due to the large uncertainty originating from the QCD multi-jet contamination in the electron channel. Figures 2 (b) and 2 (c) show the distribution of the transverse mass mT(W) for the µ+jets 2-jet pre-tag and tagged samples respectively. Clear W signals are
evident in both samples.
The final ingredient, the correction factor f2corr→≥4, is defined as f2corr→≥4 = ftagged≥4-jet/ftagged2-jet . It is obtained from simulation studies on Alpgen W+jets events and is determined to be:
f2corr→≥4= 2.8± 0.8(syst.). (5)
The quoted uncertainty on f2corr→≥4reflects uncertainties on the assumed flavour composition of the pre-tag 2-jet sample, the uncertainty on the scaling factors for the b-tagging efficiency for b, c and light-quark jets, and the uncertainty on the ratio of fractions in the 2-jet bin and the ≥4-jet bin for W+b¯b+jets,
W+c¯c+jets and W+c+jets. The leading uncertainty on f2corr→≥4is due to the uncertainty on the predicted ratios of flavour fractions in the 2-jet and≥4-jet bin. This is estimated by the variation of several Alpgen generator parameters that are known to influence these ratios [9], and adds up to a relative 40%-60% per ratio. The uncertainty on the flavour composition in the 2-jet bin, while large in itself, has a small effect on f2corr→≥4due to effective cancellations in the ratio.
Applying Equation (2) and Equation (3) the estimated yields for W+jets in the≥4-jet tagged samples are
Wtagged≥4-jet = 1.9± 0.7(stat.) ± 0.9(syst.), e channel,
Wtagged≥4-jet = 3.2± 1.2(stat.) ± 1.2(syst.), µchannel.
5.5 Cross-section measurement
5.5.1 Counting-based measurement of the cross-section in the≥4-jet bin
In the≥4-jet tagged sample the t¯t signal yield is obtained by subtracting the estimated rate of all back-grounds from the observed event yield. This method depends crucially on the understanding of the background, but makes minimal assumptions on t¯t signal properties for the yield calculation. For the QCD multi-jet and W+jets backgrounds, the data-driven estimates described in detail in Sections 5.3 and 5.4 are used, while for the expected background from Z+jets and single-top production, simulation estimates are used. Table 1 shows the complete overview of background contributions that are used in this calculation. The observed yields, the total expected background yields and the resulting t¯t signal yields for the e+jets , µ+jets and combined channels are shown in Table 3.
e+jets µ+jets combined
Observed 17 20 37
Total est. background 7.5± 3.1 4.7± 1.7 12.2± 3.9
t¯t 9.5± 4.1 ± 3.1 15.3± 4.4 ± 1.7 24.8± 6.1 ± 3.9
Table 3: Observed event yield, estimated total background and t¯t signal using the counting method in the
b-tagged≥4-jet bin, for electrons and muons separately and combined. The total background consists of
the sum of individual backgrounds listed in Table 1, choosing the data-driven estimate for W+jets (instead of the simulation-based W+jets estimate used in the ‘total (non-t¯t )’ row of Table 1). The uncertainty on the total background includes statistical uncertainties in control regions and systematic uncertainties. The first quoted uncertainty on the t¯t signal yield is statistical, while the second is from the systematics on the background estimation.
The product of acceptance and branching fraction of t¯tevents in the≥4-jet tagged signal region, measured from Monte-Carlo samples and quoted in Section 5.1, is used together with the value of the integrated luminosity to extract the cross-section (σt¯t) from the observed event yield. The resulting cross-sections
are shown in Table 5.
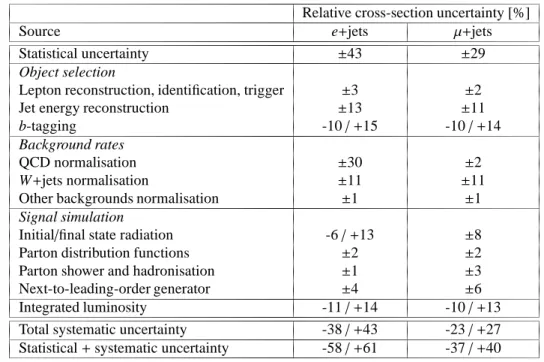
Table 4 provides a detailed breakdown of the total systematic uncertainties on the cross-section for this method. The components listed under ‘Object selection’ relate to sources discussed in Section 4.1. The components listed under ‘Background rates’ relate to the uncertainties on background estimates detailed in Sections 5.3 and 5.4. The components listed under ‘Signal simulation’ relate to sources discussed in Section 3.1. The largest systematic uncertainty is due to the normalisation of the QCD multi-jet background in the e+jets channel, followed by the uncertainties which affect mainly the t¯t acceptance, like jet energy reconstruction, b-tagging and ISR/FSR. The dependence of the measured cross-section on the assumed top-quark mass is small. A change of ±1GeVin the assumed top-quark
mass results in a change of∓1% in the cross-section.
While not used in the counting method, further information can be gained from the use of kinematic event properties: in the t¯t candidate events, three of the reconstructed jets are expected to come from a top quark which has decayed into hadrons. Following [12], the hadronic top quark candidate is empir-ically defined as the combination of three jets (with pT > 20 GeV) having the highest vector sum pT.
This algorithm does not make use of the b-tagging information and selects the correct combination of the reconstructed jets in about 25 % of cases. The observed distributions of the invariant mass (mjjj) of the
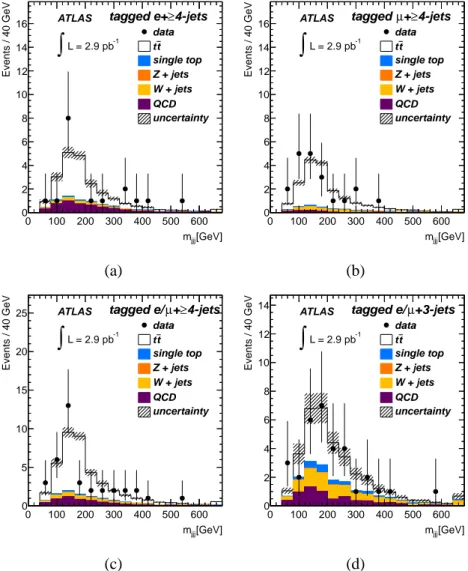
hadronic top quark candidates in the various≥4-jet samples, shown in Figures 3 (a) - 3 (c), demonstrate good agreement between the data and the signal+background expectation. Figure 3d highlights a sub-stantial contribution of t¯t signal events in the 3-jet tagged sample and demonstrates further information which is also not exploited by the baseline counting method.
[GeV] jjj m 0 100 200 300 400 500 600 Events / 40 GeV 0 2 4 6 8 10 12 14 16 data t t single top Z + jets W + jets QCD uncertainty ATLAS -1 L = 2.9 pb
∫
4-jets ≥ tagged e+ [GeV] jjj m 0 100 200 300 400 500 600 Events / 40 GeV 0 2 4 6 8 10 12 14 16 data t t single top Z + jets W + jets QCD uncertainty ATLAS -1 L = 2.9 pb∫
4-jets ≥ + µ tagged (a) (b) [GeV] jjj m 0 100 200 300 400 500 600 Events / 40 GeV 0 5 10 15 20 25 data t t single top Z + jets W + jets QCD uncertainty ATLAS -1 L = 2.9 pb∫
4-jets ≥ + µ tagged e/ [GeV] jjj m 0 100 200 300 400 500 600 Events / 40 GeV 0 2 4 6 8 10 12 14 data t t single top Z + jets W + jets QCD uncertainty ATLAS -1 L = 2.9 pb∫
+3-jets µ tagged e/ (c) (d)Figure 3: Distributions of the invariant mass of the 3-jet combination having the highest pT for (a) the ≥4-jet
tagged e+jets sample, (b) the≥4-jet tagged µ+jets sample, (c) the ≥4-jet tagged samples combined and (d) the combined 3-jet tagged sample. The data is compared to the sum of all expected contributions. For the totals shown, simulation estimates are used for all contributions except QCD multi-jet, where a data-driven technique is used. The background uncertainty on the total expectation is represented by the hatched area.
Relative cross-section uncertainty [%]
Source e+jets µ+jets
Statistical uncertainty ±43 ±29
Object selection
Lepton reconstruction, identification, trigger ±3 ±2
Jet energy reconstruction ±13 ±11
b-tagging -10 / +15 -10 / +14
Background rates
QCD normalisation ±30 ±2
W+jets normalisation ±11 ±11
Other backgrounds normalisation ±1 ±1
Signal simulation
Initial/final state radiation -6 / +13 ±8
Parton distribution functions ±2 ±2
Parton shower and hadronisation ±1 ±3
Next-to-leading-order generator ±4 ±6
Integrated luminosity -11 / +14 -10 / +13
Total systematic uncertainty -38 / +43 -23 / +27
Statistical + systematic uncertainty -58 / +61 -37 / +40
Table 4: Summary of individual systematic uncertainty contributions to the single-lepton cross-section determination using the counting method. The combined uncertainties listed in the bottom two rows include the luminosity uncertainty.
5.5.2 Fit based cross-section measurement in the 3-jet and≥4-jet samples
A complementary approach to measuring the cross-section exploits the data in both the 3-jet and ≥4-jet samples. With the current data sample, it gives an important cross-check of the counting method, as it makes different physics assumptions for the signal and background modelling. This technique is expected to become more powerful once more integrated luminosity has been collected.
In the first approach (A), the tagged 3-jet and≥4-jet samples are used. The mjjjdistribution for each
sample is described by the sum of four templates for t¯t, W+jets, QCD multi-jet and other backgrounds respectively. This method fits simultaneously the t¯t and W+jets components, relying mostly on shape information. The shapes of the templates for t¯t, W+jets and smaller backgrounds are taken from simula-tion. The template for the QCD multi-jet background is taken from a data sample using a modified lepton definition, which requires at least one of the selection criteria listed in Section 4 to fail. A constraint, sim-ilar to the f2corr→≥4correction factor discussed in Section 5.4, is introduced in the ratio of the W+jets yields in the 3-jet and≥4-jet samples, which reduces the uncertainty on the extracted signal yield. Additionally, the W+jets yields in the e+jets and µ+jets channels are related by their respective acceptances.
In the second approach (B), the tagged and zero-tag≥4-jet samples are used, with a template describ-ing the sum of all backgrounds in each of these two samples. The fraction of background events that are tagged in the≥4-jet bin is constrained in the fit to a prediction based on the measured tagged fraction in the 3-jet sample and includes a simulation-based correction for the expected difference between the 3-jet
and≥4-jet bins. The template for t¯t and the relative contributions to the different samples are taken from
simulation, while the template for the background is taken from a QCD multi-jet enhanced sample in data. The assumed rate of t¯t events in the 3-jet bin is iteratively adjusted to the measured cross-section.
5.5.3 Results
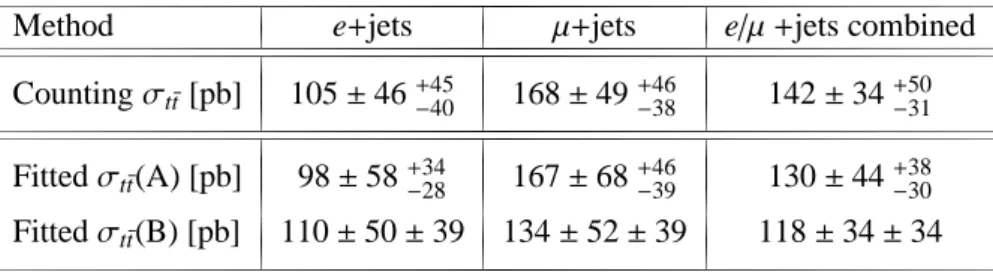
The cross-sections obtained with the baseline counting method in the e+jets and µ+jets channels are shown in Table 5. The fit methods make different assumptions about the signal and background and therefore serve as good cross-checks; their cross-sections are also shown in Table 5 and are in good agreement with those obtained from the baseline counting method. Additionally, the estimate for the
W+jets background in ≥4-jet tagged sample as measured in fit A is in agreement with the estimate
quoted in Section 5.4. Table 5 also shows the cross-section obtained with the counting method for the
e+jets and µ+jets channels, combined using the procedure described in Section 7. For the fit methods,
the combined cross-sections are obtained from a simultaneous fit to the electron and muon samples. The systematic uncertainties of both fit-based methods are dominated by acceptance-related system-atic uncertainties. Compared to the counting method, both fit-based techniques have a reduced sensitivity to the QCD multi-jet background rate but have method specific systematics: the ratio of tagged W+jets in the 3-jet and≥4-jet bins and shape-modelling uncertainties for fit A, and the modelling of the b-tagged fraction for fit B. This trade-off results in a comparable total uncertainty for both methods compared to the counting method.
Method e+jets µ+jets e/µ +jets combined
Counting σt¯t[pb] 105± 46+45−40 168± 49+46−38 142± 34+50−31
Fitted σt¯t(A) [pb] 98± 58+34−28 167± 68+46−39 130± 44+38−30
Fitted σt¯t(B) [pb] 110± 50 ± 39 134± 52 ± 39 118± 34 ± 34
Table 5: Inclusive t¯t cross-section measured in the single-lepton channel using the counting method and the template shape fitting techniques (A and B). The uncertainties represent respectively the statistical and systematic uncertainty including luminosity. The top row shows the counting-method results that are used for the combination presented in Section 7.
6
Dilepton analysis
6.1 Event selection
The dilepton t¯t final state is characterized by two isolated leptons with relatively high pT, missing
trans-verse energy corresponding to the neutrinos from the W leptonic decays, and two b quark jets. The selection of events in the signal region for the dilepton analysis consists of a series of kinematic require-ments on the reconstructed objects defined in Section 4:
• Exactly two oppositely-charged leptons (ee, µµ or eµ) each satisfying pT >20 GeV, where at least
one must be associated to a leptonic high-level trigger object;
• At least two jets with pT >20 GeV and with|η| < 2.5 are required, but no b-tagging requirements
are imposed;
• To suppress backgrounds from Z+jets and QCD multi-jet events in the ee channel, the missing
transverse energy must satisfy EmissT > 40 GeV, and the invariant mass of the two leptons must differ by at least 5 GeV from the Z boson mass, i.e. |mee− mZ| > 5 GeV. For the muon channel,
• For the eµ channel, no ETmissor Z boson mass veto cuts are applied. However, the event HT, defined
as the scalar sum of the transverse energies of the two leptons and all selected jets, must satisfy
HT >150 GeV to suppress backgrounds from Z+jets production;
• To remove events with cosmic-ray muons, events with two identified muons with large, oppositely
signed transverse impact parameters (d0> 500 µm) and consistent with being back-to-back in the
r− φ plane are discarded.
The EmissT , Z boson mass window, and HTcuts are derived from a grid scan significance optimisation
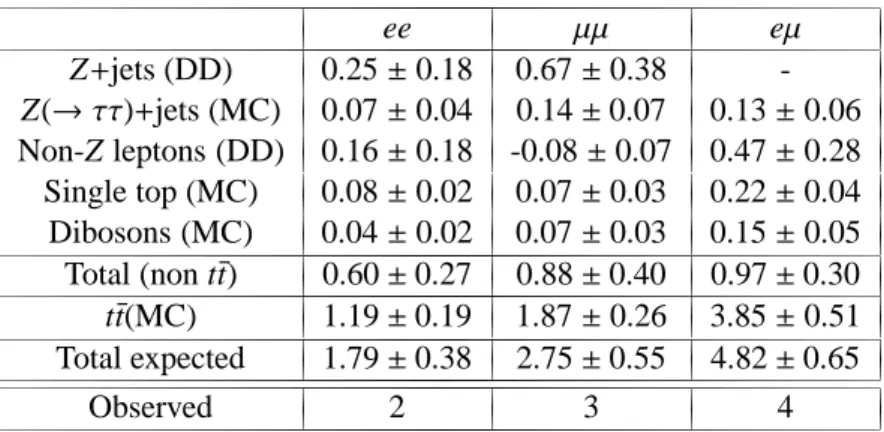
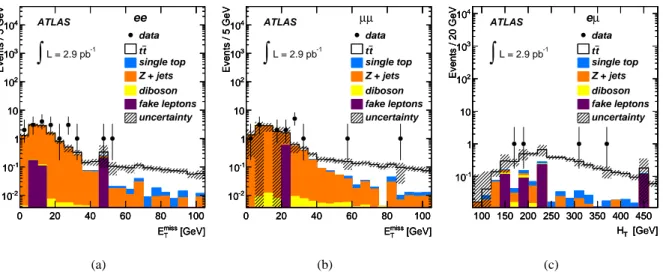
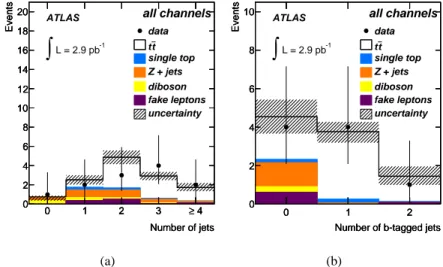
on simulated events which includes systematic uncertainties. The estimated t¯t acceptance, given a dilep-ton event, in each of the dilepdilep-ton channels are 14.8± 1.6% (ee), 23.3 ± 1.8% (µµ) and 24.8 ± 1.2% (eµ). The corresponding acceptances including the t¯t branching ratios are 0.24% (ee), 0.38% (µµ) and 0.81% (eµ). The final numbers of expected and measured events in the signal region are shown in Table 6. Figure 4 shows the predicted and observed distributions of ETmissfor the ee and µµ channels and of HT
for the eµ channel. The predicted and observed multiplicities of all jets and b-tagged jets are compared in Figure 5 and Figure 6 for each channel individually, and in Figure 7 for all channels combined. Fig-ure 7 (b) shows that a majority of the selected events have at least one b-tagged jet, consistent with the hypothesis that the excess of events over the estimated background originates from t¯t decay. In each of these plots the selection has been relaxed to omit the cut on the observable shown.
ee µµ eµ Z+jets (DD) 0.25± 0.18 0.67± 0.38 -Z(→ ττ)+jets (MC) 0.07± 0.04 0.14± 0.07 0.13± 0.06 Non-Z leptons (DD) 0.16± 0.18 -0.08± 0.07 0.47± 0.28 Single top (MC) 0.08± 0.02 0.07± 0.03 0.22± 0.04 Dibosons (MC) 0.04± 0.02 0.07± 0.03 0.15± 0.05 Total (non t¯t) 0.60± 0.27 0.88± 0.40 0.97± 0.30 t¯t(MC) 1.19± 0.19 1.87± 0.26 3.85± 0.51 Total expected 1.79± 0.38 2.75± 0.55 4.82± 0.65 Observed 2 3 4
Table 6: The full breakdown of the expected t¯t-signal and background in the signal region compared to the observed event yields, for each of the dilepton channels (MC is simulation based, DD is data driven). All systematic uncertainties are included.
6.2 Background determination strategy
The expected dominant backgrounds in the dilepton channel are Z boson production in association with jets, which can give rise to the same final state as t¯t signal, and W+jets. The latter can only contribute to the signal selection if the event contains at least one fake lepton.
Both Z+jets background and backgrounds with fake leptons are estimated from the data. The contri-butions from remaining electroweak background processes, such as single-top, WW, ZZ and WZ boson production are estimated from Monte-Carlo simulations.
6.3 Non-Z lepton backgrounds
True t¯t dilepton events contain two leptons from W boson decays; the background comes predominantly from W+jets events and single-lepton t¯t production with a fake lepton and a real lepton, though there is