ISSN-L: 2501 - 1235 Available on-line at: www.oapub.org/edu
doi: 10.5281/zenodo.852506 Volume 3 │ Issue 10 │ 2017
EVALUATION OF THE CORRELATION BETWEEN TIME
MANAGEMENT PERCEPTIONS AND TIME MANAGEMENT
BEHAVIORS OF SPORT MANAGEMENT STUDENTS
Güner Ekenci1,
Aydın Pekel1i,
Abdurrahman Kepoğlu2
1Istanbul Gelişim University, School of Physical Education and Sports, Turkey
2Muğla Sıtkı Koçman University, Faculty of Sport Science, Turkey
Abstract:
The aim of this study is to examine the correlation between the future perceptions of the students of the sports management department and their time management behavior. For this purpose, Gazi, Selçuk, Muğla and Fırat University Sports Sciences Faculty, Sports Management students (n = 770) participated in the questionnaire voluntarily. The socio-demographic information form of the volunteers was applied to the future time perception scale developed by Husman and Shell (1996) and the Time Management Behavior Scale developed by Britton and Tesser (1991). The obtained data was recorded with the package program "IBM SPSS 22". Mann Whitney U, Kruskal Wallis, Spearman Correlation Analysis for the Correlation between future time sense and time management behavior were applied as a statistical process. As a result, there was a significant Correlation between gender, university and class, time management behaviors, gender, university and class variables. Furthermore, a too weak Correlation was found between the future time sense and the time management behavior on the positive side. This may be due to the students' personal development, social circles, socioeconomic status difference and the missions and visions of the students differ. Keywords: future perception, time management behavior, university students, sports management
1. Introduction
It may vary in time for people to develop themselves and achieve their goals. The influence of the individual's immediate or remote future expectations on the present actions of their goals has been one of the research topics of educational psychology since 1960's. To define this in the process, the concept of future time perception is used (Lens and Tsuzuki, 2005). We do not have any knowledge of the future, although we do not have some information about the past. However, future plans can be made. They may need a sense of the future time to plan for themselves and their students and their goals. Future-time perception is defined by Lens and Tsuzuki (2005) as "the effect on the
present actions of the goals that the individual wants to achieve in near or far future".
According to Husman and Shell (1996), the sense of future time is multidimensional. These subdimensions are expressed as dimensions of "connectedness, value, extension and
speed”. Connectedness is the correlation between the individual's current actions and
future goals, the value that the individual gives to the goals he or she wants to achieve in the near or far future, Daltrey and Langer (1984) express the speed as the perception of the individual's speed of passing. The future time perception can be expressed as the process of influencing and developing the aim of the individual to direct himself, direct him and to realize his goal.
It is a complicated process to plan in this direction to prepare for the future time zone. It is inevitable that the students have worries about their future. They need to plan their time so that their worries can be removed and they can achieve their goals, and have a good time management to remove the traps and obstacles in their lives. Life conditions and living standards are divergent from the past to present. The efficient use of the time possessed is individual.
What we have to do is to evaluate the time, which we cannot stop and go on, in the most useful and optimal way for ourselves and for the organization we operate in. The desire to use time efficiently is mostly a form of behavior seen in adults (Uğur, 2000). It is a fact that time can never be bought, sold, rented, stored and reproduced, and will never come back. This shows us in a very striking way how important time management is (Özer, 2010). Time management tries to use time effectively, which is an important resource in reaching goals and targets (Uğur, 2000). The important thing is not to manage the clock, but to manage it over time (Mackenzie, 2001). Time management is a key point for a satisfying life nowadays and time management is a major problem (Balcı, 1990). The purpose of time management is; it is important to allocate unnecessary work to save time, to increase productivity in our work, to carry out long-term work in a shorter time and to do qualified work in a limited time (Gözel,
2010). Time management is the time to plan well and to use it efficiently. (Değirmenci, 1998). Time planning is defined as determining the activities necessary to achieve specific objectives and determining when, how, and when these activities will be carried out (Türkel and Leblebici, 2001). Students should not fall into time traps to use their time effectively during training and other periods. Social relations, personal and cultural traits that cause time lost or cause the bad use of time is called time traps (Aytürk, 1999; Bahçecik, 2004). Life is full of actions that are framed on different complex chains of activity. The importance of time in life, the future time perceptions of the students, the distant and near future goals of the students and the methods and attitudes of the students for the realization of these goals are important in terms of time management. The aim of the study is to examine the Correlation between the future perceptions of the students of sports management department and the time management behaviors.
2. Material and Methods 2.1 Data Collection Tools
2.1.1 Socio-Demographic Information Form
This form created by the researcher consists of four questions which are gender, university, class and sports history.
2.1.2 Future Perception Scale
Future Time Perception Scale developed by Husman and Shell (1996) and made by Avci and Erden (2009) was used to measure future time perceptions of participants in the study. The Future Perception Perception Scale is composed of 27 items. Scale; There are four subscales, Connectedness (12 items), Value (7 items), Extension (5 items) and Speed (3 items). Connectedness subscale; 1, 5, 7, 8, 12, 13, 17, 19, 21, 23, 25 and 27, Value subscale; 2, 6, 9, 14, 15, 18 and 22, Speed subscale; Elements 11, 16, and 26 and the Extension subscale; 3, 4, 10, 20 and 24. 1, 7, 8, 11, 13, 15, 16, 17, 23, 25, 26 and 27 are scored by reversing. The score for the subscales is obtained by dividing the score obtained from the related items by the number of items. The score obtained from all subscales is between 1 and 5. The high scores of the subscales indicate that the individual has an increased propensity to measure the subscale. The validity study of the scale was made using descriptive factor analysis. The Cronbach Alpha coefficients obtained in the reliability study of the scale were 78 for the Future Perception Scale, 82 for the Dependency Subscale, 72 for the Value Subscale, 72 for the Speed Subscale, and
74 for the Extension Subscale. The scale is evaluated on a 5-point Likert-type scale of (5) "Totally Participating" and (1) "Totally Not Participating".
2.1.3 Time Management Behavior Scale
A time management behavior scale consisting of 27 questions developed by Britton and Tesser (1991) and adapted to Turkish by Alay and Koçak (2002) was used to measure participants' time management behaviors in the study. The scale consists of three sub-dimensions, "Time Planning", "Time Attitudes" and "Time Traps". There are 16 items in the time schedule, one of which is scored reversely (item 16). There are 7 questions in the Time Attitudes section, 7 questions in total, 3 questions (2, 6 and 7 items) to be scored reversely. There are 4 questions in the time traps section and all the questions are scored in reverse. The reliability of the questionnaire was measured by calculating the internal consistency coefficient. "88" for Time Scheduling dimension, "66" for Time Attendance dimension. Time consumers were found to be "47" for size and "80" for general size. Time management behavior scale is a measure prepared using the 5-point Likert method. The answers are expressed as "Always", "Frequently ", "Sometimes", "Rarely" and "Never".
2.2. Statistical analysis
The data obtained from the personal information form, Future Time Perception and Time Management Behavior scales were entered into the SPSS22.0 package program and analyzes were made through this program. Personal information about the candidates, inventory averages and factor scores were determined by determining the frequency (f) and percent (%) values. Parametric and nonparametric distribution curves, skewness-kurtosis values of the points are made by examining the parametric and nonparametric distributions. The data show a nonparametric distribution. Mann Whitney U test in comparison with gender as a statistical procedure Kruskal Wallis test in comparison with age, university, class and sports background, Spearman correlation analysis was used for analysis of Correlation between future time perception and time management behavior.
3. Results and Discussion
When the level of perceptions of participants are examined according to gender; it is seen that the connectedness dimension score of male is 46, female is 50, male of score value is 23, female is 23, size of speed is 10, that of female is 10, extension of male is 16, that of female is 16, total score of future time is 94 and that of female is 97. As a result of
the statistical analyses made, there was a significant difference in the dimension of connectedness. It is seen that women have a higher sense of time than men. When the literature is examined, it is not parallel to existing studies (Üstün, Işık, Demirel and Harmandar Demirel, 2016).
As a reason for women having a higher sense of time than men; it may be thought that women strive to reach their future goals, they lead them towards these ends and they adopt a selective way of life.
When the time management behaviors according to the genders of the participants are examined; Men's time planning dimension score is 47, women’s is 45; The time scale of men's score is 21, and women's score is 20; Time traps of men in the size of 12, 14 of women; And the total score for men and women is 79. As a result of the statistical analyses made, significant differences were found in the dimensions of time planning dimension, time attitude dimension and time traps dimension. When the literature is examined, there are as many unrelated studies as there are Correlations between time management behaviors and gender (Kocabaş and Erdem, 2003, Alay and Koçak, 2003, Tektaş ve Tektaş, 2010, Karaoğlu, 2015).
This can be considered to be due to the fact that the participants are detailed in their experiences, they cannot plan their time studies, and they are exposed to realistic traps quickly in the steps taken to reach their goals.
When the levels of future participants' perceptions are examined according to university variables; The highest score in the connectedness dimension belongs to Muğla Sıtkı Koçman University with 51 and the lowest score belongs to Firat University with 42 points; When the value dimension is examined, the scores are the same; When the speed dimension is examined, it is seen that the highest score belongs to Muğla Sıtkı Koçman University with 11 and the lowest score belongs to Fırat University with 9; When the extension dimension is examined, it is seen that the highest score belongs to Gazi University with 17 and the lowest score belongs to Muğla and Fırat University with 15; When the total score of the future time sense is examined, it is seen that the highest score belongs to Muğla Sıtkı Koçman University with 100 and Selcuk University with the lowest score 96. A statistically significant difference was found in the connectedness score, speed dimension, extension dimension and future time perception total score.
When we look at the studies in the literature, we did not find any study that examines the Correlation between university change and future time perception. When the participants' time management behaviors were examined according to university variables; The highest score in the time planning dimension belongs to Muğla Sıtkı Koçman and Fırat University with 48, and the lowest score belongs to Gazi University
with 44.50; It is seen that the time management behaviors belong to Muğla Sıtkı Koçman University with the highest score 82 in the total score and Gazi University with the lowest score 77. As a result of the statistical analysis, a significant difference was found in the total dimension of time planning, time attitudes, time traps and time management behaviors.
This may be due to the change in student profiles depending on the geographical location of the universities and the differences in the opportunities offered by the universities for the development of the students.
When the participants' perception level of future time according to a class variable is examined, it is seen that the highest score in the future time sense total score belongs to the third grade with 97 and the lowest score belongs to the fourth grade with 95. A statistically significant difference was found in the speed dimension and the future time sense total score. In the literature, there is no study that examines the Correlation between classroom changes and the future time perception.
The future time perceptions of the students differ according to the class levels; the students 'future perceptions and future expectations do not resemble each other, and the students' evaluations are based on their near future and distant future graduates.
When the participants' time management behaviors were examined according to the class variable, the highest score in the time planning dimension was 48th to 4th grade, the lowest score belonged to 46th and 1st and 2nd grade; When the time attitudes dimension is examined, the highest score belongs to 22nd to 4th class, the lowest score belongs to 20th to 3rd class; When the time traps dimension was examined, the highest score belonged to 14th grade and the lowest score to 12th and 3rd grade; In the total time management behavior, the highest score is 82 and the lowest score is 77 and the 3rd is the lowest. As a result of statistical analysis, a significant difference was found in the total score of time planning, time attitudes, time traps and time management behaviors. When the literature is examined, no studies have been found to examine the Correlation between classroom variables and time management behaviors. This can be thought of as a result of the development of the mission and visions of the students as a result of passing on to the upper classes, maturing in age, gaining experience, differences in the way of life, as well as the benefits provided by licensing and pedagogical formation training.
When the Correlation between the future time perception and the time management behavior is examined, there was a very positive correlation between the future time perception and the time management behavior (r =, 118, p =, 001). When the
literature is examined, no studies have been found to examine the Correlation between future time perception and time management.
This can be attributed to the desire to use time effectively with the reason for realizing the goals that students want to reach in the near or distant future.
4. Conclusion
As a result, there was a significant Correlation between gender, university and class, time management behavior and gender, university and class variables with future time perception. Furthermore, there is a too weak correlation between the sense of future time and the time management behavior in the positive direction. The management of the department is also aimed at determining the future of the countries in terms of their position in the future with the training they receive (Zorba et al., 2013). In addition to this, it is important to establish a Correlation between the aims of the young people who will start to work life as a sports specialist and the behaviors they have. In this situation, it can be considered that the students' personal development, social circles, socioeconomic status difference and the missions and visions of the students are different.
About the Author(s) Güner Ekenci
He was born in Antalya in 1956. He trained at Istanbul Anadoluhisarı Youth and Sports Academy, Sports Management Department. He worked as a Sports Expert in General Directorate of Sports. He has Master’s degree from Gazi University, Institute of Social Sciences and a PhD degree from Marmara University, respectively. He started to work at Marmara University, Atatürk Education Faculty in 1988. Then he became an Assistant Professor at Gazi University in 1992, an Associate Professor in 1996 and a Professor in 2002. Güner EKENCİ concentrates his studies mostly in the field of sports management. Since 2012, he has been continuing his academic life on Sports Management Department at İstanbul Gelişim University.
Aydın Pekel
He was born in Kayseri in 1984. He had his bachelor's and master's degree from Erciyes University, School of Physical Education and Sports. He is continuing his Ph.D. studies in Muğla Sıtkı Koçman University, Physical Education, and Sports Division. He continues his academic life on Physical Education and Sport Department at Istanbul University.
References
1. Alay S, Koçak S, 2002. Validity and Reliability of Time Management Questionnaire. Hacettepe Üniversitesi Eğitim Fakültesi Dergisi 22: 9-13.
2. Alay S, Koçak S, 2003. Üniversite Öğrencilerinin Zaman Yönetimleri Ile Akademik Başarıları Arasındaki Ilişki. Kuram ve Uygulamada Eğitim Yönetimi Dergisi 35: 326-335.
3. Avcı, S, Erden M, 2009. Gelecek Zaman Algısı Ölçeği’nin Türkçe Formunun Geçerlik ve Güvenirlik Çalışması. Çukurova Üniversitesi Eğitim Fakültesi Dergisi 3(37): 1-12.
4. Aytürk N, 1999. Yönetim Sanatı, Yargı Kitapevi, Ankara
5. Bahçecik N, Öztürk H, Serbetçi GA, 2004. Yönetici Hemşireler İçin Zaman Yönetimi Ölçeği ve Zaman Yönetimini Etkileyen Faktörler. Yönetim Dergisi 15(49): 67-68.
6. Balcı A, 1990. Zaman Yönetimi. Ankara Üniversitesi Eğitim Bilimleri Fakültesi Dergisi 23(1): 96-102. DOI: 10.1501/Egifak_0000000852
7. Britton BK, Tesser A, 1991.Effects of Time Management Practices on College Grades. Journal of Educational Psychology 83: 92-102.
8. Daltrey MH, Langer P, 1984. Development and Evaluation of a Measure of
Future Time Perspective.Perceptualand Motor Skills 58: 719-725.DOI: https://
doi.org/10.2466/pms.1984.58.3.719
9. Değirmenci Y, 1998. Zaman ve Değerlendirilmesi. Bedir Yayınevi, İstanbul
10. Doğan Üstün Ü, Gümüşgül O, Işık U, Demirel M, Harmandar Demirel D, 2016. Gelecek Zaman Algısı: Beden Eğitimi ve Spor Yüksekokulu Öğrencilerine Yönelik Bir Çalışma. İÜ Spor Bilimleri Dergisi 6(1): 1303-1414.
11. Gözel E, Halat E, 2010.İlköğretim Okulu Öğretmenleri ve Zaman Yönetimi. Pamukkale Üniversitesi Sosyal Bilimler Enstitüsü Dergisi 6: 73-89.
12. Husman JE, Shell DF, 1996. Beliefs and Perceptions aboutthe Future. A Conceptualization and Measurement of Future Time Perspective. The XXVI International Congress of Psychology Montreal. Canada.
13. Kocabaş İ, Erdem R, 2003.Yönetici Adayı Öğretmenlerin Kişisel Zaman Yönetimi Davranışları.Fırat Üniversitesi Sosyal Bilimler Dergisi, 13(2): 203-210.
14. Karaoğlu B, 2015. Erciyes Üniversitesi Beden Eğitimi Spor Yüksekokulu Öğrencilerinin Zaman Yönetimi Davranışlarının Farklı Değişkenler Açısından İncelenmesi. Yüksek Lisans Tezi, Erciyes Üniversitesi/Sağlık Bilimleri Enstitüsü Kayseri.
15. Lens W, Tsuzuki M, 2005. The Role of Motivation and Future Time Perspective İn Educational and Career Development. The International Conference on Careers İn Context New Challenges and Tasks for Guidance and Counseling Lisbon Portugal.
16. Mackenzie RA, 2001.Zaman Tuzağı. Yakut Güneri (Çev), İlgi Yayınevi, İstanbul 17. Özer A, 2010. Verimli Örgüt Yönetimi İçin Zaman Yönetimi. Çimento İşveren
Dergisi 24(1): 16-35.
18. Türkel S, Leblebici DN, 2001. Etkili Zaman Yönetimi ve Uygulaması,Ankara Genç işadamları Derneği Yayın Evi, Ankara
19. Tektaş M, Tektaş N, 2010. Meslek yüksekokulu öğrencilerinin zaman yönetimi ve akademik başarıları arasındaki ilişki. Selçuk Üniversitesi/Sosyal Bilimler Enstitüsü Dergisi 23:222-229.
20. Uğur A, 2000. Çalışma Hayatında Zaman Yönetimi. MPM Kalkınmada Anahtar Verimlilik Dergisi 12(143):18–22.
21. Zorba E, Cerit A, Gümüşdağ H, Evli M, 2013. Rekreasyon bölümlerinin tercih edilme nedenleri ve bölüm öğrencilerinin beklentilerinin araştırılması. Uluslararası Hakemli Akademik Spor Sağlık ve Tıp Bilimleri Dergisi 8(3): 1-15.
Appendix
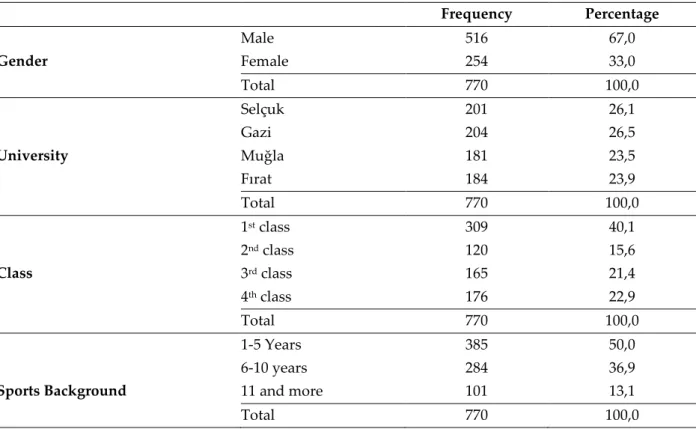
Table 1: Socio-Demographic Characteristics of Participants
Frequency Percentage Male 516 67,0 Gender Female 254 33,0 Total 770 100,0 Selçuk 201 26,1 Gazi 204 26,5 University Muğla 181 23,5 Fırat 184 23,9 Total 770 100,0 1st class 309 40,1 2nd class 120 15,6 Class 3rd class 165 21,4 4th class 176 22,9 Total 770 100,0 1-5 Years 385 50,0 6-10 years 284 36,9
Sports Background 11 and more 101 13,1
Total 770 100,0
For Table 1, when the genders of the volunteers participating in the study are examined; 26.1% are from Selçuk University, 26.5% are from Gazi University, 23.5% are from Muğla Sıtkı Koçman University and 23.9% are from Fırat University. 40.1% of the volunteers are in the 1st grade, 15.6% of them are in the 2nd grade, 21.4% of them are in the 3rd grade and 22.9% of them are in the 4th grade, 50% of the participant volunteers have 5 years sports history, 36.9% of them have 6-10 years sports history and 13.1% of them have 11 years and more sports history.
Table 2: Skewness-kurtosis values of scores and Kolmogorov-Smirnov
test significance level results
N Skewness Kurtosis P
Connectedness 770 -1,665 1,734 ,000
Value 770 -1,899 1,578 ,000
Speed 770 -1,832 1,525 ,000
Extension 770 1,555 2-,233 ,000
Sum of future time perception 770 1,564 -2,044 ,001
Time Planning 770 -2,027 -1,654 ,000
Time Attitudes 770 -2,066 1,497 ,000
Time Traps 770 -1,735 1,548 ,000
When we look at the results of the test in Table 2, it is observed that there is a deviation from the normality in the total score and subscales of the time management behavior in the total score and subscales of the future time sense. The application of the K-S test is only one of the methods used for examining the normality situation. Looking at the normal distribution curves, it seems that there is a deviation from normality. Furthermore, when the coefficients of skewness and Kurtosis are taken into consideration, it is determined that not all the scores are within the range of ± 1.5. It has been decided that nonparametric statistical techniques should be used because it is seen that deviations in normal distribution curves are observed.
Table 3: Descriptive Statistics of Participants' Answers to Scales
N Min Max X±Sd
Future time perception
Connectedness 770 23,00 60,00 46,42±8,28
Value 770 11,00 35,00 22,91±3,95
Speed 770 3,00 15,00 10,02±2,67
Extension 770 5,00 25,00 15,67±3,38
Sum of future time perception 770 55,00 123,00 95,02±12,03
Time management
Time Planning 770 20,00 76,00 46,48±9,56 Time Attitudes 770 9,00 35,00 20,29±4,39 Time Traps 770 4,00 20,00 13,10±3,44 Sum of Time Management 770 39,00 122,00 79,87±12,27
When Table 3 is examined, the future time perception scale of the volunteers participating in the study is 46,42 ± 8,28 for the connectedness subscale score, 22,91 ± 3,95 for the value subscale score, 10,02 ± 2,67 for the speed subscale score, 15,67 ± 3,38 and the future time sense total score is 95,02 ± 12,03. When the time management scale subscale scores are examined; ıt is seen that the time dimension score is 46,48 ± 9,56, the time attitude dimension score is 20,29 ± 4,39, the time trap dimension score is 13,10 ± 3,44 and the time management total score is 79,87 ± 12,27.
Table 4: Time Perception Level Analysis by Gender of Participants
Gender n median min max Z p Connectedness Dimension Male 516 46,00 23,00 66,00 -3,334 ,001
Female 254 50,00 28,00 66,00
Value Dimension Male 516 23,00 13,00 35,00 -,959 ,338 Female 254 23,00 11,00 32,00
Speed Dimension Male 516 10,00 3,00 15,00 -2,196 ,028 Female 254 10,00 3,00 15,00
Extension Dimension Male 516 16,00 5,00 25,00 -,564 ,573 Female 254 16,00 6,00 24,00
Sum of future time perception Male 516 94,00 55,00 123,00 -2,688 ,007 Female 254 97,00 68,00 123,00
When Table 4 is examined, In the dimension of connectedness men's score is 46 and women’s is 50; the score of men in the value dimension is 23 and women’s is 23; the score of the men in the speed dimension is 10 and women’s is 10; the men's score 16 in extension dimension and women’s is 16; the total score of future time perception is 94 for males and 97 for females. As a result of the statistical analyses made, there was a significant difference in connectedness dimension (p <0, 05).
Table 5: Time Management Behavior Analysis by Gender of Participants
Gender n median min max Z p Time Planning Erkek 516 47,00 20,00 76,00 -3,024 ,002
Kadın 254 45,00 26,00 75,00
Time Attitudes Erkek 516 21,00 10,00 35,00 -3,084 ,002 Kadın 254 20,00 9,00 33,00
Time Traps Erkek 516 12,00 4,00 20,00 -5,842 ,000 Kadın 254 14,00 4,00 20,00
Sum of Time Management Erkek 516 79,00 39,00 122,00 -1,669 ,095 Kadın 254 79,00 53,00 117,00
When Table 5 is examined; men's time planning dimension score is 47, women’s is 45; the time scale of men's score is 21, and women's score is 20; time traps of men in the size of 12, 14 of women; it is seen that the total score of men and women is time management 79. As a result of the statistical analysis, significant differences were found in the dimensions of time planning, time attitude dimension and time traps (p <0, 05).
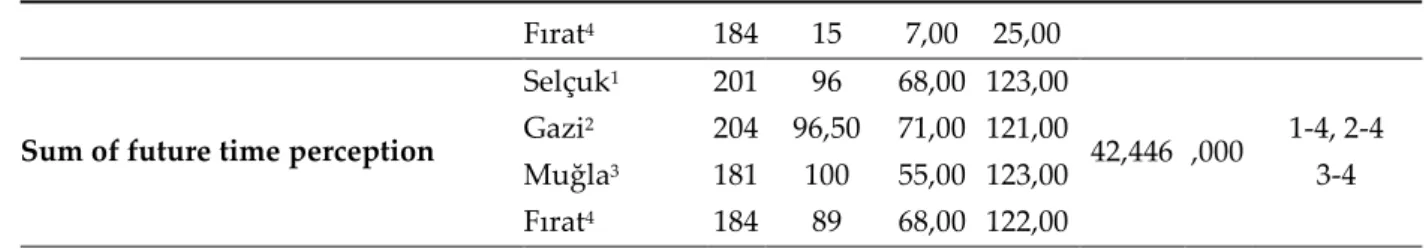
Table 6: Participants' Time Perception Level Analysis by Universities
University n median min max X2 P difference
Connectedness Dimension Selçuk1 201 48 28,00 60,00 43,220 ,000 1-3, 1-4 2-4, 3-4 Gazi2 204 48 29,00 60,00 Muğla3 181 51 23,00 60,00 Fırat4 184 42 28,00 60,00 Value Dimension Selçuk1 201 23 14,00 32,00 3,930 ,269 - Gazi2 204 23 13,00 32,00 Muğla3 181 23 11,00 35,00 Fırat4 184 23 13,00 34,00 Speed Dimension Selçuk1 201 10 3,00 15,00 26,405 ,000 1-3, 2-4 3-4 Gazi2 204 10 4,00 15,00 Muğla3 181 11 4,00 15,00 Fırat4 184 9 3,00 15,00 Extension Dimension Selçuk1 201 16 8,00 24,00 19,415 ,000 1-4, 2-4 Gazi2 204 17 5,00 24,00 Muğla3 181 15 5,00 24,00
Fırat4 184 15 7,00 25,00
Sum of future time perception
Selçuk1 201 96 68,00 123,00 42,446 ,000 1-4, 2-4 3-4 Gazi2 204 96,50 71,00 121,00 Muğla3 181 100 55,00 123,00 Fırat4 184 89 68,00 122,00
In Table 6, when the participants' perceptions of future time according to university variables are examined, the highest score in the dimension of connectedness is 51 with Muğla Sıtkı Koçman University and the lowest score is 42 with Firat University; when the value dimension is examined, the scores are the same; when the speed dimension is examined, the highest score is 11 with Muğla Sıtkı Koçman University and the lowest score is 9 with Fırat University; when the extension dimension is examined, the highest score belongs to Gazi University and the lowest score belongs to Muğla and Fırat University with 17; when the future time sense total score is examined, it is seen that the highest score belongs to Muğla Sıtkı Koçman University with 100 and Selcuk University with the lowest score 96. There was a statistically significant difference between connectedness dimension, speed dimension, extension dimension and future time sense total score (p <0.05).
Table 7: Time Management Behavior Analysis of Participants by Universities
University n median min max X2 P difference
Time Planning Selçuk1 201 45,00 23,00 73,00 31,630 ,000 1-3, 1-4, 2-3, 2-4, Gazi2 204 44,50 20,00 72,00 Muğla3 181 48,00 27,00 76,00 Fırat4 184 48,00 23,00 73,00 Time Attitudes Selçuk1 201 19,00 9,00 31,00 52,373 ,000 1-2, 1-3 1-4 Gazi2 204 21,00 11,00 30,00 Muğla3 181 21,00 10,00 35,00 Fırat4 184 21,00 14,00 28,00 Time Traps Selçuk1 201 14,00 4,00 20,00 46,904 ,000 1-2, 1-4 3-4 Gazi2 204 12,50 4,00 20,00 Muğla3 181 14,00 4,00 20,00 Fırat4 184 12,00 4,00 19,00
Sum of future time perception
Selçuk1 201 79,00 39,00 114,00 26,166 ,000 1-3, 1-4 2-3, 2-4 Gazi2 204 77,00 50,00 121,00 Muğla3 181 82,00 54,00 122,00 Fırat4 184 81,00 56,00 116,00
In Table 7, when the participants' time management behaviors were examined according to the university variable, the highest score in the dimension of time planning belongs to Muğla Sıtkı Koçman and Fırat University and the lowest score belongs to
Gazi University with 44.50; It is seen that the time management behaviors belong to Muğla Sıtkı Koçman University with the highest score 82 in the total score and Gazi University with the lowest score 77. As a result of statistical analysis, significant differences were found in a total dimension of time planning, time attitudes, time traps and time management behaviors (p <0.001).
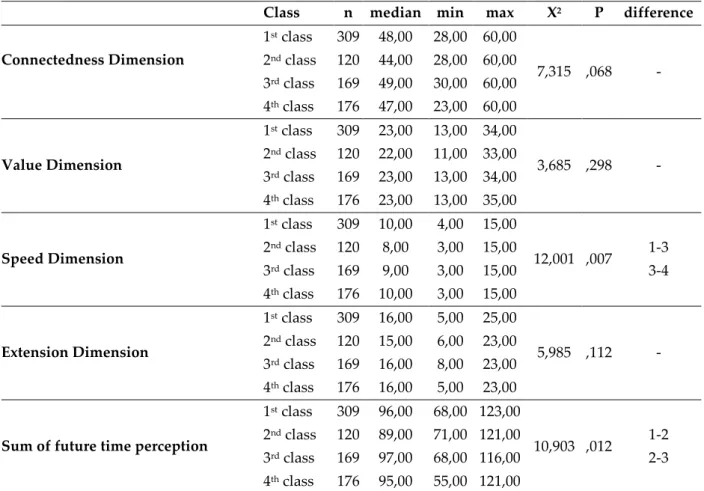
Table 8: Future Time Perception Level of Participants by Class Levels
Class n median min max X2 P difference
Connectedness Dimension 1st class 309 48,00 28,00 60,00 7,315 ,068 - 2nd class 120 44,00 28,00 60,00 3rd class 169 49,00 30,00 60,00 4th class 176 47,00 23,00 60,00 Value Dimension 1st class 309 23,00 13,00 34,00 3,685 ,298 - 2nd class 120 22,00 11,00 33,00 3rd class 169 23,00 13,00 34,00 4th class 176 23,00 13,00 35,00 Speed Dimension 1st class 309 10,00 4,00 15,00 12,001 ,007 1-3 3-4 2nd class 120 8,00 3,00 15,00 3rd class 169 9,00 3,00 15,00 4th class 176 10,00 3,00 15,00 Extension Dimension 1st class 309 16,00 5,00 25,00 5,985 ,112 - 2nd class 120 15,00 6,00 23,00 3rd class 169 16,00 8,00 23,00 4th class 176 16,00 5,00 23,00
Sum of future time perception
1st class 309 96,00 68,00 123,00 10,903 ,012 1-2 2-3 2nd class 120 89,00 71,00 121,00 3rd class 169 97,00 68,00 116,00 4th class 176 95,00 55,00 121,00
In Table 8, when the participants' perception level of future time according to the class variable is examined, it is seen that the highest score in the future time perception total score belongs to the 3rd grade with 97 and the lowest score belongs to the 95th grade with the 4th grade. A statistically significant difference was found between the speed dimension and the future time perception total score (p <0.05).
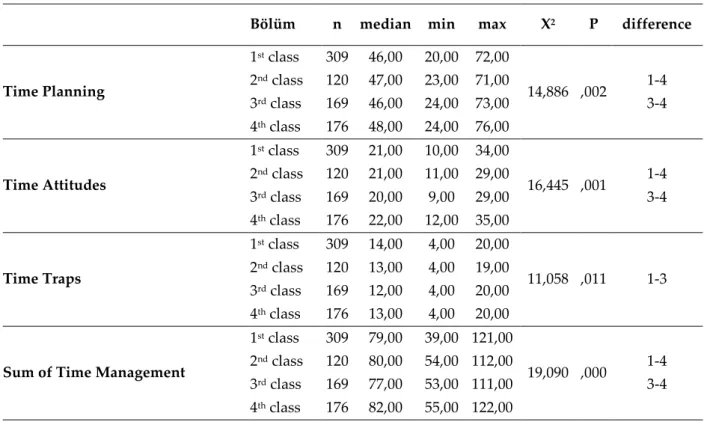
Table 9: Time Management Behavior Analysis by Participants' Class
Bölüm n median min max X2 P difference
Time Planning 1st class 309 46,00 20,00 72,00 14,886 ,002 1-4 3-4 2nd class 120 47,00 23,00 71,00 3rd class 169 46,00 24,00 73,00 4th class 176 48,00 24,00 76,00 Time Attitudes 1st class 309 21,00 10,00 34,00 16,445 ,001 1-4 3-4 2nd class 120 21,00 11,00 29,00 3rd class 169 20,00 9,00 29,00 4th class 176 22,00 12,00 35,00 Time Traps 1st class 309 14,00 4,00 20,00 11,058 ,011 1-3 2nd class 120 13,00 4,00 19,00 3rd class 169 12,00 4,00 20,00 4th class 176 13,00 4,00 20,00
Sum of Time Management
1st class 309 79,00 39,00 121,00 19,090 ,000 1-4 3-4 2nd class 120 80,00 54,00 112,00 3rd class 169 77,00 53,00 111,00 4th class 176 82,00 55,00 122,00
In Table 9, when the participants' time management behaviors were examined according to the class variable, the highest score in the time planning dimension was 48th to 4th grade, the lowest score was 46th and 1st and 3rd grade; when the time attitude dimension is examined, the highest score belongs to 22nd to 4th grade, the lowest score belongs to 20th to 3rd grade; when the time traps dimension was examined, the highest score belonged to 14th grade and the lowest score to 12th and 3rd grade; time management behaviors, the highest score is 82 and the lowest score is 77 and the third is the third. As a result of the statistical analysis, a significant difference was found in the total score of time planning, time attitudes, time traps and time management behaviors (p <0.001, p <0.05).
Table 10: The Correlation between Participants' Perception of Future Time and
Time Management Behavior
1 2
Sum of future time perception
r 1
p -
n 770
Sum of Time Management
r ,118** 1
p ,001 -
When the Correlation between the future time perception and the time management behavior is examined, there was a very positive correlation between future time perception and time management behavior (r =, 118, p =, 001).
Creative Commons licensing terms
Authors will retain the copyright of their published articles agreeing that a Creative Commons Attribution 4.0 International License (CC BY 4.0) terms will be applied to their work. Under the terms of this license, no permission is required from the author(s) or publisher for members of the community to copy, distribute, transmit or adapt the article content, providing a proper, prominent and unambiguous attribution to the authors in a manner that makes clear that the materials are being reused under permission of a Creative Commons License. Views, opinions and conclusions expressed in this research article are views, opinions and conclusions of the author(s). Open Access Publishing Group and European Journal of Physical Education and Sport Science shall not be responsible or answerable for any loss, damage or liability caused in relation to/arising out of conflict of interests, copyright violations and inappropriate or inaccurate use of any kind content related or integrated on the research work. All the published works are meeting the Open Access Publishing requirements and can be freely accessed, shared, modified, distributed and used in educational, commercial and