DESIGNING A NEURAL NETWORK MODEL USING K-MEANS
CLUSTERING FOR RISK ANALYSIS OF LUNG CANCER DISEASE
Umut KAYA
*Atınç YILMAZ
Ediz ŞAYKOL
Computer Technologies Department, İzmir Kavram Vocational College,
Istanbul, Turkey [email protected]
Faculty of Engineering, Department of Computer Engineering Beykent
University, Turkey [email protected]
Faculty of Engineering, Department of Computer Engineering Beykent
University, Turkey [email protected] Received: 01st June 2018 Accepted: 07th July 2018
ABSTRACT
According to the World Health Organization report in 2004, lung cancer belongs to highest mortality rate cancer type compared to others. Genetics and early starting smoke etc. become the basis for lung cancer risk. In recent years, lung cancer cases are increasing with the use of cigarettes at younger ages. One of the most important factor in the treatment of the disease is early diagnosis. Artificial intelligence methods, which have been used in many areas in recent years, are also used for early diagnosis and imaging of diseases. In this study, a hybrid artificial neural network (ANN) model was designed to bring a different perspective to the use of multilayer ANN in the literature for lung cancer risk prediction. Lung cancer risk factors were used as input data in predicting the disease. We tried to estimate the results using clustered data by K-means clustering algorithm and multi-layered ANN method. When the results obtained from the normalized and clustered data set are compared with the results in the literature, the proposed model has a higher accuracy value than the other methods.
Keywords: ANN, K-means Clustering, Lung Cancer Risk Analysis.
AKCİĞER KANSERİ RİSKİ ANALİZİ İÇİN K-ORTALAMA KÜMELENMESİ KULLANAN YAPAY SİNİR AĞ MODELİ TASARIMI
ÖZET
Dünya sağlık örgütünün 2004 yılındaki raporuna göre akciğer kanseri diğer kanser türlerine göre ölüm oranı en fazla olan kanser türüdür. Genç yaşta sigara kullanımına başlanması ve genetik yatkınlık gibi faktörler akciğer kanseri riskine zemin hazırlamaktadır. Son yıllarda artan küçük yaşlarda sigara kullanımıyla akciğer kanseri vakalarında artış yaşanmıştır. Hastalığın tedavisinde en önemli etken erken tanıdır. Son yıllarda bir çok alanda kullanılmaya başlanan yapay zeka yöntemleri de hastalıkların görüntülenmesi ve erken tanısında kullanılmaktadır. Bu çalışmada literatürde akciğer kanseri risk tahmini için çok katmanlı Yapay sinir ağı (ysa) kullanımına farklı bir bakış açısı getirmek için hibrit bir ysa modeli tasarlanmıştır. Akciğer kanseri risk faktörleri hastalığın tahmininde girdi verileri olarak kullanılmıştır. K-ortalamalar kümeleme algoritması ile gruplandırılan veriler ile çok katmanlı Yapay Sinir Ağları (YSA) yöntemi kullanılarak sonuçlar tahmin edilmeye çalışılmıştır. Normalize edilerek kümelenen veri setinden elde edilen sonuçlar literatürdeki sonuçlarla karşılaştırıldığında önerilen yöntemin diğer literatürdeki yöntemlere göre daha yüksek doğruluk değerine ulaştığı gözlemlenmiştir.
Anahtar Kelimeler: YSA, K-Ortalama Kümeleme, Akciğer Kanseri Risk Analizi.
1. INTRODUCTION
As the World Health Organization 2004 report stated, lung cancer disease is one of the most morbid diseases, and any model for effective predictions in early diagnosis may help reduce the loss of patients [1]. Mainly, the main factors are exposure to tobacco, genetics, and air pollution, radiation, breathing chemical materials, life quality and nutritional habits. Existing studies about the early diagnosis of the lung cancer show that pre-diagnosis increases the success of treatment [2, 3], as expected. Hence, predictive modelling and risk analysis of lung cancer with using a set of personal data is crucial, and there exist techniques based on fuzzy logic and artificial neural networks (ANN), as we argued in [4, 5]. Ganesan et al. applied artificial neural network for cancer diagnosis by using demographic data [6] and attained over 87% validation results in conclusion. Ashwin et al. proposed to detect lung cancer nodule in images with using ANN for cad diagnosis system [7]. Contrast limited adaptive histogram equalization work was experted trained medical diagnosis with modified Broyden-Fletcher-Goldfarb-Shanno (BFGS) accuracy 96.7%, sensitivity 92.1% and specificity 94.3%. Feng et. al. used ANN model with forward-looking architecture that distinguishes lung cancer from benign lung disease and healthy humans. The probability table interpreted the results with sensitivity, specificity and accuracy analyzes [8]. Using k-means clustering along with ANN is a typical improvement, and there are several studies in various domains presenting the joint use of ANN and k-means clustering (e.g., [9, 10, 11, 12]). To elaborate on further, Tsai et. al. developed three different prediction models focusing on the comparison of various machine learning techniques in order to reveal a more accurate assessment and estimation model for valuing intangible assets [12]. In their model, they presented experimental results showing the use of k-means clustering along with classifiers, hybrid model they say, improves the prediction accuracy over 90%. Hence, they claimed that derived variables in the original data set are the most critical factors in the creation of the intangible asset valuation model and the use of hybrid classifiers are more suitable for assessing intangible assets.
Similarly, in [4], we provided multi-layered ANN models to evaluate the risks of lung cancer via
utilizing four different learning algorithms. Here, we would like to provide the results of utilizing k-means in our ANN models. Hence, the main contribution of this study is to provide effective setups for this crucial prediction for human health employing ANNs using k-means clustering. The remainder of the paper is organized as follows: Section 2 provides the detailed explanations on our methodology here, Section 3 gives the experimental evaluations and finally, Section 4 concludes the paper.
2. HYBRID METHODOLOGY: USING ANN WITH K-MEANS
In this study, we used personal data based on 616 people, as in [4], which consists of age, smoking, genetics, environment and skin color parameters. Table 1 provides explanations of these parameters. The age parameter, which is the age of onset of cigarette smoking, has a vital prognostic point as early initiation of cigarette smoking and the prolonged use of cigarettes increase the risk of lung cancer.
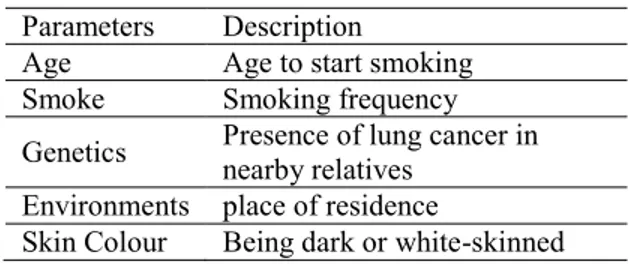
Table 1. Lung cancer risk input parameters that make up the data set.
Parameters Description
Age Age to start smoking Smoke Smoking frequency Genetics Presence of lung cancer in nearby relatives Environments place of residence
Skin Colour Being dark or white-skinned
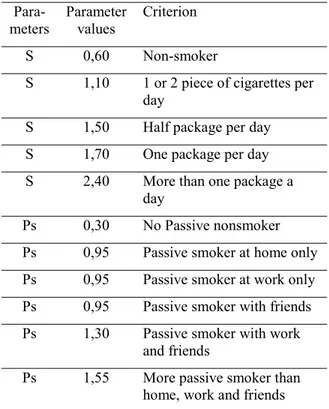
The cigarette attribute is calculated by using the parameters of smoking and passive smoking in following method:
(1) Here, C represents the cigarettes, U is the usage, Ps is the passive smoking, Ra is the real age and A means the Age. To determine the cigarette attribute, the values of smoking and passive smoking were given in Table 2. Parameter values were determined by formulating the questionnaire based on expert opinion. Ps means the Passive smoker parameter and
Table 2. Values used in the calculation of the cigarette parameter.
Para-meters Parameter values Criterion
S 0,60 Non-smoker
S 1,10 1 or 2 piece of cigarettes per day
S 1,50 Half package per day S 1,70 One package per day S 2,40 More than one package a
day
Ps 0,30 No Passive nonsmoker Ps 0,95 Passive smoker at home only Ps 0,95 Passive smoker at work only Ps 0,95 Passive smoker with friends Ps 1,30 Passive smoker with work
and friends
Ps 1,55 More passive smoker than home, work and friends
The values used in the calculation of the genetic characteristic are given in Table 3.
Table 3. Values used in the calculation of the genetic parameter.
Para-meters Parameter value Criterion genetics 0,00 not known for lung
cancer unknown in relatives genetics 1,70 parent, brother, sister
diagnosed with lung cancer genetics 1,30 Aunt, uncle's lung
cancer diagnosed genetics 1,30 grandfather,
grandmother lung cancer diagnosed genetics 1,10 cousin or distant
relatives diagnosed with lung cancer
genetics 0,65 unknown
The environmental attribute is calculated by the following method, which calculates the nutrition score via a questionnaire:
(2) Here, E represents the environment, O is the occupation, Le is the living environment, Ses is the socio-economic status and N is the nutrition.
Environment parameter is composed of expert opinion and sum of survey data from 4 different parameters. The nutrition parameter is one of the parameters that make up the Environment parameter. The parameter values of occupation, living environment and socio-economic status are determined according to the criteria in Table 4.
Table 4. Criteria and values that determine occupation, living environment and socio-economic
status parameters. Parameters Parameter value Criterion O 0,25 Desk clerk O 1,55 worker O 1,20 Factory worker
Le 0,30 House with a garden
Le 0,50 garden apartment
Le 1,00 town center
Le 1,50 close to the factory
Ses 0,60 Very good
Ses 1,00 good
Ses 1,50 middle
Ses 1,90 bad
Ses 2,40 Very bad
Skin color feature is composed of 5 different classifications between brown and white skin and it is seen in Table 5.
Table 5. The criteria that make up the skin-color parameter.
Parameters Parameter value Criterion Skin Color 100-80 Brown Skin Color 80-60 A little brown Skin Color 60-40 Less brunette Skin Color 40-20 A little white Skin Color 20-0 White skinned
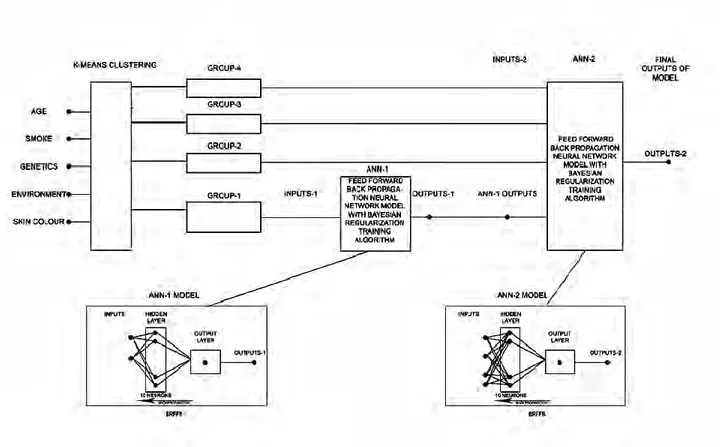
Figure 1. Hybrid ANN model generated using the K-averages clustering algorithm. After calculation, the criteria result in output values
shown in Table 6.
Table 6. Criteria used in determining output values. Parameters Parameter
value Criterion
Output 1 healthy
Output 2 risky
Output 3 sick
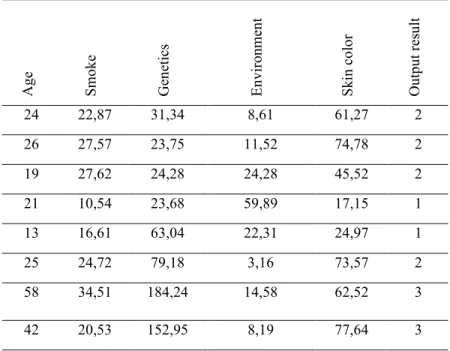
The sample dataset according to the parameters mentioned above is shown in Table 7. These values were obtained by rating of the items in the questionnaire prepared by expert opinion. (e.g. the user's choice of point value for the frequency of cigarette smoking, the value of user’s choice of cigarette smoking, etc.)
Table 7. Sample data set for the model consisting of inputs and outputs. Ag e Sm ok e Gen etics En vir on m en t Sk in co lo r Ou tp ut r esu lt 24 22,87 31,34 8,61 61,27 2 26 27,57 23,75 11,52 74,78 2 19 27,62 24,28 24,28 45,52 2 21 10,54 23,68 59,89 17,15 1 13 16,61 63,04 22,31 24,97 1 25 24,72 79,18 3,16 73,57 2 58 34,51 184,24 14,58 62,52 3 42 20,53 152,95 8,19 77,64 3
The values given in Table 7 are the result of the data set model that will be used as input to the learning rate and accuracy performance of the ANN model. Thus, in order not to have duplicates in the data set and to have a homogeneous data set model, the data were first normalized in Matlab environment. Table 8 shows the sample data set of normalized input data.
Table 8. Normalized input data.
Age Smoke Genetics Environment Skin Color 0,016585 0,007904 0,010824 0,003112 0,005559 0,016585 0,008719 0,015825 0,003 0,026526 0,027641 0,007976 0,015901 0,021449 0,019017 0,021007 0,009848 0,013616 0,023858 0,041134 0,02543 0,009219 0,026189 0,009648 0,009912 0,022113 0,001258 0,027024 0,0059 0,038194 0,01769 0,005932 0,022875 0,025922 0,016481 0,027641 0,010363 0,024907 0,021806 0,032879 0,015479 0,019911 0,01327 0,014032 0,01715 0,030958 0,013836 0,003104 0,015905 0,032963 0,024324 0,019596 0,019485 0,022743 0,018745 0,01769 0,017938 0,002091 0,021549 0,031423 0,015479 0,01941 0,024996 0,00976 0,012344
Our hybrid ANN model using k-means clustering is shown in Figure 1. Age, smoking, genetic, environment and skin color are the input parameters of the model and k-means algorithm applies to them for grouping. The parameters in the first group are trained in artificial neural network which is feed forward back propagation with Bayes regulated training algorithm consisting of 10 neurons in hidden layer. The output obtained as a result of these trained parameters is taught to the network together with other groups to give lung cancer risk results in the artificial neural network which is feed forward back propagation with Bayes regulated training algorithm consisting of 10 neurons in hidden layer.
The purpose of using the k-means algorithm is to understand the relationship between the data and obtain a better cancer risk outcome by avoiding data duplication. The variables in the first group used in the first artificial neural network were chosen to obtain better, more accurate and more generalizable results by obtaining more effective parameters for the second ANN. The normalized k-means are grouped by the clustering algorithm, and the clustering result is shown in Table 9. The data are divided into 4 clusters giving the best cluster result.
Table 9. Groups of input data generated by clustering. Groups Inputs 1 Age 4 Smoke 1 Genetics 2 Environment 3 Skin Color
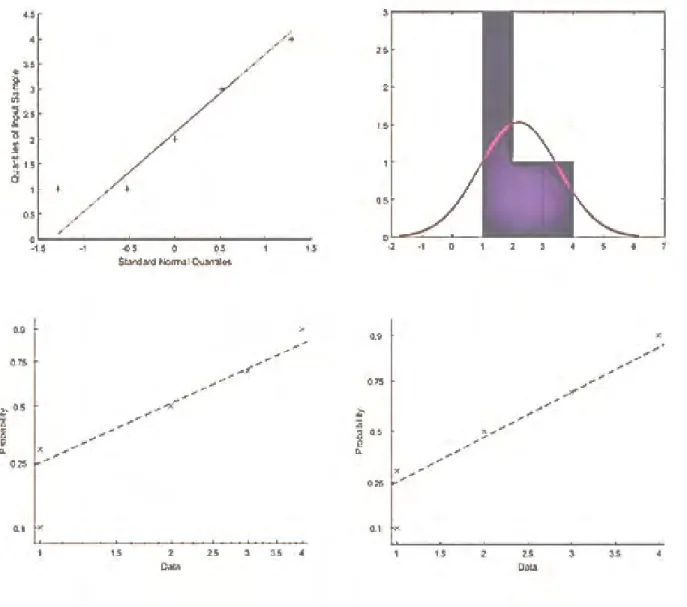
Figure 2 shows the graphs of the centers and data groups of the input data that are generated by the clustering result.
Age and genetic predisposition of the 1st cycle constitute the inputs of the first ANN model. With the output of the first flood model applied, it was tried to obtain the best input formation which will be most suitable for the optimum and second flood model which will affect the general result and which will increase the predicted accuracy performance. The regression graphs of the first ANN model are shown in Figure 3.
Figure 3. Regression graphs of the first ANN model. Applying the first ANN model to age and genetic
susceptibility inputs resulted in the output obtained as inputs to the second ANN model along with the data in the second, third and fourth groups. Figure 4 shows the structure of the second ANN model. It has four input, one hidden layer, one output layer and one output. 10 neurons are in hidden layer and 1 neuron is in output layer. Both hidden layer and output layer have bias threshold (b), weights (w) and tangent
Figure 5. The graph of the second ANN training performance.
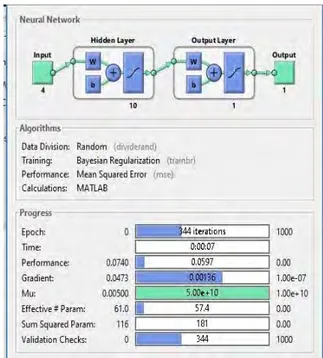
The graph of the second ANN performance is shown in Figure 5. It explains the Mean Squared Error of the train, validation and test performance at epochs. Best validation performance is 0.099927 at epoch 0. The training phase of the second ANN model is shown in Figure 6. Accordingly, 344 epoch models in 7 seconds achieved the minimum error performance which is 0.0597 to 0.0740. The gradient performance is 0.00136 to 0.0473. It has also reached 0.005 of mu value. Effective parameters have 57.4 to 61.0 and Sum Squared Parameters performance is 181 to 116.
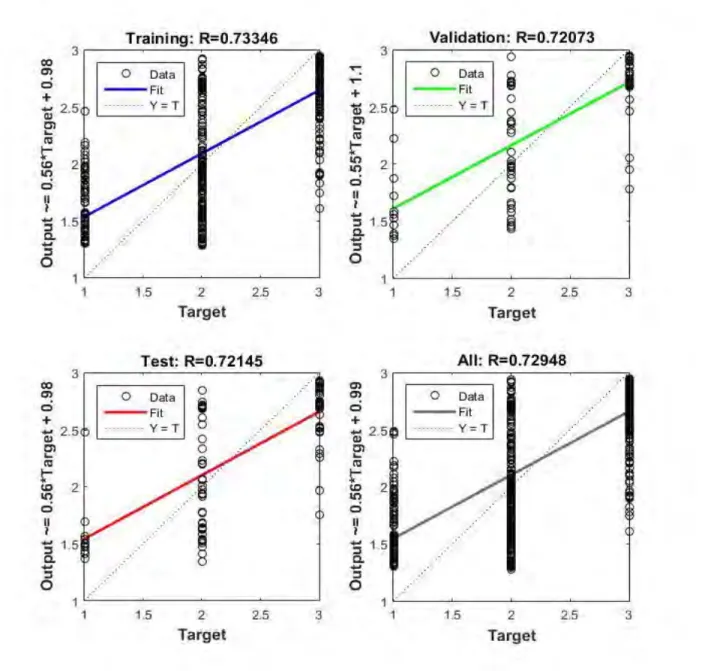
Figure 6. The training phase of the second ANN. Figure 7 shows the regression graphs of the second ANN model. It means that the second ANN model has 0.92 training, 0.928 test and 0.90 validation performance value at epoch 344.
A comparison graph of the outputs of the second ANN model and the actual output is shown in Figure 8.
Figure 8. Comparison graph of ANN output (*) and
actual output values (+).
Figure 9 shows a graph of the output errors of the ANN model. It is seen that the error values are concentrated between -0.5 and 0.5 in the Figure 9. It means our model has acceptable error values and they have the meaningful relationship between them. Also Figure 10 shows the box graph of the ANN model output errors. The error values in the box graph in Figure 10 are between 0.5 and 1, and between -0.5 and -1. This explains that the error sum value is 48.1823 positive.
Figure 9. Error graph of ANN output (+).
Figure 10. ANN output error box graph. The training level values of the ANN model, which has performance, gradient and mu value at 344 in 7 seconds, are shown in Table 10.
Table 10. The training values of the ANN model.
Model Brffb Epoch 344 Time 00:07 Performance(0.0740) 0.0597 Gradient(0.0473) 0.00136 Mu(0.00100) 5.00e+10 Validation checks 344 Effective Param (61.0) 57.4 Sum Squared Param (116) 181
Table 11 presents the results (R values) of training, test and accuracy values of the model, and Table 12 shows the performances of MSE, RMSE, SSE error values of the model. It is seen that our model has 0.9203 training, 0.92889 test and 0.90089 validation performance value at epoch 344.
Table 11. ANN model training, test and accuracy (R values) percentages.
model training test validation total brffb 0.9203 0.92889 0.90089 0.91876
Table 12. The performances of MSE, RMSE, SSE error values of the model.
model mse rmse sse
3. RESULTS
In this study, we constructed a hybrid prediction model with a forward feed back-propagation multilayer artificial neural network model with Bayes Regulation training (bayes1ffb) using the data sets in [4, 5]. We normalized the data in our cancer data set according to the hybrid model in Figure 1. We grouped the data by applying the k-means clustering algorithm to the normalized data. We obtained the best clustering result with 4 different cluster groups. From the clusters obtained, age and genetic parameters in group 1 are recorded. Using the model they used in the study they were doing. Outputs generated by first ANN were used as input parameters for our second ANN model. We gave the name of brffb to the second ANN model. We constructed the input data of this model by using the output parameters of the second group in the clustering result group in Table 9, the skin color in the third group, the cigarette parameters in the fourth group and the output result of the first ANN model, ANN-1. Our model is trained with Bayesian regulation algorithm. As the learning algorithm, we used gradient descent method (GDM) which is known to be effective in literature. The training, test, accuracy and total performance values of the Brffb
ANN model are shown in Table 11. The comparison of the results in [4] and our hybrid model is given in Table 13.
Table 13. Hybrid model brffb and Kaya et. al. [4] Comparison of test, training, and total performance
values of the ANN models.
Model Test Training Total
brffb 0.92889 0.9203 0.91876 bayes1ffb 0.92477 0.91802 0.91926 bayes2cfb 0.91123 0.91855 0.91709 lm1ffb 0.82453 0.90755 0.88667 lm2cfb 0.892 0.89412 0.88234 According to the results in Table 13, our second model we used in our hybrid model is Kaya et al. [4], and the total performance difference is 0.0005. In addition, it was found that the training, test, and truth-value performances obtained when the initial input parameters in the data set were trained without clustering using the BayesffB ANN model were lower than those of the hybrid model. Figure 11 shows the training, test and simulation results in the Bayes regression model without the normalization and clustering algorithm.
As can be seen from the studies done in the literature, it has been tried to reduce the data repetition by grouping similar data with the model created by using the K-means clustering algorithm. Besides, it has been tried to increase the correctness of the local optimal values and general outcome values obtained by clustering. The hybrid model we use can be used to predict lung cancer risk in terms of accuracy and performance as seen in Table 13.
4. CONCLUSION
Applying the K-means clustering algorithm to the ANN model provides us to have better prediction and accuracy performance when used in conjunction with machine learning algorithms. We have both same ANN network and training algorithm model which we used the first one for resisting the data reputation and know the relationship between the parameters and generating the effective parameters. Also, we aimed to have better inputs for second ANN which gives the lung cancer risk prediction result.
We generated the hybrid model with k-means clustering algorithm and artificial neural network with Bayesian regulation training algorithm for improving the result of using ANN solely. Our hybrid model have higher performance.
In our future work we aim to generate different hybrid model which has different machine learning technique to achive the better lung cancer prediction using large and different data sets.
5. REFERENCES
[1] M.G. Alvarez, C.B. Pelayo, “Molecular basis of cancer and clinical applications”, Surgical Clinics of North America, Sciencedirect, vol.80, issue 2, pp. 443–457, 2000.
[2] V. Gant, S. Rodway, J. Wyatt, “Artificial neural networks: Practical considerations for clinical applications”, Clinical Applications of Artificial Neural Networks, pp. 329–356, 2001.
[3] P. Lisboa, A. Taktak, “The use of artificial neural networks in decision sup- port in cancer: A Systematic review”, Neural Networks, vol. 19, Issue 4, pp. 408–415, 2006.
[4] U. Kaya, A. Yılmaz, E. Saykol, “Designing Multi-layered Artificial Neural Networks for Risk Analysis of Lung Cancer Disease”, Proc. of the 5th
International Symposium on Innovative Technologies in Engineering and Science, Baku, Azerbaijan, September 2017.
[5] A. Yılmaz, K. Ayan, “Cancer risk analysis by using fuzzy logic approach and performance status of the model”, Turkish Journal of Electrical Engineering and Computer Science, vol. 21, Issue 3, pp. 897–912, 2013.
[6] N. Ganesan, K. Venkatesh, M. Rama, A. Palani, “Application of neural networks in diagnosing cancer disease using demographic data”, International Journal of Computer Applications, vol. 1, no. 26, pp. 76–85, 2010.
[7] S. Ashwin, J. Ramesh, S. Kumar, K. Gunavathi, “Efficient and reliable lung nodule detection using a neural network-based computer aided diagnosis system”, Proceedings of the International Conference on Emerging Trends in Electrical Engineering and Energy Management (ICETEEEM 2012), pp. 135– 142, 2012.
[8] Feng F, Wu Y, Wu Y, “The effect of artificial neural network model combined with six tumor markers in auxiliary diagnosis of lung cancer”, J Med Syst, vol. 36, no. 5, pp. 2973-2980, 2012.
[9] M.A. Elangasinghe, N. Singhal, K.N. Dirks, J.A. Salmond, S. Samarasinghe, “Complex time series analysis of PM10 and PM2.5 for a coastal site using artificial neural network modelling and k-means clustering”, Atmospheric Environment, vol. 94, pp. 106-116, 2014.
[10] Priyardarshni, J.S. Sohal, “Improvement of Artificial Neural Network Based Character Recognition System”, Using Scilab, Optik, Volume 127, Issue 22, pp. 10510-10518, 2016.
[11] Hani K. Al-Mohair, Junita Mohamad Saleh, Shahrel Azmin Suandi, “Hybrid Human Skin Detection Using Neural Network and K-Means Clustering Technique”, Applied Soft Computing, vol. 33, pp. 337-347, 2015.
[12] Chih-Fong Tsai, Yu-Hsin Lu, Yu-Chung Hung, David C. Yen, “Intangible assets evaluation: The machine learning perspective”, Neurocomputing, vol. 175, Part A, pp. 110-120, 2016.
![Table 13. Hybrid model brffb and Kaya et. al. [4] Comparison of test, training, and total performance](https://thumb-eu.123doks.com/thumbv2/9libnet/3899646.43812/10.918.487.810.255.425/table-hybrid-model-brffb-kaya-comparison-training-performance.webp)
