PROCEEDINGS OF SPIE
SPIEDigitalLibrary.org/conference-proceedings-of-spie
Cross-term free based bistatic radar
system using sparse least squares
R. Akin Sevimli
A. Enis Cetin
Cross-term free based bistatic radar system using sparse least
squares
R. Akin Sevimli
aand A. Enis Cetin.
aa
Department of Electrical and Electronics Engineering, Bilkent University, Ankara, Turkey
ABSTRACT
Passive Bistatic Radar (PBR) systems use illuminators of opportunity, such as FM, TV, and DAB broadcasts. The most common illuminator of opportunity used in PBR systems is the FM radio stations. Single FM channel based PBR systems do not have high range resolution and may turn out to be noisy. In order to enhance the range resolution of the PBR systems algorithms using several FM channels at the same time are proposed. In standard methods, consecutive FM channels are translated to baseband as is and fed to the matched filter to compute the range-Doppler map. Multichannel FM based PBR systems have better range resolution than single channel systems. However superious sidelobe peaks occur as a side effect. In this article, we linearly predict the surveillance signal using the modulated and delayed reference signal components. We vary the modulation frequency and the delay to cover the entire range-Doppler plane. Whenever there is a target at a specific range value and Doppler value the prediction error is minimized. The cost function of the linear prediction equation has three components. The first term is the real-part of the ordinary least squares term, the second-term is the imaginary part of the least squares and the third component is the l2-norm of the prediction coefficients. Separate minimization of real and imaginary parts reduces the side lobes and decrease the noise level of the range-Doppler map. The third term enforces the sparse solution on the least squares problem. We experimentally observed that this approach is better than both the standard least squares and other sparse least squares approaches in terms of side lobes. Extensive simulation examples will be presented in the final form of the paper.
Keywords: Passive bistatic radar, correlation coefficient, least squares, side lobes, multichannel FM, CLS
1. INTRODUCTION
Passive Bistatic Radar (PBR) systems have been analyzed due to the low-cost computing power and digital receiver technology since the mid 1980s. In this work, stereo FM signals are used as transmitter of opportunity, which are designed for other purposes especially for broadcasting purposes. The target and clutter detection in PBR system is based on the evaluation of the range-Doppler map cross function called Ambiguity Function (AF). This function is a two-dimensional (2D) and can be implemented with the Fast Fourier Transform (FFT). AF is generally used to determine the similarities of two signals in the literature. Using this idea, correlation algorithms are posed on PBR systems and a novel correlation algorithm is proposed to detect targets, decrease the noise level and the number of side lobes on multichannel FM based PBR system in this work.
Specifying relationships between two variables has received interest in signal processing signal processing and science. There are many ways to do it. The most well-known function is the correlation coefficient and/or function. Correlation is a measure of similarity between two variables or two sets of data. If somebody wants to compare correlation between two variables, correlation coefficients determine how much they effect each other. There are many correlation algorithms used in signal processing applications. Correlation algorithms used in this paper are Maximal Information Coefficient (MIC), Pearson Correlation Coefficient, Spearman’s Rank Correlation Coefficient. In addition, a new method called Cross-term free Least Squares (CLS) is proposed.
Further author information: (Send correspondence to R. Akin Sevimli) R. Akin Sevimli: E-mail: [email protected]
2. AMBIGUITY FUNCTION
In radar signal processing, ambiguity function is a two-dimensional equation defined in range-Doppler plane.1, 2 The position and velocity of targets in the environment can be determined from this equation. The AF is defined as follows:
ξ[l, p] = N −1
X
i=0
ssurv[i]s∗sref[i − l]e
−j2πip
N , (1)
where ssurvand ssref represent surveillance and reference signals, respectively. N is the number of samples, l is the bistatic axis and p is the Doppler axis.
3. ALGORITHMS FOR COMPARING CORRELATION OF TWO SIGNALS
In this section, some correlation algorithms, such as maximal information coefficients (MIC),3, 4Pearson,5 Spear-man6 and a new method based on the least squares of the bistatic surveillance and reference data are applied to the PBR system.
Let us define two signals sxand sy from the surveillance signal and the reference signal as follows:
sy[n] = ssurv[n], (2)
sx,(l,p)[n] = s∗ref[n − l]e−j2πpn/N,
respectively. In Eq. 2, N is the number of the samples, l is the bistatic range bin and p is the Doppler bin. We can simply calculate the correlation between sx,(l,p)[n] and sy[n] to determine targets. When there is a target at a specific (l∗, p∗) pair, the correlation should be high compared to other (l, p) values. As can be understood from Eq. 2, sxand sysignals are complex valued signals. The correlation between real parts, srx,(l,p)[n], s
r y[n] and imaginary parts, six,(l,p)[n], siy[n] are processed separately and the magnitude of real and imaginary correlations are combined:
ξ[l, p] = q
r2
r(sx,(l,p), sy) + ri2(sx,(l,p), sy) (3) where rr(sx,(l,p), sy) is the correlation result of srx,(l,p)[n], sry[n] values and ri(sx,(l,p), sy) is the correlation result of si
x,(l,p)[n], s i
y[n] obtained using some correlation algorithms.
3.1 Cross-term Free Least Squares (CLS) Method
In this method, our aim is to compare correlation between signals sx and sy by using least squares method.7 In standard least squares approach the following distance problem is minimized:
MSE(l, p) =X n
(ssurv[n] − al,ps∗ref[n − l]e−j2πpn/N)2 (4)
Whenever there is a target at specific (l,p) pair, the magnitude |al,p| of al,pbecomes significantly larger than the other (l,p) pairs. Actually, the solution of the above LS minimization is the same as AF approach. This can be easily proved as follows: The least squares solution corresponds to the solution of
sy= al,psx,(l,p) (5) where sx,(l,p)[n] = s∗ref[n − l]e−j2πpn/N and sy[n] = ssurv[n]. Therefore,
a∗l,p=s H x,(l,p)sy k syk2
, (6)
where a∗l,p is the optimal value. Obviously, the numerator of Eq. 6 is the AF function or the matched filter solution expressing the correlation between sx,(l,p) and sy vectors. However, this suffers from cross-terms when a multichannel FM based PBR system is used.
We heuristically solve two least squares problems separating the real and imaginary parts of the original LS problem 4: min a1 k sr y− a1,(l,p)srx,(l,p)k 2 (7) and min b1 k si y− b1,(l,p)six,(l,p)k 2, (8) where sr x,(l,p), s i x,(l,p) and s r
y, siy are real and imaginary parts of sx,(l,p) and sy, respectively. Our heuristic approach is based on the idea that 7 and 8 do not contain any cross-terms. We can minimize 7 and 8 using CVX or polyfit functions of MATLAB. We define the Cross-term free Least Squares (CLS) as follows:
CLS(l, p) = a21,(l,p)+ b21,(l,p), (9) where a1,(l,p) and b1,(l,p) are optimal values for least squares problem.
4. SIMULATION RESULTS
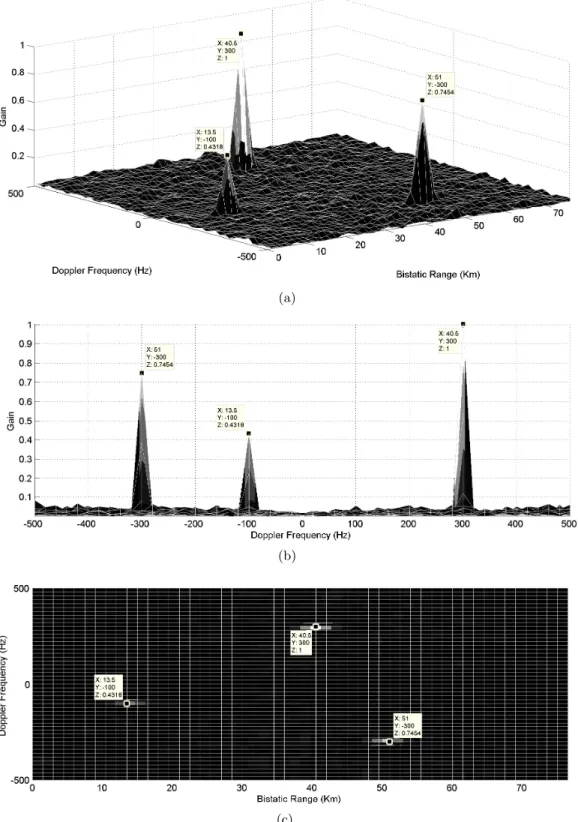
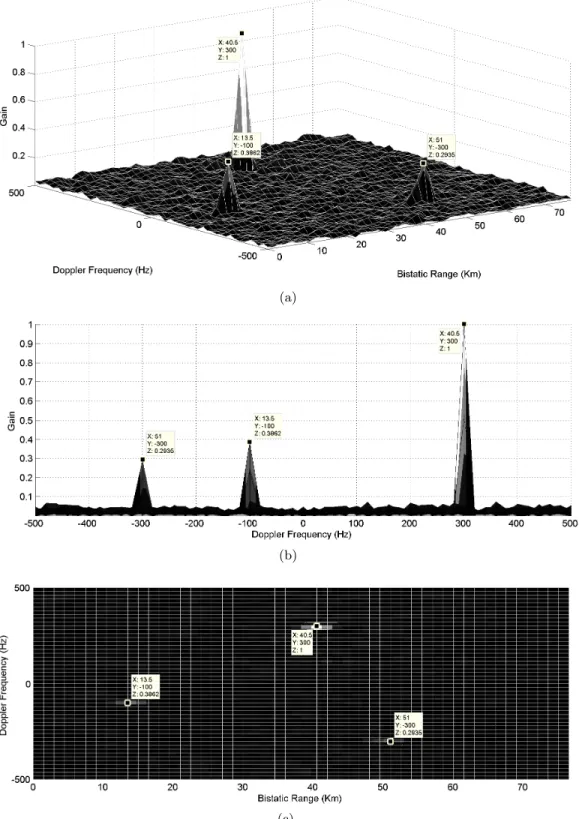
This section presents the simulation results of each method mentioned above. Because of the long time problem and high cost in MATLAB simulation program, a new passive radar system scenario is generated as shown in Table 1. Sampling frequency and integration time are fs = 2 × 10⁵ Hz and 1 sec., respectively, so we can get signals with 2 × 10⁵ size. However, it takes too much time for the simulation results. For this reason, a signal portion in 1 × 10⁴ size is taken and used in our simulations. There are 3 targets and 6 clutters in this scenario. AF is calculated according to these specifications and shown in Figure 1. Normal procedure is performed with lms adaptive filter for all calculations. As can be seen in Figure 1(b), the range-Doppler map turns out to be noisy. There are many researches related to denoising the range-Doppler map8, 9With the following algorithms, targets are detected and noise level are decreased.
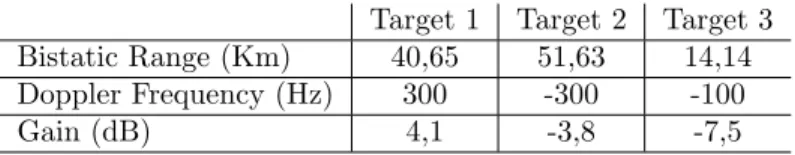
Table 1. System specifications for 3 targets.
Target 1 Target 2 Target 3 Bistatic Range (Km) 40,65 51,63 14,14 Doppler Frequency (Hz) 300 -300 -100
Gain (dB) 4,1 -3,8 -7,5
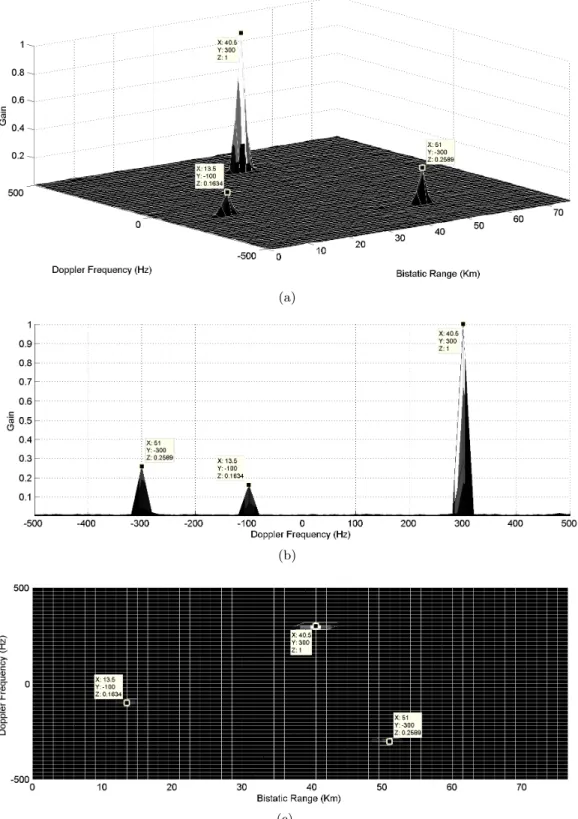
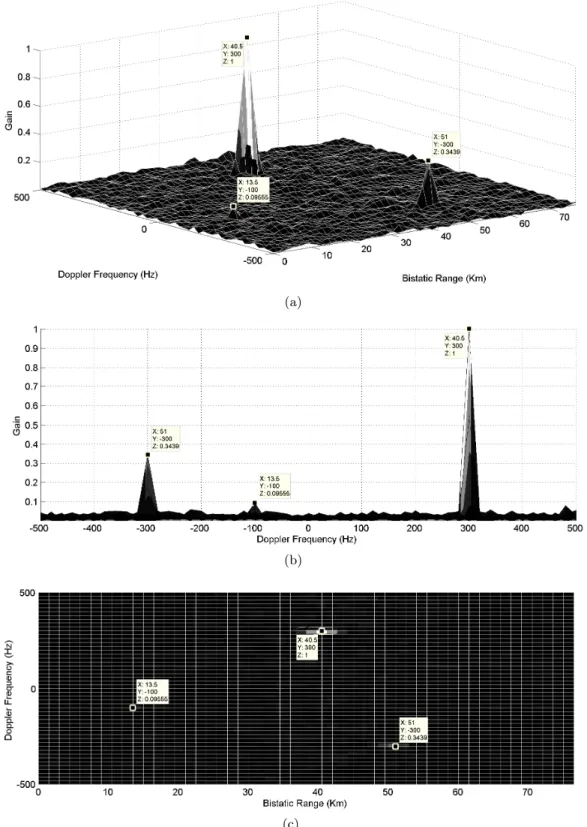
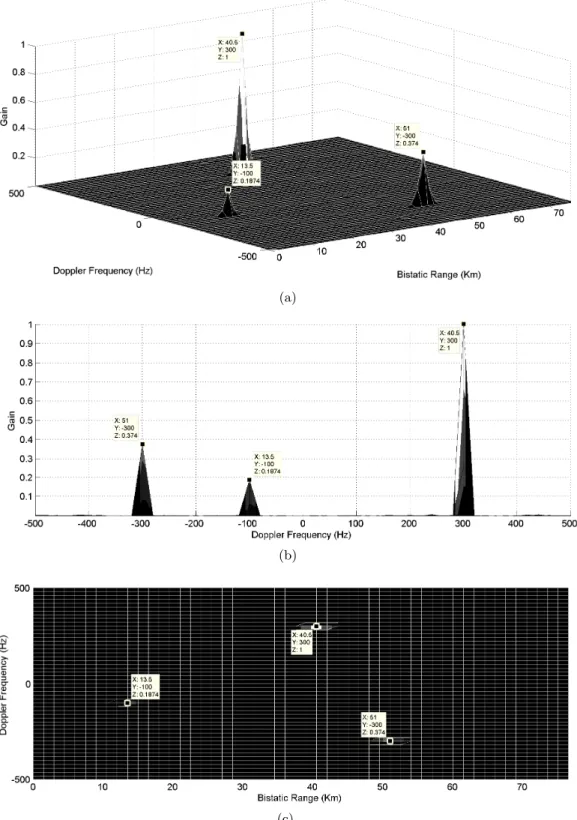
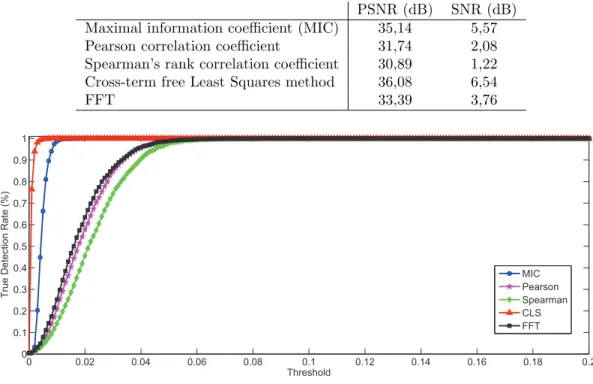
In Figures 2, 3, 4 and 5, the PBR system scenario with 3 targets and 6 clutters is implemented with MIC, Pearson, Spearman and cross-term free least squares methods, respectively. PSNR and SNR values are calculated to compare which method gives the more successful results and these values are listed in Table 2. Moreover, ”FFT” means normal FFT based AF result with noise shown in Figure 1. As can be seen figures and the table, the best result occurs with the CLS method. Noise level is reduced as compared to FFT based method and targets are detected correctly with the MIC and proposed method. PSNR and SNR values for Pearson and Spearman algorithms are below the normal FFT based method. In addition, the running time for CLS method took 1136.8 sec. This shows the computational cost of CLS method is high even if it outperforms other correlation algorithms.
In Figure 6, range-Doppler maps are thresholded within the range of 0 and 1 and plotted versus true detection rate. By doing this, we can learn which method has the best true detection rate versus a threshold. If we analysis this graph, the red line reaches the maximum rate quickly. As the threshold increases, true detection rate converges the maximum rate for all of them because we know that four methods detect three targets clearly at a threshold. As a result by looking at this data, the CLS proposed method outperforms other correlation methods. In addition, we also aim to solve another problem by using correlation methods for radar target detection. It is possible to see targets with the same Doppler frequency and close bistatic ranges, so the problem is to detect and track close targets on the displaying screen. Let us assume a system scenario shown in Table
(a)
(b)
(c)
Figure 1. Illustration of three targets according to system scenario (1): (a) 3D plot; (b) Doppler frequency plot; (c) view from the top.
(a)
(b)
(c)
Figure 2. Simulation result for maximal information coefficient (MIC): (a) 3D plot; (b) Doppler frequency plot; (c) view from the top.
(a)
(b)
(c)
Figure 3. Simulation result for Pearson correlation coefficient: (a) 3D plot; (b) Doppler frequency plot; (c) view from the top.
(a)
(b)
(c)
Figure 4. Simulation result for Spearman’s rank correlation coefficient: (a) 3D plot; (b) Doppler frequency plot; (c) view from the top.
(a)
(b)
(c)
Table 2. PSNR and SNR values of results.
PSNR (dB) SNR (dB) Maximal information coefficient (MIC) 35,14 5,57 Pearson correlation coefficient 31,74 2,08 Spearman’s rank correlation coefficient 30,89 1,22 Cross-term free Least Squares method 36,08 6,54
FFT 33,39 3,76 0 0.02 0.04 0.06 0.08 0.1 0.12 0.14 0.16 0.18 0.2 0 0.1 0.2 0.3 0.4 0.5 0.6 0.7 0.8 0.9 1 Threshold T ru e D e te ct io n R a te (% ) MIC Pearson Spearman CLS FFT
Figure 6. True detection rate vs. threshold graph for correlation methods.
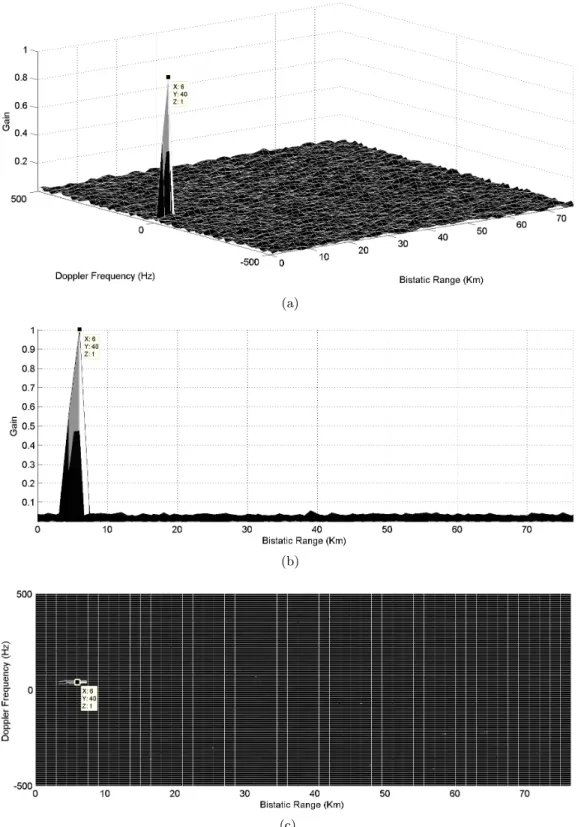
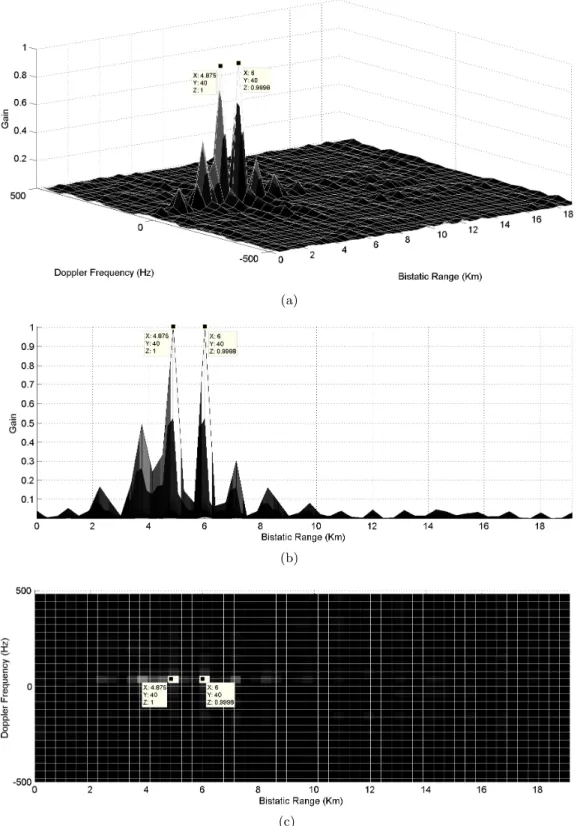
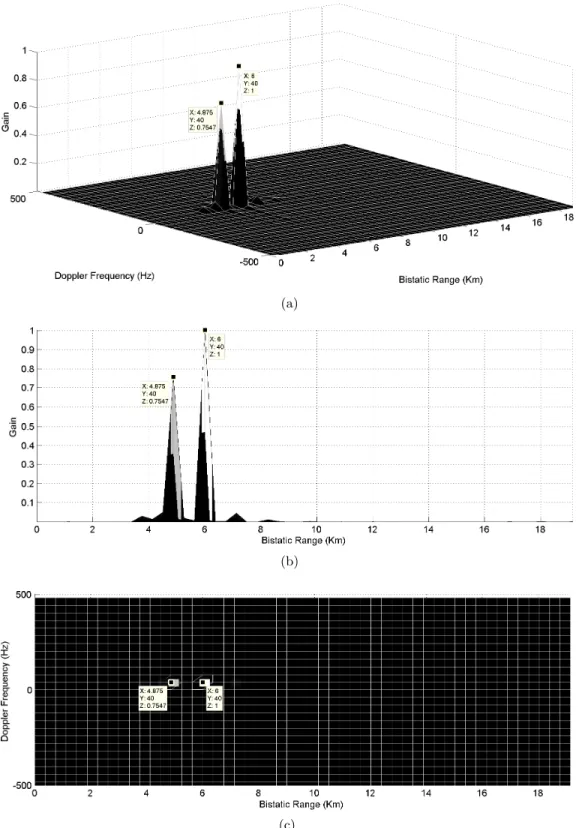
3 for two close targets and the range-Doppler map is plotted for AF in Figure 7. As can be seen, targets are not detected separately. This can cause the tracking problem in real-life work. For this purpose, CLS method is posed to detect targets. Simulation result of close targets for CLS method is shown in Figure 7. If we implement the multiple FM channels on our scenario, we can detect close two targets shown in Figure 8. As can be seen from Figure 9, the number of side lobes is decreased and close targets are detected clearly. Superious peaks are negligible compared to AF based close target scenario.
Table 3. System specifications for two close targets in Figures 7
Target 1 Target 2 Bistatic Range (Km) 4,875 6 Doppler Frequency (Hz) 40 40
Gain (dB) -10 -5
5. CONCLUSION
This paper discusses whether the recently developed correlation methods can be used in PBR systems. We show that correlation methods can be used instead of the AF for target detection. However the proposed methods have high computational cost compared to the AF based approaches because the AF is computed using the FFT algorithm. MIC, Pearson, Spearman’s rank correlation coefficients are the methods used in this thesis. In addition, a new method called Cross-term free Least Squares (CLS) method is proposed and compared with others. Best results are observed with the CLS method. It is experimentally observed that it is possible to resolve close targets when multichannel FM data is used. The advantage of the CLS method compared to AF based approaches is that superious peaks do not appear in the proposed CLS method.
(a)
(b)
(c)
Figure 7. Simulation result of two close targets with p(1,2)= 40 Hz, l1= 4.875 and l2= 6 km for normal AF: (a) 3D plot;
(a)
(b)
(c)
Figure 8. Simulation result of two close targets with p(1,2)= 40 Hz, l1= 4.875 and l2 = 6 km for multiple FM channels
(a)
(b)
(c)
Figure 9. Simulation result of two close targets with p(1,2)= 40 Hz, l1= 4.875 and l2 = 6 km for multiple FM channels
based CLS method: (a) 3D plot; (b) bistatic range plot; (c) view from the top.
CLS method are also used to detect two close targets with multiple FM channels based signals and one FM channel. Even though one FM channel based PBR system with CLS method can not separate targets, multiple
channel system can successfully detect both targets.
ACKNOWLEDGMENTS
This work was supported in part by the Scientific and Technical Research Council of Turkey, TUBITAK. Any opinion, determination and conviction is not the official opinion of TUBITAK in the publication according to the contract.
REFERENCES
1. R. Akin Sevimli, M. Tofighi, and A. E. Cetin, “Range-doppler radar target detection using denoising within the compressive sensing framework,” in Proceedings of the 22nd European Signal Processing Conference (EUSIPCO), pp. 1950–1954, IEEE, 2014.
2. M. T. Arslan, A. Bozkurt, R. A. Sevimli, C. E. Akbas, and A. E. Cetin, “Approximate computation of dft without performing any multiplications: Application to radar signal processing,” in Signal Processing and Communications Applications Conference (SIU), 2014 22nd, pp. 850–853, IEEE, 2014.
3. J. B. Kinney and G. S. Atwal, “Equitability, mutual information, and the maximal information coefficient,” Proceedings of the National Academy of Sciences 111(9), pp. 3354–3359, 2014.
4. D. Reshef, Y. Reshef, M. Mitzenmacher, and P. Sabeti, “Equitability analysis of the maximal information coefficient, with comparisons,” arXiv preprint arXiv:1301.6314 , 2013.
5. S. Jackson, Research Methods and Statistics: A Critical Thinking Approach, 159-162 p., Cengage Learning, 2011.
6. G. J. Borradaile, Statistics of Earth Science Data: Their Distribution in Time, space and orientation, 159 p., Springer, 2003.
7. R. A. Sevimli, “Target detection and imaging on passive bistatic radar system,” Master’s thesis, Bilkent University, 2014.
8. A. E. Cetin, A. Bozkurt, O. Gunay, Y. H. Habiboglu, K. Kose, I. Onaran, R. A. Sevimli, and M. Tofighi, “Projections onto convex sets (POCS) based optimization by lifting,” IEEE GlobalSIP 2013, Austin, Texas, USA , 2013.
9. R. A. Sevimli, M. Tofighi, and A. E. Cetin, “Range-doppler radar target detection using compressive sensing,” in Signal Processing and Communications Applications Conference (SIU), 2014 22nd, pp. 1893–1896, IEEE, 2014.