COMPARABILITY OF SCORES FROM CAT AND PAPER AND PENCIL IMPLEMENTATIONS OF STUDENT SELECTION EXAMINATION TO
HIGHER EDUCATION
A MASTER‟S THESIS BY
AYġE SAYMAN AYHAN
THE PROGRAM OF CURRICULUM AND INSTRUCTION ĠHSAN DOĞRAMACI BĠLKENT UNIVERSITY
ANKARA
COMPARABILITY OF SCORES FROM CAT AND PAPER AND PENCIL IMPLEMENTATIONS OF STUDENT SELECTION EXAMINATION TO
HIGHER EDUCATION
The Graduate School of Education
of
Ġhsan Doğramacı Bilkent University
by
AyĢe Sayman Ayhan
In Partial Fulfillment of the Requirements for the Degree of Master of Arts
The Program of Curriculum and Instruction Ġhsan Doğramacı Bilkent University
Ankara
ĠHSAN DOĞRAMACI BĠLKENT UNIVERSITY GRADUATE SCHOOL OF EDUCATION
THESIS TITLE: COMPARABILITY OF SCORES FROM CAT AND PAPER AND PENCIL IMPLEMENTATIONS OF STUDENT SELECTION
EXAMINATION TO HIGHER EDUCATION AYġE SAYMAN AYHAN
May 2015
I certify that I have read this thesis and have found that it is fully adequate, in scope and in quality, as a thesis for the degree of Master of Arts in Curriculum and Instruction.
………. Asst. Prof. Dr. Ġlker Kalender
I certify that I have read this thesis and have found that it is fully adequate, in scope and in quality, as a thesis for the degree of Master of Arts in Curriculum and Instruction.
………. Asst. Prof. Dr. Semirhan Gökçe
I certify that I have read this thesis and have found that it is fully adequate, in scope and in quality, as a thesis for the degree of Master of Arts in Curriculum and Instruction.
……….. Prof. Dr. AlipaĢa Ayas
Approval of the Graduate School of Education ………
iii
ABSTRACT
COMPARABILITY OF SCORES FROM CAT AND PAPER AND PENCIL IMPLEMENTATIONS OF STUDENT SELECTION EXAMINATION TO
HIGHER EDUCATION
AyĢe Sayman Ayhan
M.A., Program of Curriculum and Instruction Supervisor: Asst. Prof. Dr. Ġlker Kalender
May 2015
The purpose of this study was to investigate the possibility of computerized adaptive testing (CAT) format as an alternative to the paper and pencil (P&P) test of the student selection examination (SSE) in Turkey. The scores obtained from both P&P format of the SSE and CAT through post-hoc simulations were compared using science subtest items. Different test termination rules (fixed length and fixed
standard error) and ability estimation methods (EAP and MLE) were used to operate the CAT version of the SSE P&P test. 10, 15 and 25 items were used as fixed length test and standard errors of 0.30, 0.20 and 0.10 were used as fixed standard error thresholds in terms of test termination rules. Results indicated significant correlations between scores from SSE and CAT. The comparisons between results obtained from CAT and P&P tests also revealed that there exists similar ability distributions and
iv
significant reduction in the number of items used through CAT. The findings from the research showed that CAT could calculate reliability using fewer items than P&P test. This study suggests that CAT can be an alternative to SSE with comparable scores to P&P format.
Key words: CAT, computerized adaptive testing, science achievement, student selection
v
ÖZET
YÜKSEK ÖĞRENĠME GĠRĠġ SINAVININ BĠLGĠSAYAR ORTAMINDA BĠREYSELLEġTĠRĠLMĠġ TEST VE KAĞIT KALEM TESTĠ
FORMATLARINDAN ELDE EDĠLEN PUANLARININ KARġILAġTIRILMASI
AyĢe Sayman Ayhan
Yüksek Lisans, Eğitim Programları ve Öğretim Tez Yöneticisi: YardımcıDoçent Doktor Ġlker Kalender
Mayıs 2015
ÇalıĢmanın amacı yüksek öğrenime giriĢ sınavında bilgisayar ortamında
bireyselleĢtirilmiĢ testin (CAT) öğrenci seçme sınavı (ÖSS) klasik kağıt ve kalem testlerine alternatif olabilirliğini araĢtırmaktır. Bu bağlamda öğrenci seçme sınavına ait fen alt testi kullanılarak hem kağıt ve kalem hem de CAT simülasyonlarından elde edilen puanlar kıyaslanmıĢtır. ÖSS sınavını CAT formatında yapılandırmak için sabit soru sayısı ve standart hata eĢik değerleri ile farklı yetenek kestirim metotları (EAP ve MLE) gibi farklı test sonlandırma kuralları kullanılmıĢtır.Farklı yetenek kestirim metotları altında sabit soru sayısı değerleri 10, 15 ve 25; standart hata eĢik değerleri 0.30, 0.20 ve 0.10 test sonlandırma kuralı olarak kullanılmıĢtır. Bu bağlamda ÖSS ve CAT simülasyon sonuçları arasında önemli bir korelasyon bulunmuĢtur. Ayrıca CAT ile soru sayısında önemli miktarda azalma ile benzer yetenek düzeyleri tespit
vi
güvenilir bir sınav sağladığı tespit edilmiĢtir. Bu sebepten çalıĢmaya konu olan araĢtırma bireyselleĢtirilmiĢ testi kıyaslanabilir skorlarla ÖSS kâğıt kalem testine alternatif olarak önermektedir.
Anahtar kelimeler: bilgisayarda bireyselleĢtirilmiĢ test, CAT, öğrenci seçme, fen baĢarısı
vii
ACKNOWLEDGEMENTS
First of all, I would like to thank my supervisor, Asst. Prof. Dr. Ġlker Kalender for his enthusiasm, encouragement and his resolute dedication to the strangeness of my knowledge on computerized adaptive tests. Also I am thankful to him for his criticism and detailed comments.
I am also indebted to my committee members, Prof. Dr. AlipaĢa Ayas and Asst. Prof. Dr. Semirhan Gökçe for their feedback and criticism.
I take this opportunity to express my gratitude to the members of Graduate School of Education for their help and guidance.
Last but not least, I would like thank Annelise Hein and Andrew Bonar for proofreading my thesis and I am grateful to my husband who supported me throughout this venture.
viii
TABLE OF CONTENTS
ABSTRACT ... iii
ÖZET... v
ACKNOWLEDGEMENTS ... vii
TABLE OF CONTENTS ... viii
LIST OF TABLES ... xi
LIST OF FIGURES ... xii
LIST OF ABBREVIATIONS ... xiii
CHAPTER 1: INTRODUCTION ... 1
Introduction ... 1
Background ... 2
Student selection examination in Turkey for undergraduate programs ... 2
Computerized adaptive testing (CAT) ... 4
Problem ... 6
Purpose ... 8
Research questions ... 8
Significance ... 9
Definition of terms ... 9
CHAPTER 2: REVIEW OF RELATED LITERATURE ... 11
Introduction ... 11
Large scale testing ... 11
Large scale testing in the world ... 11
Large scale testing in Turkey ... 12
ix
Limitations of CAT ... 14
Item response theory ... 15
Ability estimation methods ... 20
Strategies for test termination ... 21
Summary ... 22 CHAPTER 3: METHOD ... 24 Introduction ... 24 Research design ... 24 Context ... 24 Sampling ... 25 Instrumentation ... 29
Method of data collection ... 29
Method of data analysis ... 29
Summary ... 31
CHAPTER 4: RESULTS ... 33
Introduction ... 33
Is there any reduction in the number of items required by CAT? ... 33
Is there acorrelation between ability estimates obtained from CAT and P&P tests?... 35
Is there any difference in difficulty between the CAT and P&P tests? ... 36
Are there any differences in terms of score distributions obtained from CAT and P&P test?... 37
Are there any differences in terms of the reliability of scores obtained from CAT and P&P test? ... 50
x
Summary ... 52
CHAPTER 5: DISCUSSION ... 53
Introduction ... 53
Overview of the study ... 53
Major findings ... 54
Is there any reduction in the number of items required by CAT? ... 54
Is there a correlation between ability estimates obtained from CAT and P&P tests?... 55
Is there any difference in difficulty between the CAT and P&P tests? ... 56
Are there any differences in terms of score distributions obtained from CAT and P&P test?... 57
Are there any differences in terms of the reliability of scores obtained from CAT and P&P test? ... 57
For what percentage of test-takers is MLE not able to produce scores? ... 58
Implications for practice ... 59
Implications for further research ... 60
Limitations ... 62
REFERENCES ... 63
xi
LIST OF TABLES
Table Page
1 Descriptive statistics of total science true scores ... 26
2 Statistics of true scores of general schools, Anatolian schools and private high schools of SSE 2005 ... 26
3 Percentages of true, false and missing of 45 science items... 28
4 The numbers of items given to examinees under different CAT strategies ... 34
5 Correlations of ability estimates between CAT and P&P ... 36
6 Median of ability estimates based on different post-hoc simulations ... 37
7 Distribution of both CAT and P&P ability estimations by MLE obtained from general high schools ... 38
8 Distribution of both CAT and P&P test ability estimations by EAP obtained from general high schools ... 40
9 Distribution of both CAT and P&P ability estimations by MLE obtained from Anatolian schools ... 42
10 Distribution of both CAT and P&P ability estimates by EAP obtained from Anatolian schools... 44
11 Distribution of both CAT and P&P ability estimates by MLE obtained from private schools ... 46
12 Distribution of both CAT and P&P ability estimates by EAP obtained from private schools ... 48
13 Median of SE values obtained from P&P and CAT under fixed items ... 50
14 Percentages of examinees with non-converging ability estimates based on MLE ... 51
xii
LIST OF FIGURES
Figure Page
1 Three parameter logistic model item characteristic curve……….18
2 Distribution of total scores of SSE 2005………...26
3 Distribution of total scores of general (a), Anatolian (b) and private (c) schools……….…...27
4 Distribution of MLE P&P ability estimates for general high schools……...39
5 Distribution of standard errors by MLE P&P test for general high schools..39
6 Distribution of EAP P&P ability estimates for general high schools……....41
7 Distribution of standard errors by EAP P&P test for general high schools...41
8 Distribution of MLE P&P ability estimates for Anatolian schools………...42
9 Distribution of standard errors by MLE P&P test for Anatolian schools…..43
10 Distribution of EAP P&P ability estimates for Anatolian schools………....45
11 Distribution of standard errors by EAP P&P test for Anatolian ………...45
12 Distribution of MLE P&P ability estimates for private schools ... 47
13 Distribution of standard errors by MLE P&P test for private schools ... 47
14 Distribution of EAP P&P ability estimates for private schools ... 49
xiii
LIST OF ABBREVIATIONS
CAT Computerized Adaptive Testing
CTT Classical Test Theory
EAP Expected A Posteriori
IRT Item Response Theory
MLE Maximum Likelihood Estimation
ÖSYM P&P SE
Student Selection and Placement Center Paper and pencil test
Standard Error
1
CHAPTER 1: INTRODUCTION
Introduction
The purpose of testing in education can be described as determining students‟
abilities/skills, providing feedback for instructors and students, school accountability and measuring pre-determined skills. Paper and pencil (P&P) testing format has been very common for decades in educational settings, but the wide use of computers may replace P&P format and provide significant improvement in testing, especially large scale testing which has been given in P&P format in Turkey. For example, Entrance Examination for Graduate Studies (ALES) and Student Selection Examination (SSE) are still done based on P&P format. Recently there have been some changes
observed in testing format. The Foreign Language Examination for Civil Servants (YDS) test has been delivered via computer after 2014. The test only replaced the medium of delivery (from paper to computer), not the testing approach. Students still needed to proceed item by item as in a P&P test but it was the first time that
computers were used for testing in Turkey in a large scale assessment.
Computer-based tests have been used for many years but most of them are linear tests. Since 1980s, a new testing format, computerized adaptive testing (CAT) has been proposed to change not only the testing medium, but also the testing
philosophy. Instead of presenting items to all examinees in front of a computer, CAT dynamically selects and delivers items based on students‟ progress in the test. This study focused on the (i) applicability of CAT format to SSE, probably the most important large scale test, and (ii) comparability of scores obtained from conventional testing environment (P&P) and CAT formats.
2
Background
Student selection examination in Turkey for undergraduate programs
There are many examples for large scale testing implementations in Turkey. SSE is probably one of the most important ones since the scores from SSE are used for placement into higher education. SSE consisted of two phases in 2014. The first phase was Entrance Exam to Higher Education (YGS) which is used for placing students in some higher education programs and used for selecting students for the second phase. The first phase testing occasion includes 160 items. The subjects are Turkish, mathematics, social sciences (history, geography, philosophy and religion) and science (physics, chemistry, biology). Each subject group contains 40 items. The second phase is the Placement Exam to Higher Education (LYS) and used for
placement (ÖSYM, 2014).
This exam unfortunately generates tremendous pressure on students; may even affect their psychology in negative ways (Yıldırım & Ergene, 2007). An exam administered once a year surely affects students‟ lives since their futures depend on this exam. If a student has health problems or cannot participate to exam, they have to wait until next year. There is an important detail here; one year may change everything in a human`s life.
In addition to the following problems, a psychometric problem should also be discussed in SSE. The results obtained from SSE across the years points to an important issue. For example, means of SSE 2005 show that the mean of science subtest is 3.9 out of 45. In the years 2008 and 2009, the mean of the 30-item science subtest was 3.9 and 4.0 for the students at Grade 12 (at the last year of the high school), respectively (ÖSYM, 2005; 2008; 2009). More recent means of the science
3
subtest from the SSE 2014 (4.5) and 2015 (4.6) indicated that means have been quite low (the means reported in this paragraph were calculated for all students who take the SSE in respective years, ÖSYM, 2014; 2015).
It is obvious that something is wrong with the balance between difficulties of items and the ability levels of examinees. The results for the last ten years show that these items did not match with the ability level of the students. The mismatch between difficulty level and ability level result in too much weight being given to items, rather than students‟ ability. In other words, a correct item in SSE may significantly change a student‟s rank. Another issue regarding the mismatch is that most of the items were not correctly answered by students. This situation may develop a claim that there may be no reason to ask many questions if they have a very low mean. Within these tests, some questions are difficult to solve for individuals having low ability and by the same way some are very easy for the students who are high achievers so it is meaningless to assess each individual with the same set of items.
In addition, regarding P&P format of SSE, there are other issues to consider such as security problems, transportation of booklets into exam centers, and organization of the exam for more than one million examinees for all over the country on a particular day. Moreover, the items are prepared for the P&P format which may be quite tiring or boring to read. Also they are not items designed by multimedia such as videos or animations which can be creative and may help to measure critical thinking skills of examinees (Çıkrıkçı-DemirtaĢlı, 2003; Kalender, 2012).
Based on the problems across years, it can be said that a new test design is needed urgently which provides suitable items for examinee‟s ability level. If the test design maintains suitable items for each examinee, much more compact exam can be given
4
without delivering items too far above or below students‟ levels (Kalender, 2011). Also many issues regarding logistics such as time, security and transportation will be solved.
Computerized adaptive testing (CAT)
The idea of adaptive testing first appeared with the Binet& Simon intelligence test (Weiss, 1982). But “computerized” adaptive testing idea first appeared in the 1970s from the U.S. Department of Defense which highlighted the benefits of CAT (Wainer, 1993). Early studies were done by US Army, Navy and Air Force but they were not very successful. The Armed Services Vocational Aptitude Battery (CAT-ASVAB) was administrated in CAT format in the 1980s in the United States. Then the progress in computer technology led to the development in CAT applications. A notable example of CAT is the Graduate Record Examinations (GRE) which has been developed by Education Testing Service (ETS). The GRE was first done as CAT in 1993 (Schaeffer, Steffen & Durso, 1995) and the Test of English as a Foreign Language (TOEFL) was first given as CAT in 1998 in the United States. Today, TOEFL has been using internet-based non-adaptive test format (Kim & Huynh, 2007). Moreover, the Graduate Management Admission Test (GMAT) and the National Council Licensure Examination (NCLEX/CAT) developed CAT
formats to get the license in nursing in the United States (Gokce, 2012). MATHCAT is another computer adaptive testing system developed by the National Institute for Educational Measurement (Cito) in the Netherlands (Verschoor & Straetmans, 2010).
CAT differs from P&P tests in many ways. First of all, it ensures that each student is given a test which includes items tailored for his or her ability level. Items are
5
dynamically selected from a large item pool based on the current ability levels of students, estimated immediately after each response.
In the background of CAT is Item Response Theory (IRT), a mathematical theory which relates ability level of students and item parameters. (Lee, Park & Kim, 2012). IRT based CATs produce comparable scores for test-takers who took the same test, giving them different weights. Another major advantage of CAT is the ability of estimating a reliability level of each student‟s score. In conventional testing, a common reliability is estimated for all examines.
Some advantages of CATs are given below (Tonidental, 2001; Zickar, 1998): Test security is improved since each examinee takes different items,
Fast scoring can be provided just after the test,
The possibility of cheating and copying is eliminated,
Flexibility of administration is increased,
Testing time is reduced,
The number of items are reduced,
Efficiency and measurement success are provided,
Measurement precision becomes the same for each individual,
Test is standardized,
6
On the other hand, there are some disadvantages of CAT, for example the cost of software programs, psychometric properties of the test, or requirements for a large item pool. In addition, CAT does not allow skipping the items. P&P tests allow examinees to go back and review the answers but CAT requires the answers to be given for an item in order to see the next item. Another disadvantage is that CAT and P&P tests differ in terms of scoring (Stocking, 1987). Conventional tests, based on classical test theory, calculate only correct responses while adaptive tests use IRT in that responses to prior items determine both the ability estimations of individuals and the selection of new coming items.
Problem
Statistics show that 1,282,512 Turkish middle school students took the Transition from Middle to Secondary Education (TEOG) exam in Grade 8, in 2015, and more than one million young people take the SSE each year (MoNE, 2015; ÖSYM, 2015).Especially SSE has significance since it is a high-stake test, the results of which are used for placement purposes in higher education institutions. The SSE has been given in P&P format for years.
The SSE consists of only multiple-choice items aiming to measure students‟ knowledge. Although the questions are developed based on the high school
curriculum, they still do not match the ability of test takers (Berberoglu, 2012). Also, blind guessing is an important issue to consider about SSE. According toKalender (2012), “Giving a correct response to any item could change examinees‟ ordering significantly. When an examinee gives a correct response to an item by blind guessing he/she could receive higher scores than he/she deserves due to poor item parameters” (p.6).
7
Whether it is P&P or CAT, a test should be able to determine if the true score comes by blind-guessing or from the examinee‟s knowledge. According to Mead &
Drasgow (1993), when the questions fit the ability of the examinee, there will not be blind-guessing problems. However, CAT may provide efficient solutions for all of those problems. First, CAT can provide items which fit well with the ability levels of examinees. Second, there will not be security or transportation of booklets thanks to the structure of CAT. Third, each examinee is given different items based on their ability levels which make cheating impossible. Fourth, items can be interactive and media presented which make the exam friendly. These conditions make the test more creative and lead to ask critical thinking questions or 3D items. Fifth, scoring will be easy right after the test. Also the most important thing is CAT could reduce the pressure on students if it is done more than once a year. To be able to solve all these problems, this study investigated if CAT can be an alternative to P&P based SSE.
Although the advantages of CAT format in large-scale testing programs are many, studies in Turkey are very limited (Demirtaslı-Cıkrıkcı, 2003; Gökce, 2012; Iseri, 2002; Kalender, 2011and Ozbası, 2014). These studies mostly focused on
correlations between scores obtained from P&P and CAT formats. If testing medium may be given as an option to students, then students may select testing format. When this is the case, another problem arises. Scores from both formats should be
comparable.
Despite the fact that CATs have become popular in other countries, it may not be easy to put SSE in CAT format immediately in Turkey. If two versions co-exist together, their scores should be comparable. There are four aspects of comparability which are reliability, test length, item exposure and content balancing (Wan, Ken,
8
Davis & McClarty, 2009). This study focused on comparability by using different text lengths and reliability.
Purpose
This study investigated if (i) CAT could be an alternative to SSE or not and (ii) how the scores obtained from CAT and P&P versions of SSE are comparable. Different test termination rules and ability estimation methods were used to operate CAT versions of the SSEP&P test. The results obtained from both P&P format of the SSE and CAT through simulations were compared. For this reason, SSE2005 science items were used to generate new results via post-hoc simulations. Different school types were also considered in this study. The results of general, Anatolian and private high schools were examined since these schools represent different ability levels (Kalender, 2011).
Research questions
The first research question is related to applicability of CAT. The sub-research questions were stated based on the studies in the literature on comparability issues between CAT and P&P tests (Wang & Kolen, 2001; Wang & Shin, 2010).
Could student‟s scores from P&P and CAT formats be compared?
1. Is there any reduction in the number of items required by CAT? 2. Is there a correlation between ability estimates obtained from CAT
and P&P tests?
3. Is there any difference in difficulty between the CAT and P&P tests? 4. Are there any differences in terms of score distributions obtained from
9
5. Are there any differences in terms of the reliability of scores obtained from CAT and P&P tests?
6. For what percentage of test-takers is MLE not able to produce scores?
Significance
This study focuses on the viability of a reform to SSE with CAT as an alternative to the P&P of SSE, not only considering applicability of CAT but also comparability of CAT to P&P format. Transforming a P&P test into CAT format can easily be done. But if the comparability between different testing formats is not possible, then different formats cannot be delivered optionally. The results are expected to yield significant information especially for score comparability which may be used by Student Selection and Placement Center (ÖSYM), test developers, and measurement specialists.
Definition of terms
CAT (Computerized Adaptive Testing): A testing method based on IRT which tailors abilities of test takers according to their previous responses (Weiss, 1982).
CTT (Classical Test Theory): A measurement framework in which most of the P&P tests are grounded (Fan, 1998).
EAP (Expected A Posteriori): One of the ability estimation methods which belongs to Bayes‟ theorems (Boyd, 2003).
IRT (Item Response Theory): The theory in which CAT is grounded; it gives information about the ability of examinee on item level (van der Linden, 2000).
10
MLE (Maximum Likelihood Estimation): One of the ability estimation methods that does estimates based on the model parameters (Keller, 2000).
SSE (Student Selection Exam): The national exam for higher education in Turkey. In 2005, there were two phases of the university entrance exam. The first phase of the exam was called ÖSS (Student Selection Exam) and the second phase was called ÖYS (Student Placement Exam). Now, as of 2015, the first phase of the exam is called YGS (Entrance Exam to Higher Education) and the second phase is called LYS (Placement Exam to Higher Education). This study focused the first phase of the exam in 2005. The abbreviation of SSE is thus used to represent ÖSS.
SE (Standard Error): Standard error of ability estimation which is mainly used here as a test termination rule to assess reliability.
TEOG (Transition from Middle to Secondary Education): A test for Grade 8 students in Turkey. The results are used for placement in secondary education (MoNE, 2015).
YDS (Foreign Language Examination for Civil Servants): The test to measure foreign language skills of candidates for placement in graduate programs in Turkey (ÖSYM, 2015).
11
CHAPTER 2: REVIEW OF RELATED LITERATURE Introduction
Innovations in computers have significant effects on many areas of education, such as curriculum, measurement and evaluation. Previously, access to computers was limited to people from different levels of society because of high costs and
capability. Since the early 1990s, it has been reported that this influx of technology has had an effect on student learning (Christensen, 2002). At the same time, CAT has been developed and implemented in large-scale testing programs such as licensure, certification, admissions, and psychological tests, especially in the United States, China and India (Kim & Huynh, 2007).
The purpose of this chapter is to provide context about large scale testing and problems. The definition of CAT, its advantages, the theory behind it, ability
estimation methods and test termination rules are given to explain how CAT could be an alternative to SSE.
Large scale testing Large scale testing in the world
Bennet (1998) states that large scale educational assessments have multiple purposes for a sizeable number of people such as placement, course credits, graduation or school accountability. GRE (Graduate Record Examination), TOEFL (Test of English as a Foreign Language), IELTS (International English Language Testing System), SAT (Scholastic Assessment Test), IB-DP (International Baccalaureate Diploma Program), TIMSS (Trends in International Mathematics and Science
12
Study), and IAEP (International Assessment of Educational Progress) are some of the examples of these large scale testing from several countries (Eignor, 1993).
Large scale testing in Turkey
Turkey has a population of 76,667,864 people and 12,691,746 of them are between the ages of 15 and 24 (TUIK, 2013). Thus 16.6 % of the population consists of young people many of whom take at least one of the national exams, which are Public Personnel Selection Exam (KPSS), Student Selection Examination (SSE), Entrance Examination for Graduate Studies (ALES), Foreign Language Examination for Civil Servants (YDS) and Transition from Middle to Secondary Education (TEOG) Examination each year. For instance, 1,987,488young people took the SSE in 2015 and people of 1,783,313 took the KPSS in 2014at graduate level (ÖSYM, 2014; 2015).
Tindal & Haladyna (2002) stated that large scale assessments have many issues to consider and research which can be listed as follows: educational reforms,
application of learning theories to standardized tests, validity, measurement and evaluation. Because of the fact that Turkey has many large scale tests, there are many issues to take into consideration.
Problems of large scale testing in Turkey
Recent results of SSE showed that the means of the science subtests were too low. Hence the mismatch between ability levels of students and item difficulty is probably the most important psychometric problem. If this is the case, a test may not be
assessing what it is intended to measure. The security and transportation of questions are some of the problems about large scale exams. In 1999, one of the booklets of the exam was stolen and the exam was delayed. It cost the government a large sum of
13
money to repeat the test and prepare new booklets. While CAT may require some security issues, they are not more than a P&P test‟s.
The university entrance exam is very important in Turkey, as demonstrated by Berberoglu (2012). Millions of young people are trying to pass the exam and go on to higher education, but the reality is there are not enough places for each student. This causes a big competition among students, and also their families, who pay a huge amount of money for tutors or special courses. This puts pressure on students. According to Yildirim (2004), there is a significant correlation between depression, test anxiety and daily hassles of students. That means there is a need to reform of SSE.
Berberoglu (2012) states that a reform in SSE must be based on academic research and the research must examine two different issues: logistics and psychometrics. Administering the university entrance system only once in a year is harsh and hard for students. The exam needs to be rational and well-structured. The students‟ needs and aspirations, as well as their high school scores, must be taken into consideration. Also, multiple choice testing is a problem because the measurement is based on only test-taking ability. The multiple-choice-based education system of Turkey had low PISA scores in 2012 (OECD, 2012). It is clear that this needs to be changed and this change in education needs experts, reform must be based on scientific research, and the techniques must be suitable for measuring students‟ abilities.
CAT administrations
It was in early 1905s when Binet invented an adaptive test with the aim of asking questions to children to determine their intelligence level for their age groups (Weiss, 1982). The test was tailored because the difficulty of questions changed according to
14
previous answers that came from test takers. Some administrations of CAT are CAT-ASVAB (Armed Services Vocational Aptitude Battery) to measure academic and occupational success in military, CAT-GMAT for graduate business schools, Microsoft© Certified Professional Exams for certification in technology, American Institute of Certified Public Accountants Exam (AICPA) to become Certified Public Accountants, and NREMT (Nationally Certified Emergency Medical Technician) to become medical technician in United States(Fetzer, Dainis & Lamber, 2011).
CAT is a technologic assessment system, developed for computers. CAT involves change in both the administration mode and the test delivery algorithm, which turns CAT from linear to adaptive form. This algorithm allows the program to tailor each test (Wang, Kuo, Tsai & Liao, 2012). Rudner (2012) defines CAT as a test in which examinees are posed questions that will adjust in accordance to their responses to easy questions or difficult questions. To do this, CATs need a huge question databank.
Limitations of CAT
According to some comparability studies (Wang& Shin, 2010; Wang & Kolen, 2001), it has been found that test paradigm may be a factor for incomparability. Likewise, mode effect, which can affect examinees‟ performances, is one of the most important concerns about CAT. Ayberk (2012), Drasgow & Chuah (2006) and Schaeffer, Reese, Steffen, McKinley & Mills (1993) found that there is no significant difference between computer based tests and P&P test results in terms of gender and computer familiarity. According to Clark (1994), if the tests have the same content and cognitive activity, the results must be the same for both computer and P&P based tests. On the other hand, Clark (1994) stated that there is a significant difference
15
between student‟s computer-based test performances according to attitude towards computers. The cost of software programs, inability to review the test or skip items, and the need for many computers to run CAT are some of the disadvantages of CAT. In addition, item exposure, item selection and requirement for large item pools have significance to avoid repetition of item usage (Wainer, 1993).
This study focused on the comparability of the scores from P&P of SSE. However, there is very little research about CAT in Turkey and most of these studies are PhD dissertations. That is why this master thesis has significance for researchers who would like to conduct a further research about CAT in Turkey.
Item response theory
There are two widely accepted kinds of measurement frameworks, Classical Test Theory (CTT) and IRT. CTT does not have a complex theoretical model. As stated in Fan (1998); “CTT collectively considers a pool of examinees and empirically
examines their success rate on an item” (p.358). On the other hand, IRT has a well defined theoretical model and it gives information about the ability of examinees on an item level. This property of IRT is used for adaptive testing. IRT is mentioned by Lord & Novick (1968) for the first time. As an example for linear test based on IRT, the Test of English as a Foreign Language (TOEFL) has been done all over the world for many years. It is a good example of computer-based tests. Many other
standardized achievement and aptitude tests such as the Scholastic Aptitude Test, the California Achievement Tests, the Stanford Achievement Tests, and the Woodcock-Johnson Psycho-Educational Battery are developed using item response model principles and procedures (Hambleton, Zaar & Pieters, 1991).
16
IRT is the theory in which CAT is grounded. According to Hambleton, Zaar & Pieters (1991); “Classical test theory models and methods which have been in wide use for 60 years or more are being replaced by new test theories and methods, most notably item response theory” (p.341).IRT is a good theoretical basin for a test and provides useful information to test developers. In contrast to CTT, IRT gives information on item basis. It calculates the ability of the examinee on an item level by calculating the probability of the correct response for each item. It is not easy to assume examinees‟ response on an item basis but IRT makes it known. This is the main feature of IRT which means IRT calculates the probability of correct response for next item. For this reason, IRT can be called probabilistic test theory. In addition, this feature of IRT provides item characteristics independent from the group, ability estimations independent from the items and reliability estimations on individual levels. IRT derives item characteristics independent from the group, which means that item parameters would be same for individuals. This is called invariance of ability parameters. In addition, ability estimations are independent from the items which mean if two different sets of items are given to test takers; the same ability levels are estimated. This is called invariance of item parameters. To be able to generate item parameters, items are calibrated based on their difficulty levels: the items are given to test takers to generate item parameters based on their responses. When the model and item parameters fit, the test can be given to different examinees with different items to receive comparable estimates of ability. Therefore, the items in the test match with the ability levels of individuals (Embretson & Reise, 2000; Hambleton & Jones, 1993; Kingbury & Zara, 1989; Mead & Meade, 2010; Reise & Waller, 2003; Stocking, Smith & Swanson, 2000; Yen, 1981).
17
IRT has several models that aim to calculate the probability of certain responses for a certain item. The models have functions which are normal ogive or logistic
functions. The models in logistic functions are explained below (Hambleton & Swaminathan, 1984).
One parameter logistic model (1PL) is interested in item difficulty, b. This is the simplest dichotomous IRT model since there is only one item parameter. This item parameter, b, provides information about the person‟s ability level since there is an interaction between the difficulty of item and ability. Therefore, the probability of a correct response can be predicted.
One Parameter Logistic Model:
( )
( )
( ) i = 1, 2, …n (D = 1.7)
Two Parameters Logistic Model:
( ) ( ) ( ) i = 1, 2, …n (D = 1.7)
Three Parameters Logistic Model:
( ) ( )
( )
18
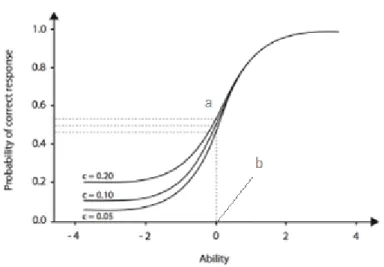
Figure 1.Three parameter logistic model item characteristic curve
This item characteristic curve shows the relationship between ability and probability of a correct response (P ) for an item. c represents the pseudo-guessing factor, b represents item difficulty and a represents discrimination. As b goes right, items become harder; and as b goes left, items become easier. As can be seen from the Figure 1, 0.5 is the changing point for the parameter that makes the graph flatter or steeper. The item characteristic curve gives information on item level.
Much of what IRT provides comes from item information function. The idea is to match the item difficulty with the ability level of examinee. Then the information is received with regards to how close the difficulty of the item is to the ability of examinee. The amount of information depends on this criterion. When the ability is known for each item, then the difficulty can be calculated. To be able to have a good measurement, it is important to have variety of items, which have different difficulty levels (Bock, 1972; Pashley, 1991; Rizopoulos, 2006).
The two parameters logistic model (2PL) is labeled as Birnbaum model whereas the one parameter logistic model (1PL) is called as Rasch model in literature. The 2 PL model uses two parameters which are item difficulty, b, and item discrimination, a.
19
These two parameters derive information when the difficulty of an item is too high for an examinee, who has low ability. Higher ability level is achieved by higher difficulty of items. Likewise, item discrimination distinguishes between the items with different ability levels (Kalender, 2009). The three parameter logistic model (3PL) has the additional influence of guessing parameter, c, on item difficulty, b, and item discrimination, a (De Ayala, 2009; Pashley,1991).
Some IRT studies from Turkey are given below:
Baykul (1979) investigated the results obtained from 3PL model and CTT in terms of mathematical test ability. In the first place the results stated that 3PL generated more reliable scores. Berberoglu (1988) studied the contributions of Rasch Model which is a special case of IRT; to operate measurement and to increase objectivity of test items of SSE. The results were compared to the results from CTT. The findings showed that the Rasch Model operated higher scores in terms of both reliability and validity.
The study which was done by Demirtaslı-Cıkrıkcı (2003) examined the comparison of Raven Standard Progressive Matrices (RSPM) Test under CTT with IRT models. The results revealed that item difficulty indices for both CTT and IRT were highly invariant, and IRT based CAT were suggested as a test application. In addition, Kalender (2011) investigated the effects of different CAT strategies on the recovery of ability. The results obtained from IRT and CTT were compared. SSE 2005, 2006 and 2007 science sub-test items were used to generate scores by CAT. The findings underlined high correlations between the scores from conventional P&P test and CAT. Lastly Iseri (2002), Kaptan (1993), and OzbaĢı (2014) did research about IRT in their dissertations and explained many advantages of IRT over CTT.
20
Fan (1998), Samejima (1969), Van der Linden & Glass (2000) and Zickar (1998) did an empirical study to identify differences between IRT and CTT since they are very different measurement frameworks. The findings supported the idea that IRT has many advantages over CTT.
Ability estimation methods
There are four ability estimation methods in literature (Beguin & Glas, 2001; Keller, 2000). As it is stated in van der Linden (2010), the most popular one was maximum likelihood estimator, MLE. The others are weighted likelihood estimation (WLE), expected a posteriori estimation (EAP) and maximum a posteriori estimation (MAP). The last two are called Bayesian ability estimation methods. According to Beguin & Glas (2001) “Bayesian approach gives the possibility to rigorously model all
dependencies among variables and sources of uncertainty (p.541). Moreover, Bayesian techniques provide flexibility and calculate ability for complex data (Fox, 2010). WLE can be an alternative to MLE since it uses likelihood estimations while the other two use posterior based estimations.
MLE focuses on maximizing likelihood to estimate ability. Lord (1986) discussed the advantages and disadvantages of MLE in IRT. Lord stated that MLE produces non-convergence results, which can be a disadvantage, whereas it has consistency and efficiency, which can be stated as advantages. Wang (1997) examined MLE and EAP ability estimates in CAT. It is concluded that MLE produces unbiased ability estimates and low standard error values whereas EAP produces biased results but high standard error values. The most important characteristics of EAP can be counted as there are not any non-estimated scores whereas non-convergence is a big issue for MLE. MLE requires at least one correct and one incorrect answer for scoring. If all
21
the answers are correct or incorrect for the set of items, MLE does not work, according to Hambleton & Swaminathan (1984).
The current literature on ability estimates abounds with examples of ability estimation methods. Yi, Wang & Ban (2000) did comparison of four ability
estimation methods and WLE was found to be the best ability estimation method for ACT Mathematical Test. Likewise, Riley and Carle (2012) and Veldkamp &
Matteucci (2013) examined the advantages and limitations of Bayesian CAT. McBride (1977) discussed some properties of Bayesian methods in adaptive testing. The results stated that Bayesian techniques highly correlated with ability levels. Chen & Choi (2009) discussed the difference between MLE and EAP. The findings reported that MLE produced non-convergence scores whereas EAP did not. In addition, MLE did not work for small sample sizes whereas EAP worked well. It is stated that “EAP estimators with more informative prior distribution could result in stronger bias towards the mean of the prior distribution, and provide less variation of estimates in terms of standard deviation” ( p. 352). Lastly, Wang et al. (2012)
investigated adaptive systems for Chinese proficiency. Results supported the key argument that EAP had many advantages over MLE and MAP.
Strategies for test termination
To end a CAT there are several methods. Fixed length CAT, variable-length CAT, passing scores, cut points, and standard error thresholds are the most common test termination rules in the literature (Wan et al., 2009; Wang & Kolen, 2001). A fixed set of items are given to test takers in fixed length CAT whereas different sets of items are used for variable-length CAT. Minimum standard error or a time limit is determined to stop variable-length CAT which fits with the minimum standard of
22
reliability. Passing scores or cut points can also be established as a test termination strategy for CAT (Wall &Waltz, 2004).
According to Weiss & Kingsbury (1984), there are important components to consider for CAT administrations. These are response mechanism, item pools, starting rule, item selection procedure, scoring models and test termination rules. The study that belongs to Weiss & Kingsbury (1984) has significance since different termination rules were applied with many item banks. Termination rule is important to catch efficiency in measurement. Otherwise, CAT cannot fit into good measurement tools. Babcock & Weiss (2012) used MLE as ability estimate method and reliability of 0.85, 0.90 and 0.95 for standard error thresholds together with other stopping
conditions. Babcock & Weiss „s results showed that fixed length and variable-length CATs performed similarly whereas Boyd‟s (2003) investigation showed that fixed length tests were more useful to calculate item exposure rate.
Summary
In this chapter, the discussion pointed out many articles and research papers to answer research questions of this study properly. In the first place, the concept of large scale testing was identified. The situation of large scale testing all over the world and in Turkey was detailed with many examples. Nearly all of the large scale testing was P&P based whereas there were only several tests that were computer based. Then, SSE of Turkey was highlighted since it was one of the most important exams in Turkey. The problems with large scale testing were examined.
Transportation, security issues, and anxiety of once a year exams were the main topics to discuss regarding the problems of large scale testing in Turkey. After all, the idea of adaptive test was explained.
23
Next, the definition of CAT was given to express information about it. Advantages of CAT were explained to underline the comparability of CAT with P&P of SSE. Moreover, the theory behind it was detailed. The comparisons between IRT and CTT were given and on the basis of currently available evidences from the literature, IRT were highlighted with many advantages. In this study, EAP and MLE were used to examine different results and to find the optimum CAT strategy. For this reason, different ability estimation methods were detailed under the light of literature. Different test termination rules were given from the literature and the main theoretical premises behind test termination rules were detailed.
To conclude, in this chapter, the situation of P&P based large scale exams and CAT as an alternative to P&P tests was emphasized. CAT was presented as a good
alternative to P&P tests. Since there is little research in Turkey about CAT, this study fills an important gap for future test developments.
24
CHAPTER 3: METHOD Introduction
This chapter explains the methodology of the thesis. This study aims to investigate the applicability of CAT as an alternative to P&P testing with regard to the SSE in Turkey. In this section, there are six main parts. In the first section, research design was described. Then in the second section information context and in the third section sampling of the study were given. After that in the fourth section instrumentation of the study was provided. In the fifth section method of data collection and lastly in the sixth section the method of data analysis were detailed.
Research design
This study utilized quantitative methodology based on simulations. Descriptive research design was used to investigate results obtained from real data and
simulations. Results were presented in a descriptive manner rather than conducting statistical comparison analyses since this is one of the earliest attempts regarding CAT implementations.
Context
In this study, students‟ responses to the science subtest of SSE were used.SSE2005 science items were obtained via official permission of the ÖSYM in 2005 without any ID or information that can be used to identify students. The present study includes different methods of comparability for SSE between CAT and the P&P versions. According to the literature, there are many methods to analyze
comparability of CAT and P&P tests (Wan et al., 2009; Wang & Kolen, 2001). In this study, fixed length and fixed standard error methods were used together with
25
different ability estimation methods. Post-hoc simulation was used for applying these methods and new data was generated based on 2244randomly chosen real examinee responses. Responses belong to the students who took the SSE 2005 at Grade 12 (the last year of high school). The SSE 2005 had two phases but this study focuses on only the first phase of the national exam. Science items were used for generating post-hoc simulation results. Based on the results from the simulation, the
comparability of CAT and SSE P&P version would be investigated.
Sampling
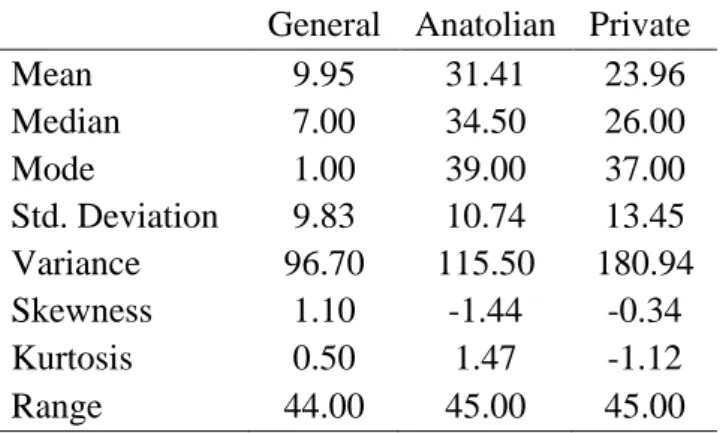
The data used in this research is obtained from ÖSYM. The data set belongs to year 2005 and it contains student responses to 45 science items. The sample size was 2244 students. The sample included only students who took the SSE2005 at Grade 12 (the last year of the high school) and those who gave at least one response to the science items. Beyond all, three school types are included: general, Anatolian and private high schools. These schools were included to represent different ability levels based on the mean scores obtained from SSE 2005 science sub-test (Table 2). General high schools had the highest percentage in terms of number of students for the sample of the study. These three school types followed the same national curriculum.
Vocational and technical high schools were not considered for this study because these schools have extremely low means. But the school types in this study have relatively higher means.
As can be seen from Table 1, the mean of the total scores out of 45 science items is 18.31 for the sample of this study. In chapter 1, the mean scores were given
including all students who took SSE 2005.In this study, only general, Anatolian and private schools were included.
26
Table 1
Descriptive statistics of total science scores of SSE 2005 (N=2244) Mean
Standard
Deviation Skewness Kurtosis Total_scores 18.31 14.41 .05 -1.41
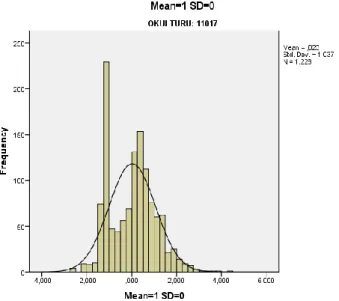
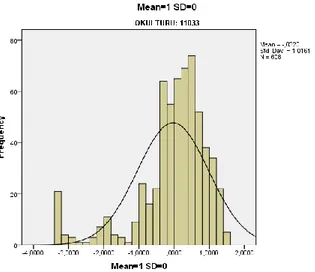
Figure 2 shows the distribution of total scores of SSE 2005. As can be seen from the figure, there are many students who had total scores that equal to 0. Table 2 shows that the median values of total scores for the 2005 science subtest are 7, 34.5 and 26 for general, Anatolian and private high schools, respectively. Anatolian schools have the highest total scores whereas general high schools have the lowest total scores.
Figure 2. Distribution of total scoresof SSE 2005 (N=2244)
Table 2
Statistics of total scores of general, Anatolian and private high schools of SSE 2005 (N=2244)
General Anatolian Private
Mean 9.95 31.41 23.96 Median 7.00 34.50 26.00 Mode 1.00 39.00 37.00 Std. Deviation 9.83 10.74 13.45 Variance 96.70 115.50 180.94 Skewness 1.10 -1.44 -0.34 Kurtosis 0.50 1.47 -1.12 Range 44.00 45.00 45.00
27
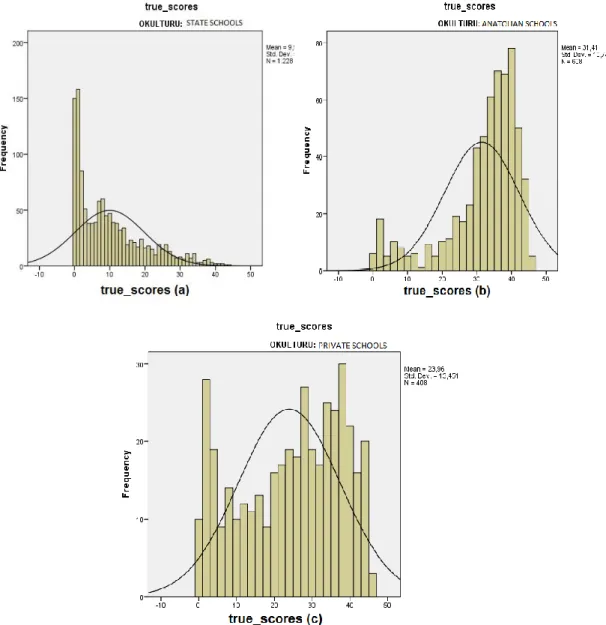
In Figure 3, it can be seen that general high schools have many students who have 0 out of 45 items. On the other hand, Anatolian school students have total scores around 30to 45. Evidently they represent the highest achievers.
In Table 3, it can be seen that the percentages of true responses for each item level are 63.4 maximum and 15.7 minimum. Missing items are the ones that were left blank by the examinees. The maximum percentage of missing items equals 52.5, which is very close to maximum value for the percentages of true responses on item
Figure 3. Distribution of total scores of general (a), Anatolian (b) and private (c) schools(N=2244)
28
level. On these grounds, it can be argued that science items are very difficult to answer. This leads to an important discussion regarding the mismatch of the ability levels of students and difficulty of items. Most of the students do not prefer blind-guessing since four wrong answers erase one of the correct responses. Students prefer not to answer and leave the items blank. This situation creates a high
percentage of missing values and low percentage of total scores. To summarize there are notable differences between the difficulty of the science items and the ability of test takers.
Table 3
Percentages of true, false and missing of 45 science items Question
numbers
True False Missing Question numbers
True False Missing
1 57.0 16.2 26.8 23 30.7 16.8 52.5 2 15.7 51.4 32.9 24 44.5 11.9 43.6 3 54.7 17.1 28.2 25 29.2 28.9 41.9 4 62.1 14.3 23.6 26 26.0 41.7 32.3 5 39.0 35.3 25.7 27 39.3 16.0 44.7 6 27.1 30.8 42.1 28 22.0 36.5 41.5 7 47.5 23.2 29.3 29 30.5 23.8 45.7 8 44.6 20.2 35.2 30 45.5 16.4 38.1 9 48.1 25.3 26.6 31 48.6 18.4 33.0 10 22.3 46.6 31.1 32 46.3 20.6 33.1 11 40.9 37.7 21.4 33 42.8 19.6 37.6 12 54.7 18.8 26.5 34 49.4 17.3 33.3 13 46.6 24.1 29.3 35 47.8 20.6 31.6 14 56.3 15.2 28.5 36 40.5 15.2 44.3 15 43.2 25.9 30.7 37 22.3 35.4 42.3 16 31.1 24.8 44.1 38 36.8 30.5 32.7 17 38.2 30.4 31.4 39 41.5 13.8 44.7 18 63.4 15.0 21.6 40 25.9 29.8 44.3 19 36.1 26.3 37.6 41 24.0 36.8 39.2 20 52.4 21.7 25.9 42 44.8 18.2 37.0 21 56.5 16.0 27.5 43 24.5 32.5 43.0 22 44.3 28.9 26.8 44 40.9 19.5 39.6 45 45.6 16.4 38.0
29
Instrumentation
The instrument of this study is the science sub-test items, which belongs to the first phase of SSE 2005. There were 45 science items in the SSE 2005. It consisted of 19 Physics, 14 Chemistry and 12 Biology items. This study focused on only the first phase of the SSE 2005 which is used for selection. It is stated in the SSE booklets that the aim of the test is to measure basic comprehension and thinking skills of students in science (ÖSYM, 2005).
Method of data collection
No data were collected for this study. Data sets including students‟ responses to science subtest were provided by the ÖSYM.
Method of data analysis
Since the CAT format requires item parameters defined in IRT, first, data sets were calibrated to obtain parameters for each item with respect to the three-parameter model (3PL): pseudo guessing, item difficulty and item discrimination. BILOG-MG (Zimowski, Muraki, Mislevy, & Bock, 1996) program was used for calibration of the items. But before that data were converted to dichotomous format: correct scores were coded as 1, while the wrong ones 0. After defining item parameters, a series of post-hoc simulations were conducted. In these simulations, a testing environment was simulated as if students were given a CAT test, using their responses they gave earlier for the P&P test.
Post-hoc or real data simulations consider real examinees responses that have been administered conventionally. The aim is to reduce the number of items given by SSE 2005 P&P exam. In this case the item pool was generated by the same items with
30
SSE 2005 science sub-test and the data which was the responses of real examinees were analyzed. The software for post-hoc simulation was developed by Kalender (2011).
The working principle of post-hoc simulation is as follows:
When the simulation starts, the computer picks the item for the examinee and then checks the response of the item for the same examinee from the P&P data since the items were used before in a conventional P&P test.
Then the computer picks another item based on pre-determined item selection rules and checks the response of the examinee for that item.
Items are chosen according to Maximum Information which means selected items have to gather the highest information.
The computer does the same thing until it obtains pre-determined test termination rules. In this case it is fix length and fixed standard errors.
After the simulation phase, several analyses were conducted to investigate the results.
First, numbers of items given to examinees under different post-hoc simulation were presented then the findings were interpreted. Next, correlations were calculated between the results obtained from CAT and P&P test based on different ability estimation methods and test stopping conditions. Ability levels for general, Anatolian and private schools were compared under fix length and fixed standard error test termination conditions. In addition, distributional features of all school types‟ ability estimates from CAT simulations and P&P test by MLE and EAP were presented. Then, distribution of standard error values for fixed items under the two ability estimation methods were given to compare results based on the school types. Last, the number of examinees whose scores were not calculated by MLE provided.
31
In this study, different school types (general, Anatolian and private) were investigated since they represent different ability groups. Two ability estimation methods were used for this study. They are MLE and EAP.
Different standard errors and different text lengths were used as test termination rules. By using scores from different administrations of CAT simulations, the comparability of SSE with CAT was identified. Recent studies showed that comparability of scores from different testing formats should be considered and checked by using appropriate methods (Vispoel, Rocklin, & Wang, 1994; Wang, 1997; Wang et al., 2007, 2008).
Test termination rules were used to end the test when enough information is gathered to estimate ability. Two different test termination rules were used to conduct this study. Fix length and fixed standard error (SE) were used as test termination rules; MLE and EAP were used as ability estimation methods. In fixed length tests, a fixed number of items is given to examinees. In this case, 10, 15 and 25 items were used to create the CAT format of SSE. In this way, different SEs were obtained. SE
measures accuracy in a test. SE is the mean of the standard deviation of the sampling distribution. When SE increases, reliability decreases. For this purpose, SE 0.30, 0.20 and 0.10were used as fixed SE test termination rule. In CTT, these values correspond to 0.91, 0.96 and 0.99 reliability values. As a result, simulations were conducted by changing ability estimation methods (MLE and EAP) and test termination rules (SE=0.30, 0.20, 0.10 and fixed number of items: 23%, 33% and 55% of the P&P test) for each of the three school types.
Summary
This chapter consisted of six main parts, namely research design, context, sample, instrumentation, data collection and data analysis procedures. The first part provided
32
information about the type of research design used in the study and to find the possible answers to the research questions. The second part provided information about the context information of the study. The third part focused on the sampling strategy of this study; also gave detailed information about the school types, and students‟ scores. The fourth part, instrumentation, explained the tool used for the study. The fifth part focused on data collection methods. The sixth part examined how data were analyzed and reported for each research question.
33
CHAPTER 4: RESULTS Introduction
This chapter gives information about the results of the current study. The results from different post-hoc CAT simulations and their comparisons to P&P tests are detailed here. Thus, research questions were analyzed sequentially. This chapter consists of six main sections. In the first section, important findings about reduction in the number of items by CAT were detailed compared in order to find the optimum strategy. The results under different test termination rules were given in order to find the optimum strategy (see Table 4). In the second section, ability estimations
obtained from two different methods, EAP and MLE, by CAT were compared with the ability estimations obtained from SSE P&P2005 and investigated to see if there was a correlation between CAT and P&P of SSE in terms of ability estimations. In the third section, ability estimations obtained from CAT and SSE P&P 2005 test were compared to see the difficulty levels of the tests. In the fourth section, distribution of scores was presented according to the school types. In the fifth section, the fixed length test termination rule was applied to examine which one produced less SEs. Finally, the issue of non-convergence was analyzed by MLE and the findings were presented.
In this chapter, the results were given in the order of the research questions stated in Chapter 1.
Is there any reduction in the number of items required by CAT?
For standard error threshold-based post-hoc simulations, number of items was investigated to assess if there was any reduction, which was provided in test length
34
by CAT. The numbers of items given to examinees in post-hoc simulations under different CAT strategies can be seen in Table 4.
Table 4
The numbers of items given to examinees under different CAT strategies
SE is important since it gives information about the reliability of a test. If SE
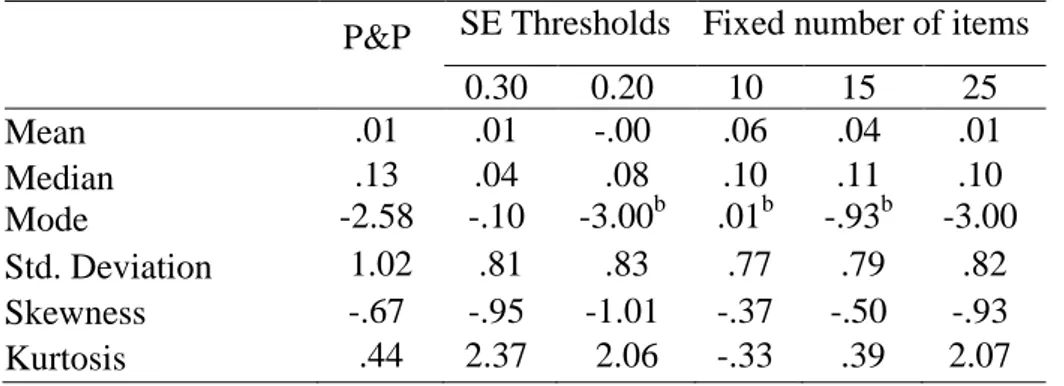
decreases, the reliability of the test increases. As expected, number of items required to finish CAT increased with required level of SE decreased. For instance, SE 0.10 is equal to 0.99 in CTT. 0.99 represents the maximum reliability but it required 45 items in simulations. Evidently SE 0.10 is not working for tailored test simulations since it required the full length in P&P test, 45 items. For this reason, SE 0.10 was not used for further analysis.
Table 4 presented that SE threshold with 0.30 and 0.20 required 5 and 7 items
administrated for general high schools. This means that general high schools by MLE estimates required fewer items than the others, but the number of items fewer than 10 may not be enough for a test due to the validity issues. On the other hand, EAP required more items than MLE for all SE thresholds hence SE with 0.30 and 0.20 results by EAP required 13 and 26 items for general high schools, respectively. SE 0.30 by MLE used 8 items whereas SE 0.20 by MLE used 23 items for Anatolian schools. Anatolian schools required more items in contrast to general high schools in all tested conditions. In fact, Anatolian schools contain successful students so those
Ability Estimation Method
MLE EAP SE Threshold SE Threshold School Type 0.30 0.20 0.10 0.30 0.20 0.10 General 5 7 45 13 26 45 Anatolian 8 23 45 15 29 45 Private 8 22 45 25 45 45
35
schools were expected to have more reliable results than general or private high schools.
As seen in Table 4, SE 0.30 by EAP used 15 items for private schools whereas SE 0.20 administrated 29 items. SE 0.20 by MLE used 22 items whereas SE 0.30 required 8 items. Unfortunately SE 0.20 by EAP did not work for private schools since it required 45 items. SE 0.30 by EAP used 24 items which can be acceptable for CAT applications. At last, SE thresholds showed that for EAP and MLE ability estimations of SE 0.30 required fewer items than SE 0.10. In general Table 4
presented that EAP required more items than MLE and general high schools had the lowest mean across all tested conditions.
Is there a correlation between ability estimates obtained from CAT and P&P tests?
Table 5 shows the correlations between ability estimates obtained from CAT simulations and P&P test for all the different conditions based on different ability estimation methods and test termination rules. Simulation results of different conditions are MLE/EAP and SE thresholds /fixed item are given in Table 5.
A closer look at the data indicated that general high schools demonstrated lower correlation whereas private schools had the highest correlation for both ability estimation methods and test termination rules. The table yielded by this study provided convincing evidence that correlation between ability estimates by EAP method are much larger than MLE. In fact, MLE had the lowest correlation for general high schools. On the other hand, EAP had more stable results and showed higher correlation for both general high schools and other school types. According to the results given in Table 5, EAP, regardless of test termination rules, seemed to
36
work better in ability estimation. In addition, correlations between estimates for EAP were invariant for all conditions such as different school types and test terminations
Table 5
Correlations of ability estimates between CAT and P&P
MLE EAP
SE
Threshold Fixed Item
SE
Threshold Fixed Item 0.30 0.20 10 15 25 0.30 0.20 10 15 25 General .71 .74 .75 .73 .80 .93 .95 .91 .94 .97 Anatolian .88 .97 .91 .96 .98 .97 .98 .95 .96 .98 Private .96 .99 .93 .96 .99 .98 .98 .96 .97 .98
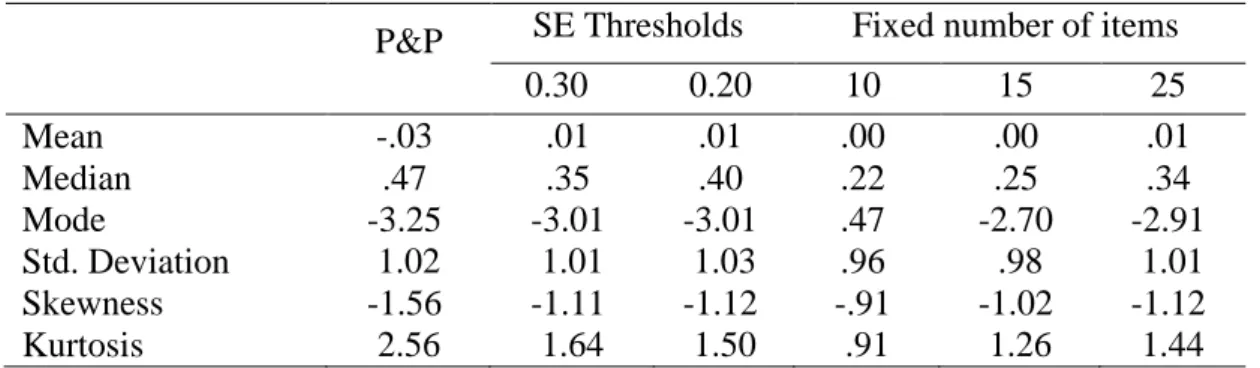
The data generated by MLE was also reported in the Table 5. This table showed that MLE produced a variety of correlations for all tested conditions. Differences were visible especially for Anatolian schools under different SE thresholds. As seen in Table 5, when the number of items increased, correlations between estimates for both MLE and EAP also increased. These results developed the claim that EAP estimation method showed higher correlations which were more than 0.90 in all tested
conditions. Therefore, EAP can be a better choice for ability estimation method in using the adaptive version of SSE.
Is there any difference in difficulty between the CAT and P&P tests?
Table 6 presents medians of ability distributions obtained under different post-hoc simulations (since the ability distributions were skewed, median was preferred). The data from post-hoc simulations showed that ability estimations for pre-determined SEs were invariant for both ability estimation methods. Fixed length test results presented that the EAP ability estimations may slightly differ from each other. Also MLE estimates were lower as compared to EAP estimates. It seems that Anatolian
37
and general high schools were provided slightly harder test by MLE than it was by the conventional P&P test.
Table 6
Median of ability estimates based on different post-hoc simulations School
Type
Ability Estimation
Method
P&P SE Threshold Fixed Number of Items
0.30 0.20 10 15 25 General MLE .63 .65 .57 .57 .56 .61 Anatolian .08 -.18 -.12 -.19 -.14 -.11 Private .13 .04 .08 .10 .11 .10 General EAP .69 .38 .42 .28 .34 .42 Anatolian .47 .35 .40 .22 .25 .34 Private .38 .36 .41 .26 .24 .35
Table 6 showed that there was a difference between CAT and P&P ability estimations. Results indicated that CAT-based ability estimates were lower than those from P&P, indicating CAT delivered more difficult test to examinees.
However, it should be noted that ÖSYM uses a different calculation method for the P&P format of SSE. Ability estimates are calculated based on correct and incorrect responses. The ÖSYM erases one true answer for four false answers in order to obtain more reliable scores but CAT uses different methods to calculate ability estimations.
Are there any differences in terms of score distributions obtained from CAT and P&P test?
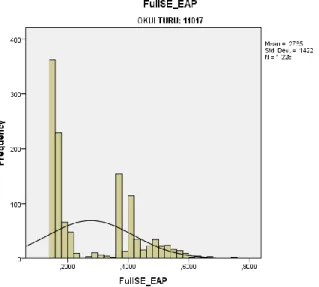
Distribution of both CAT and P&P ability estimations by MLE obtained from general high schools
Table 7shows the distribution of both CAT and P&P ability estimations by MLE obtained from general high schools. The findings of the CAT simulations were relatively different from P&P ability estimations. On the other hand, both SE