© 2006 University of Sydney. All rights reserved. www.arch.usyd.edu.au/asr
*Department of Interior Architecture and Environmental Design, Bilkent University, 06800 Bilkent, Ankara, Turkey
†Corresponding author. Tel.:+90-0312- 290 2592; Fax: +90-0312- 266 4136 E-mail:[email protected]
Introduction
One of the main goals of architectural acoustics in the case of multi-purpose auditorium, which is the gathering place for speech and music performances, is to provide both the optimum speech intelligibility and the sound quality [1, 2]. The greatest challenge that the designer confronts at this point is to accommodate both unamplifi ed music and unassisted speech within the same place, which is especially much diffi cult for the halls with seating capacities exceeding 2000 or circular in form as in the case of Bilkent Amphitheater [3, 4, 5].
The Acoustical Performance Analysis
of Bilkent Amphitheater: Proposal for
Acoustical Renovation
The Amphitheater with 4000 seating capacity was designed to serve the university’s and the city’s educational and artistic activities, which are comprising both the music and speech performances including concerts, operas, dance and stand-up shows, theaters, conferences and graduate ceremonies. The Amphitheatre’s architecture, while reminiscent of a clas-sical Roman amphitheater, highlights the features of high technology with its steel structure roof covered by a textile membrane, besides glass and a cable network system. Consequently, the architectural form is a synthesis of two architectural styles separated by 2000 years. “Both in terms of its original form and dimensions, and the combined use of three different modern load bearing structures, Bilkent Amphitheater is the fi rst of its kind” [6]. Although, the form and the synthesis of architectural styles results in an innovative building typology, the same reasons lead to a problematic acoustical space. The purpose of this paper is to determine
Zühre Sü
*and Semiha Yılmazer
*†Received 21 April 2005; accepted 7 November 2005
The 4000 seat multi-purpose Bilkent Amphitheater is a semi-closed amphitheater with a volume of 90,000 m³, designed to serve the University’s and the city’s edu-cational and artistic activities. At the beginning, the amphitheater was designed only for open-air performances. Afterwards it was decided it would be roofed with a tensile membrane in order to protect the spectators from atmospheric effects. However, the covered amphitheater was turned into a resounding and a problematic place with a reverberation time of more than 6 s. when the hall is unoccupied. Acoustical interventions were implemented, but these have not been suffi cient in decreasing the number of problematic echoes and dead spots. This paper analyzes the hall by means of assessing the fundamental acoustical parameters for both speech and music. Parameters such as reverberation time, early decay time, clarity, defi nition, lateral fraction, strength and speech transmission index were calculated by the aid of ODEON Room Acoustics Program simulation software Version 6.01. It was observed that most of the parameters are out of the optimum range, and that the sound focused strongly in some locations. After further acoustical renovation of the hall, the distribution of sound became more homogenous as measures of most of the parameters fell into reasonable ranges.
������������������������������������������������������� ������������������������������������������������������������� ���������������������������������������������������������������� ������������������������������������������������������������� �������������������������������������������������������������������������� ������ ��� ������������ ��� � ������� �������� ������ ��� ��� ������� ��������� ������ ��������� ������������ ����������������������������������������������������������������������������� �������������������������������������������������������������� ������������������������������������������������������������������������������������� ��������������������������������������������������������������� ��������������������������������������������������������������������������� �������������� ������������������������������������������������������������������������������������������� ����������������������������������������������������������������������� ����� �� ��� ���� ��� ��� ��� ������ ��� ������ ������� ������ ���������� ��������� ����� ������������������������������������������������������� ������� ��������������������������������������������������� �����������������������������������������������
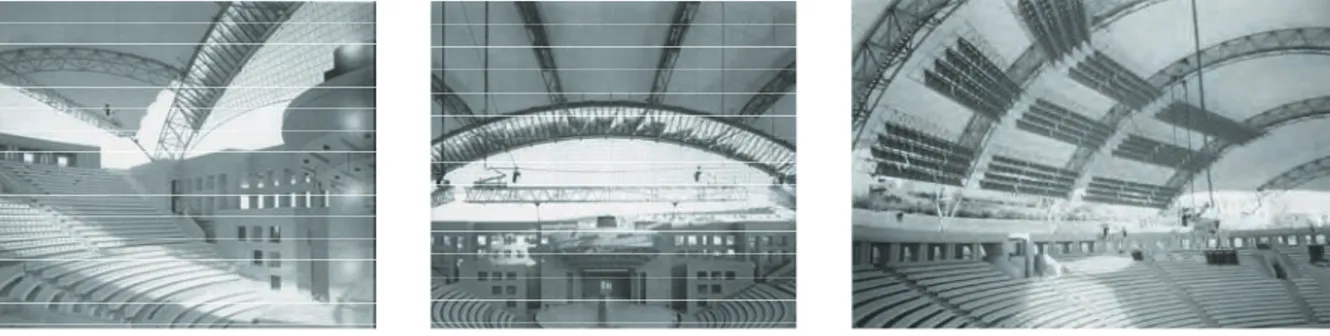
Figure 1: Exterior views from Bilkent Amphitheater. ������������������������������������������������������� ������������������������������������������������������������� ���������������������������������������������������������������� ������������������������������������������������������������� �������������������������������������������������������������������������� ������ ��� ������������ ��� � ������� �������� ������ ��� ��� ������� ��������� ������ ��������� ������������ ����������������������������������������������������������������������������� �������������������������������������������������������������� ������������������������������������������������������������������������������������� ��������������������������������������������������������������� ��������������������������������������������������������������������������� �������������� ������������������������������������������������������������������������������������������� ����������������������������������������������������������������������� ����� �� ��� ���� ��� ��� ��� ������ ��� ������ ������� ������ ���������� ��������� ����� ������������������������������������������������������� ������� ��������������������������������������������������� ����������������������������������������������� www.earthscan.co.uk/journals/asre doi:10.3763/asre.2006.4923
Architectural Science Review Volume 49, Number 2, June 2006
168
Architectural Science Review Volume 49, Number 2, June 2006
168
Architectural Science Review Volume 49, Number 2, June 2006
the acoustical performance of the amphitheater with this covered form. The emphasis is on the cause and effect relations depending upon the materials, construction and the size generated by the roof.
Similar to those Roman theaters of the Antiquity, the Bilkent Amphi-theater has in plan a semicircular shape [7, 8]. It has a radius of 48 meters corresponding nearly 100 meters in diameter and 18 meter height ap-proximately from the stage to the top of the main arcade at the back of the seating area (Figure 1 and 2). The amphitheater is built in reinforced concrete and all surfaces of the walls and staircases are clad with travertine plates. The front and inner face of main arcade at the back of the seating area is smooth unpainted concrete. The columns of this area are also clad with travertine, which are stripped vertically. The stage is partially covered with travertine, whereas the movable part that forms the pit is wooden fl oor on joists. The wooden canopy over the stage has a cavity fi lled with mineral wool.
The system of the roof structure is namely a large reticulated spatial steel structure, as shallow as possible, to be covered by a membrane. What is decisive and artistic, is the request of the Architect to isolate this modern roof from the theater building with its antique Roman style. The design consists of a steel truss system cladded with a pre-stressed membrane of PVC-coated brand polyester fabric, which is creating a half dome over the amphitheater. In front of the theater building, the main steel arch truss with 118 m span ascends with 15° inclination against the vertical direction up to 35.5 m height. At the vertex, it does not touch the building at any point. The height of the key cross section is of the main arch is 49 m. By the way, the rigid and highly refl ective surface of tensile roof membrane has been the basis of the acoustical defects at the hall while creating an excessive volume of 90,000 m³.
The acoustical system of the hall includes the canopy, which is an acousti-cal refl ector above the stage area in order to refl ect sound on to the audience and back to the performers. The acoustical grid bridges are constructed after the building has fi nished, and tested for its acoustics as a precaution
against too much reverberance inside the hall. The sound absorbing acoustic fabrics, which are attached in between these acoustic bridges, are the main elements of this construction to satisfy the proper acoustical quality at the hall by absorbing the excessive sound energy especially at high frequencies (Figure 3). Nevertheless, this treatment has not satisfi ed the desired acoustical quality at the hall.
Measuring Method
Akukon Oy Consulting Engineers, Finland, carried out the real-size measurements when the hall was unoccupied, in order to fi nd out
�������������������������������������������������������
�������������������������������������������������������������
����������������������������������������������������������������
�������������
������������
������������������������������������
��������������������������������������������������������������������������
������ ��� ������������ ��� � ������� �������� ������ ��� ��� ������� ��������� ������ ���������
������������
�����������������������������������������������������������������������������
��������������
������������
������������������������������������
�������������������������������������������������������������������������������������
���������������
������������
������������������������������������
���������������������������������������������������������������������������
��������������
�������������������������������������������������������������������������������������������
�����������������������������������������������������������������������
����� �� ��� ���� ��� ��� ��� ������ ��� ������ ������� ������ ���������� ��������� �����
�������������������������������������������������������
�������
���������������������������������������������������
�����������������������������������������������
Figure 2: Section view of Bilkent Amphitheater.���������������������������������������������������
������ �� �������� ������ ��� �������� ��������� ��� ��� ���������� ����� ��� ��� ���������
�������������
Figure 3: Interior views from Bilkent Amphitheater.
���������������������������������������������������
������ �� �������� ������ ��� �������� ��������� ��� ��� ���������� ����� ��� ��� ��������� �������������
Figure 4: Selected source and receiver locations for the unoc-cupied hall, for the real-size measurements.
the values of different acoustical parameters involving reverberation time (RTreal), early decay time (EDTreal), clarity (C80real), and defi nition (D50real). The acoustical parameters were calculated from the MLSSA measurement fi les [9]. MLSSA is a PC based acoustic measuring system and analyzer for the measurement and evaluation of room acoustics. It employs a Maximum-Length Sequence (MLS) for the excitation signal as a preferred alternative to the conventional white noise stimulus. This MLS signal technique measures the impulse response, which is the most fundamental descriptor of any linear system, and from that, a wide range of important acoustic indicators can be determined through computer aided post processing. The measurement was in agreement with ISO
3382 in terms of equipment [10, 11]. The MLSSA confi guration was; 64 K samples-sequence, samples frequency 20 kHz and bandwidth 5 kHz. The microphone was a Bruel&Kjaer type 4006 omni directional micro-phone. Microphone and loudspeaker height was 1.2 m above ground. Measurements were made for two different source and eleven receiver locations (Figure 4).
Reverberation time (RT
realReverberation time (RT
realReverberation time (RT ) and Early Decay Time (EDT
realreal) and Early Decay Time (EDT
) and Early Decay Time (EDT
) and Early Decay Time (EDT )
realrealrealreal)
The Figure 5 shows that the EDTreal values are lower than the RTreal ones. While the mid frequency values are much closer to each other, it is obviously seen that at lower and especially at higher frequencies there are big differences between the two parameters. However, it should not be higher than ±10% for the conditions of good acoustics. The big differences of EDTreal from RTreal imply bad distribution of sound in the room, whereas the value to be smaller than the RTreal implies that there are surfaces that direct the early refl ections on to the audience. A hall to be considered as good, generally has to have EDTreal 0.5 s higher than RTreal at mid frequencies. The RTreal graph with higher values at high frequencies implies that there are surfaces, which are highly refl ective at high frequencies and clearly the main reason for the focuses around the hall. The different values at the EDTreal with an average minimum of 3.75 s and an average maximum of 5.87 s is caused by the remoteness of the surfaces in this large hall, as the EDTreal is chiefl y depends on the room geometry and distinctness of the absorptive and the refl ective surfaces [14, 15].
Clarity (C80
realrealreal) and Defi nition (D50
) and Defi nition (D50
realrealreal)
)
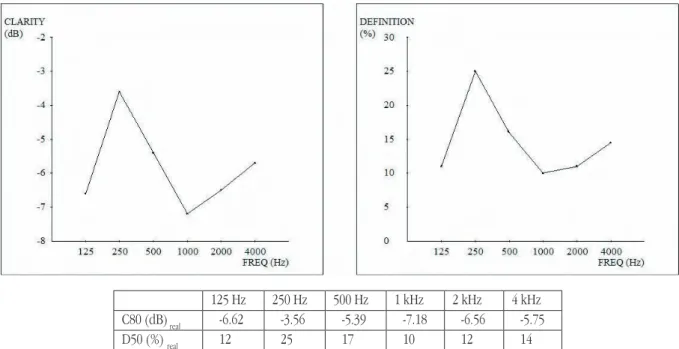
The abrupt jumps of the values including both the rises and falls at specifi c points are illustrating an ineffi cient clarity for the overall condition of the hall. The clarity values appear to be best at mid sides that are closer to the limit value, while it is worst at the central part of the mid tiers among the others. On the other hand, the results show that none of the seating points of measurements is in the acceptable range for clarity. The defi ni-tion illustrates one of the worst distribuni-tions of the sound throughout the hall. It is below % 20 in most of the seating places (Figure 6).
������ ������ ������ ����� ����� �����
�����
��������
����
����
����
����
�����
������
��������
����
����
����
����
����
������ �� �������� ������ ��� ��
������� ���
������� ����������� ���� ��� �� ���� ��� ������
��������������������������������������������
���
��
���
��
������
�����
�����
�����
��������
����������
�����
�����
�����
�����
�����
��������
������
��
��
��
��
��
����������������������
������������
�������������������������������������������������
125 Hz 250 Hz 500 Hz 1 kHz 2 kHz 4 kHz C80 (dB) real -6.62 -3.56 -5.39 -7.18 -6.56 -5.75 D50 (%) real 12 25 17 10 12 14Figure 6: Measured C80realrealreal and D50 and D50 real real real values for frequencies from 125 to 4000 Hz. values for frequencies from 125 to 4000 Hz.
������ ������ ������ ����� ����� �����
�����
��������
����
����
����
����
�����
������
��������
����
����
����
����
����
������ �� �������� ������ ��� ��
������� ���
������� ����������� ���� ��� �� ���� ��� ������
��������������������������������������������
���
��
���
��
������
�����
�����
�����
��������
����������
�����
�����
�����
�����
�����
��������
������
��
��
��
��
��
����������������������
������������
�������������������������������������������������
125 Hz 250 Hz 500 Hz 1 kHz 2 kHz 4 kHz RT(s)real 6.33 6.22 6.48 6.86 7.97 10.17 EDT(s)real 3.75 5.26 5.82 5.87 5.16 4.73Figure 5: Measured values for RTreal Figure 5: Measured values for RTreal
Figure 5: Measured values for RT and EDTrealreal and EDT and EDT and EDT for frequencies from realrealrealreal for frequencies from 125 to 4000 Hz, shaded area: optimum RT for multi-purpose [12, 13].
Architectural Science Review Volume 49, Number 2, June 2006
170
Architectural Science Review Volume 49, Number 2, June 2006
170
Architectural Science Review Volume 49, Number 2, June 2006
Background Noise
The background noise for Bilkent Amphitheater is measured with the Brüel&Kjaer Sound Level Meter Type 2230 when the hall is empty and the continuous equivalent sound level of Leq=36.4 dBA is recorded. This corresponds to NC-25, which approximately falls into the recommended range for good listening conditions for large auditoriums [16].
Computer
Simulation of
the Hall
The technological developments of the recent years have affected the fi eld of architectural acoustics by means of measurement techniques. The previous methods of scale models and hand calculations have left their place to a much practical and realistic methods of computer simulations. The simulation tech-nique is used both for the acoustical calculations of the completed build-ings and in assessing and modifying the acoustical characteristics of a place in the phase of design.
The computer simulation of the hall for the unoccupied condition
is performed using ODEON 6.01 software package, which is released by technical University of Denmark [17]. The calculation method of the software is based on prediction algorithms including image-source method and ray tracing, which allows reliable predictions in modest calculation times. Besides the geometrical approach, the statistical properties of the room’s geometry and absorption are also proven effi cient in the ODEON Room Acoustics Program [18].
A comparison of the real-size measurements for the unoccupied hall to computer modeling in the same condition of occupancy verifi ed the feasibility for using of computer simulation for the 500 and 1000 Hz bands. The second simulation is made for the fully occupied (present) hall, which is much crucial as much closer to the real conditions. The parameters involving reverberation time (RTpres), early decay time (EDTpres), clarity (C80pres), defi nition (D50pres), lateral fraction (LF80pres), speech
transmis-�������������������������������������������������������
�������������������������������������������������������������
Material 63 Hz 125Hz 250Hz 500Hz kHz1 kHz2 kHz4 kHz8 ScatteringFactor
Smooth concrete 0.01 0.01 0.01 0.02 0.02 0.02 0.05 0.05 0,1
Marble (travertine) 0.01 0.01 0.01 0.01 0.01 0.02 0.02 0.02 0,2
Wooden fl oor 0.15 0.15 0.11 0.10 0.07 0.06 0.07 0.07 0,1
Glass, single pane 0.08 0.08 0.04 0.03 0.03 0.02 0.02 0.02 0,1
Double glazing 0.10 0.10 0.07 0.05 0.03 0.02 0.02 0.02 0,1
Solid wooden door 0.14 0.14 0.10 0.06 0.08 0.10 0.10 0.10 0,1
Plasterboard 0.30 0.30 0.12 0.08 0.06 0.06 0.05 0.05 0,1 Seated audiences 0.16 0.16 0.24 0.56 0.69 0.81 0.78 0.78 0,5 Drapery 0.03 0.03 0.03 0.10 0.20 0.25 0.25 0.30 0,2 Absorption fabric 0.03 0.03 0.03 0.10 0.20 0.25 0.25 0.30 0,1 Tent fabric 0.70 0.50 0.30 0.10 0.05 0.05 0.05 0.05 0,1 Chair, unoccupied 0.02 0.02 0.02 0.03 0.04 0.04 0.05 0.05 0,2
Table 1: Sound absorption coeffi cients of different materials used in Bilkent Amphitheater.
�������������������������������������������������������
�������������������������������������������������������������
Figure 9: Partial plan view from the fragmented beam surface. Figure 9: Partial plan view from the fragmented beam surface.
������ �� ���� ��� ���� ���� �� ������ ��� �������� ��������� ��� ��� ����� �������� ��������� ������������������������������������������
Figure 7: Plan and side view of source and receiver locations for the fully occupied condition of the hall, from the computer simulation.
Figure 8: Plan and section view for the renovated hall.
sion index (STIpres) and strength (Gpres) are calculated. The results of the fully occupied hall are presented in the paper (see Section 5). An omni-directional point source and a receiver are defi ned, before assigning the materials. In Figure 7, the blue object is implying the receiver and the red one is implying the source location. The receiver and the source are 1.2 m above ground.
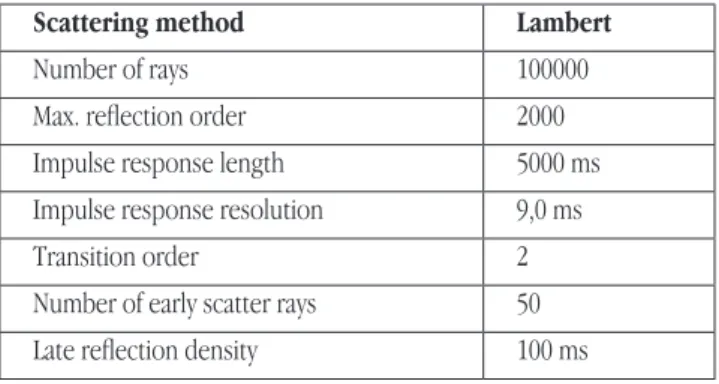
The sound absorption coeffi cients of different materials used in Bilkent Amphitheater are listed in the Table 1. The materials in this list are assigned for the related surfaces within the simulation software. The materials in the list, which the material library of ODEON Room Acoustics Program Version 6.01 is not involving, are added to the library by giving their sound absorption coeffi cients for different frequencies. Assigning the materials, the calculation parameters are defi ned as listed in the Table 2.
After fi xing the calculation parameters, the selected receiver surfaces are divided into grids of 0.90 m. The maps and the cumulative distribu-tion graphs of calculated parameters are obtained for these surfaces. The colored maps of calculated parameters can be found in Appendix. Successively, the tent membrane and the wooden diffuser over the stage are defi ned as the refl ector coverage. According to the given input data, the results of quick estimation and global estimation are evaluated. The refl ector coverage and the grids are calculated in order to obtain the results of different acoustical parameters and their distribution throughout the hall.
Proposal for Acoustical Renovation
of the Hall
The third simulation is made for the acoustical renovation of the hall in fully occupied condition. The parameters involving reverberation time (RTrenrenren), early decay time (EDT), early decay time (EDTrenrenren), clarity (C80), clarity (C80ren), defi nition (D50renrenren), lateral ), lateral fraction (LF80ren), speech transmission index (STIren), strength (Gren) are calculated. The results of the renovated hall are presented in Section 5.
The echoes and the uneven distribution of the sound are the major acoustic problems of the hall. These are caused by the rigid surfaces with very refl ective characteristics, and the semi-round space in Bilkent Amphitheater including both the roof construction and the hall shape. It is known that the major surfaces in an auditorium generally has acoustic implications. Moreover, as Bilkent Amphitheater is not a closed place, some environmental factors such as wind and rain are eliminating some precautions to be taken acoustically. The remaining reasonable acoustical renovations to be suggested are discussed under four different groups. • Reorienting the fabrics hanged on acoustical bridges; the rigid roof membrane and its shape cause the primary defects including sound foci and uneven distribution of sound. The previous precaution against the reshaping of the membrane includes hanging more absorbent materials underneath. However, the sound absorption properties and the orienta-tions of the fabrics are not satisfactory for the acoustic correction of the hall. The roof construction is slightly convex in the cross section, whereas it is closing to a perfect arc in the longitudinal section. The present acoustical fabrics are hanged on parallel to this convex section, whereas the problematic section that causes sound focuses is the opposite one. In this study, the fi rst suggestion accordingly is hanging these absorption fabrics parallel to the concave section, as the concave surfaces focus sound, and are poor distributors of sound energy. In Figure 8, the re-arranged absorption fabrics in between the steel trusses could be observed, while Figure 3 is picturing the current condition. The uneven distribution of
sound in Bilkent Amphitheater is aimed to be improved by this way. • Changing the fabric with a nonwoven; concave surfaces which focus sound on or near the audience are taboo for auditoria for which the treatment is diffi cult in completed buildings. For example, absorbent materials may still refl ect enough that causes problems. For the acoustical bridges to become more effi cient especially for decreasing the excessive reverberation time, the fabrics are suggested to be replaced by nonwoven fabrics, which have much higher values of sound absorption especially at higher frequencies.
• Extending the over-stage canopy; the designer should concern with getting refl ections to the most distant seats with the aid of the refl ectors above the stage, not only to the front of the stage. In a space as large as this it is expected a quieter sound at seats remote from the walls. The uniformity and the minor risks of low sound levels could be obtained by the careful orientation of the stage refl ectors. Analysis of Bilkent Amphi-theater proves that, the central front seats are rated as best throughout the hall, whereas the back seats especially the side backs are worst among the others. Looking at the maps of different parameters the zone of better acoustical quality in the central front is clearly selected (see Appendix). The perimeter of this circular zone is mostly due to the dimension and orientation of the over-stage canopy. Extending this over-stage canopy through sideward and forward, as the limits of the backstage permits, the zone of better acoustical quality is supposed to be expanded (see Appendix). The extended canopy could be observed from the plan and section views in Figure 8.
• Fragmenting the semi-circular beam of the back arcade; diffusing wall surfaces are important for the good distribution of sound among the hall. The concave surfaces cause focusing and echoes [19]. The back arcade is one of these concave surfaces. The suggestion for the arcade is principally breaking up the front beam into smaller scattering surfaces, than the geometrically focused refl ection will turn into a diffuse refl ec-tion. The diffused pattern could be formed by the material called Glass-fi ber Reinforced Concrete (GRC), which is widely used in the exterior facades of the buildings due to its durability against atmospheric effects. The surfaces of the material could also be given different textures which is especially important in the case of Bilkent Amphitheater, as with the textures on the concrete the scattering and accordingly the diffusivity could be increased. The concave beam is fragmented in every 1 m portion. Each element of GRC with a width of 1 m, length of 0.75 m, depth of 0.01 m at the bottom and 0.02 m at the top. It has an inclination towards the audience about 8° and anchored to the beam by a steel frame carcass at the back of the GRC. This fragmentation of the beam could be observed in detail from Figure 8 and 9.
Scattering method Lambert
Number of rays 100000
Max. refl ection order 2000
Impulse response length 5000 ms
Impulse response resolution 9,0 ms
Transition order 2
Number of early scatter rays 50
Late refl ection density 100 ms
Architectural Science Review Volume 49, Number 2, June 2006
172
Architectural Science Review Volume 49, Number 2, June 2006
172
Architectural Science Review Volume 49, Number 2, June 2006
Results
Reverberation Time (T30) and Early Decay Time (EDT)
The global estimation results show that the reverberation time (RTpres) of the hall for mid frequencies is 3.05 s. The value is higher than the limits of optimum reverberation times. The free path distribution graph is much alike the unoccupied hall, so there are jumps in the fi rst fi ve meters which is caused by the refl ected sound at the closer seating area
by the large cut surfaces of the ceiling membrane. The later refl ections are characterized by a dense pattern and a smooth decay in the level of refl ections. The unsmooth decay of the free path distribution graph is indicative of a poorly diffused sound fi eld (Figure 10).
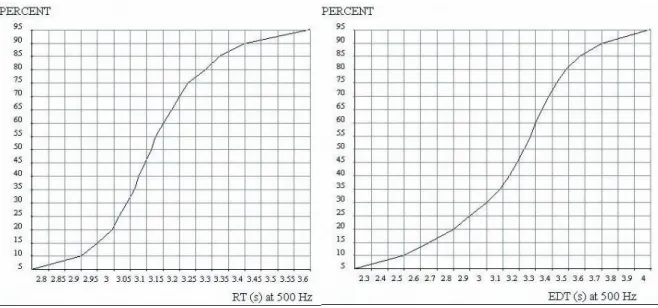
The uneven distribution of the RTpres results is observed in the present (fully occupied) hall (see Appendix-M1). The results are ranging from 2.8 to 3.6 s according to the cumulative distribution function, whereas 3.6 s is covering the 95% of the hall for 500Hz. This value is much higher
Figure 10: Free path distribution graph for fully occupied hall.
Figure 11: RTpres Figure 11: RTpres
Figure 11: RT and EDT and EDT and EDT cumulative distribution graphs.prespres
����������������������������������������������������������������
�������������
������������
������������������������������������
��������������������������������������������������������������������������
����������������������������������������������������������������
�������������
������������
������������������������������������
��������������������������������������������������������������������������
����������������������������������������������������������������
�������������
������������
������������������������������������
than the required measure, especially for the speech activities. The focuses of the sound is less than the unoccupied case due to the audi-ence absorption, however the echoes are still in disturbing amounts (Figure 11). The early decay time measures are ranging in between 2.3 to 4 s, while 95% of the values are around 4 s for 500Hz. Analyzing the map from Appendix-M1, it is found that the values are better in the front tiers especially at the mid fronts and rising towards the back tiers. Besides the focuses all over the hall, the highest values occur at the backsides. These mid frequency values for the EDTpres are also higher than the maximum limit of the optimum range. Being a part of the uneven distribution of sound in the hall, the focuses that are observed all through the hall, are not the only defect. There are also dead points in compare to the live areas at the hall with reverberation times lower than 1s that are in some cases adjacent to the focus points (Figure 11).
The reverberation times for renovated hall are collected from the global estimation calculations. The fi rst improvement is in the mid frequency reverberation time (RTren) that has priority in the assessment of the parameter. The mid frequency reverberation time for the renovated hall, when the hall is in use, is 2.60 s whereas it is 3.05 s in the hall with its present condition (Figure 12). The parameter is still some higher than the upper limits for the concert use but acceptable for liturgical music. It is decreased by 15%. The second issue is the improvement in the warmth or bass ratio of the hall, which is one
of the discussed subjective criteria for music use. The bass ratio, which is the average RTren at 125 and 250 Hz divided by RTren at mid frequencies, is 1.13 for the present hall and 1.21 for the renovated hall. As the lower limit is 1.2 for music performances, the renovated hall is satisfying the criteria [20]. Looking at the overall distribution throughout the hall, it is observed that the fi eld becomes much even. The problematic spots with excessive reverberation times implying echoes and sound focuses are halved, and are seen in the much fewer locations throughout the hall (see Appendix-M2). Coming to the EDTren graphs of the renovated hall, the range is decreased to 1.75 to 3.3 s from 2.3 to 4 s for 500 Hz. This is corresponding to a 17% decrease with some seats in the optimum range, whereas almost none of the seats of the present hall are in the acceptable range for the parameter (Figure 12). The distribution for the EDTren is much dependent on the geometry and the distance from the refl ective surfaces, so it is expected that the parameter will show a higher variety when compared to the reverberation time (RTren).
A typical point is chosen for demonstrating the echo problem from the present condition of the fully occupied hall. At this receiver location (Figure 7), impulse response is observed from the refl ectogram. The unwanted refl ection can be observed from the Figure 13. The time interval between the direct sound and the refl ected sound with similar energy in between 60 and 70 ms, which signifi es an echo. It is known that a speech signal that has an energy nearly as much as the direct sound is perceived as an
echo, when the time interval between the direct and refl ected sounds are greater than 50 ms [12]. The same receiver point with an echo in the present condition of the hall is checked for the renovated hall as well. When the impulse response is observed from the Figure 16, it could be seen that the time interval between the direct and refl ected sound with a similar sound energy is dropped under 50 ms. The value illustrates an improvement in terms of echo formation.
Clarity (C80) and Defi nition (D50)
The clarity cumulative distribution maps and graphs of the present condi-tion of fully occupied hall picture that the values are ranging in between -6 to 2.2 dB, which is including both the acceptable and unacceptable measures for 500 Hz (Figure 15). Analyzing the maps it is concluded that the better values are at the front tiers and at the center of the mid tiers. However, the excessive values including both the lowest and highest measures could be seen throughout the hall apparently at some specifi c points. These peaks of low and high values are sometimes very closer to each other as in the case of center rows of the mid tears (see Appendix-M5). The defi nition illustrates one of the worst distributions of the sound throughout the hall. This implies that the intelligibility of the details of speech, besides the sensation of details in music is insuffi cient for much of the places. The values are ranging in between % 14 to 55 for 500 Hz with 55 at majority, which shows that most of the places are out of the
������ ��� ������������ ��� � ������� �������� ������ ��� ��� ������� ������ ��������� ��������� ������������
�����������������������������������������������������������������������������
��������������������������������������������������������������
Figure 13: Refl ectogram for a typical receiver point, for the present condition (fully occupied) of the hall.
������ ��� ������������ ��� � ������� �������� ������ ��� ��� ������� ������ ��������� ��������� ������������
�����������������������������������������������������������������������������
��������������������������������������������������������������
Architectural Science Review Volume 49, Number 2, June 2006
174
Architectural Science Review Volume 49, Number 2, June 2006
174
Architectural Science Review Volume 49, Number 2, June 2006
optimum range. The values are much higher than the required ones at the front tiers, whereas it reaches to the acceptable values at some places of the mid and back tiers. The uneven distribution is the most important cause for making the parameter not convenient for both speech and music performances (Figure 15).
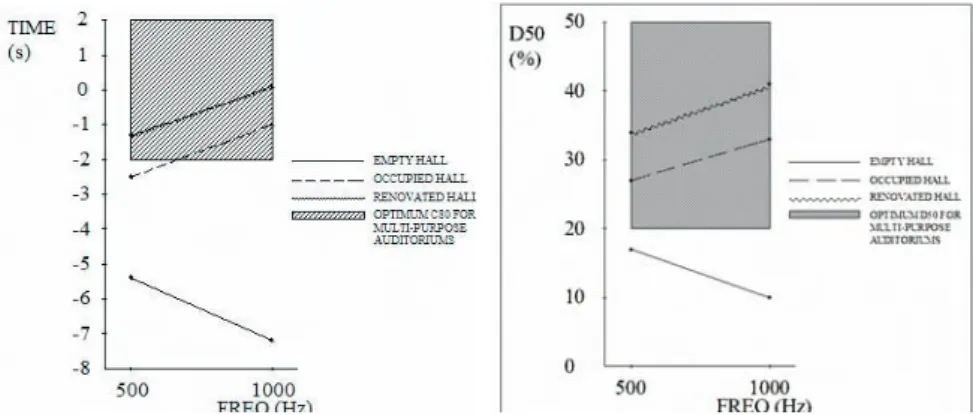
The clarity values of renovated hall are changed from -6 to 2.2 dB to -4 to 2.8 dB for 500 Hz. The ratio of the seats that are falling into the optimum range, especially for the music is increased signifi cantly. The D50ren is ranging from % 20 to 60 in the renovated hall, while in the present hall it is from % 14 to 55 for 500 Hz. None of the seats is falling below the lower limit in the renovated hall, and it becomes especially better for the music performances. The better values for both the clarity and the defi nition are due to the extended canopy, which is providing increased level of early refl ections (Figure 16).
Early Lateral Energy Fraction (LF80) and Speech
Trans-mission Index (STI)
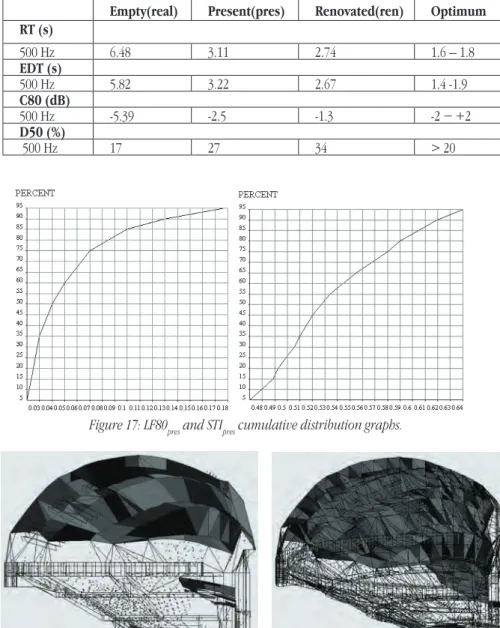
From Figure 17, it can be observed that the LF80presvalues are ranging in between 0.02 to 0.17 for 500 Hz. Examining the distribution maps and graphs, it is found that the LF80 pres values of the present condition of the fully occupied hall in general is smaller than 0.15 in both frequencies. This is not suffi cient for the concert halls as for other activities as well. The better places throughout the hall considering the LF80pres are back and front tier sides, and the back rows of the mid sides (see Appendix-M9). The STIpres values are ranging from 0.48 to 0.63, which are correspond-ing to the fair class for the parameter in general. The results to some
extent are better than the unoccupied hall, which is again related to the audience absorption mostly at the higher frequencies (Figure 17). The maps illustrate that the value is best at the front tiers corresponding to the good class, and in very few points at the mid fi rst row, it is classifi ed as excellent. The sides of the mid tiers are classifi ed as fair, and these areas are better than the centre of the mid tiers. At the back tiers the values continue to drop and in some parts, mostly at the mid parts of the last two rows, it is evaluated as bad and unacceptable for STI (see Appendix-M11) [21].
In the renovated hall, LF80ren is raised at the upper end of the range from 1.7 to 0.22 for 500 Hz. The maps obviously show that the areas with better values at the side rows extend through the central seats, which is most likely due to the enlarged canopy in this case as well (see Ap-pendix-M10). STIren is comparatively better than the other parameters in the present and renovated hall, but as there are many problematic spots when observed from the reverberation time distributions the tolerable values of STIren become masked. Again, in the renovated hall, the values are ranging from fair to good class. There is some increase at the upper limit from 0.64 to 0.68. This time the reverberation time distribution is better than the present hall, and so the STIren is less deteriorated (see Appendix-M12).
Strength (G) and Refl ector Coverage
When an omni directional source type and a power of 31 dB/Octave band is selected from the appropriate Point Source Editor of ODEON software SPL maps show the G results. Especially for symphonic music, G values should be greater than 3 dB [22, 23]. Looking at the maps of the present condition of fully occupied hall, it is obvious that the Gpres values decrease at the mid sides and the decrease continue at all over the back tiers, certainly worst at the back sides. The parameter is satisfactory at front tiers with values higher than 3 dB. The maps and graphs of renovated hall illustrate that the front tiers and the mid tiers except the mid sides are fall-ing into the acceptable range, which is greater than 3 dB. The results are closer to the present condition (see Appendix-M13).
The refl ectors adding the energy of the refl ected sound to the direct sound increase
������ ��� ������������ ��� � ������� �������� ������ ��� ��� ������� ������ ��������� ���������
������������
�����������������������������������������������������������������������������
��������������
������������
������������������������������������
Figure 15: C80pres Figure 15: C80presFigure 15: C80 and D50 and D50 and D50 cumulative distribution graphs.prespres
�������������������������������������������������������������������������������������
���������������������������������������������������������������
���������������������������������������������������������������������������
the sound energy at a specifi c point. If the sound cannot be refl ected to the seating areas adequately, the direct sound might be insuffi cient at the places especially which are far from the stage. The refl ector cover-age display of the simulation is exemplifying that, the sound is mostly refl ected to the fi rst tiers followed by the center rows of the mid tiers at the present condition of fully occupied hall. On the other hand, the frequency of the dots which can be seen from the Figure 18 is decreas-ing through the upper tiers and becomes very scarce at the sides of the mid and the back tiers. This proves that the refl ectors are not designed properly for the sound to be carried all over the seating area equally and suffi ciently. This is also caused by the fan-type plan at which the area is increasing through the back seats and consequently the density of the sound refl ected from the diffusers is being lessened. In order to compare with the present hall, the refl ector coverage for renovated hall is also observed. Figure 18 illustrates that the sides of the mid and back tiers have denser refl ected sound when compared to the present condition, which is defi cient of sound at these seating locations.
Conclusions
The simulation software is used for the assessment of the present con-dition of fully occupied and the renovated halls. The results show that excessive values of reverberation time cause too much reverberance and liveliness throughout the hall, besides the lack of warmth subjectively. Clarity is undermined by excessive reverberance and the sound becomes blurred. On the other hand, the lower values of lateral fraction results in lack of envelopment for the audience subjectively and the lack of room response. Moreover, the music sounds distant or lack of intimacy, and lack fullness of tone. Another aspect is the distribution of sound energy, which shows that the refl ectors are not satisfactory in refl ecting the sound suffi ciently through the hall and the direct sound becomes insuffi cient at some locations as back and mid sides. The intelligibility suffers signifi cantly in some seating locations, which are observed from the speech transmis-sion index results. Most of the parameters are out of the optimum range, in addition to the uneven distribution throughout the hall.
Rating the hall in total by considering the simulation map results, it could be said that the best places in acoustical quality are the central front tiers that is followed by the side fronts, whereas the worst places are the back sides, which are followed by the mid sides. The overall condition of the hall is not dynamically responding well with a good uniformity. There are places in the audience area where the sound focuses strongly caus-ing echoes at these points, besides the dead spots. Extensive concave and rigid form of the roof membrane, fan-shaped hall geometry, the excessive volume, and the inadequate amount of diffusing surfaces besides the extremeness of the refl ective ones are the main reasons for the echo formation, tone coloration, longer reverberation and poor quality of sound distribution throughout the hall.
The suggestions are implemented on the model and the simulation is repeated for the fully occupied (present) condition (Table 3). The results show that the reverberation time is decreased by 15%. The bass balance, which is the ratio of mid frequency RT to high frequency RT, fall into the optimum range. So, warmth is obtained subjectively. Besides the RT, all of the above-mentioned parameters were moved into much reason-able ranges. The acoustical defects including echoes, which could be observed from the RT distribution maps are lessened in signifi cant amounts (see Appendix-M1/M2). So, the distribution of the sound becomes much homogenous when compared to the present condition. Finally, it is observed that the refl ected sound becomes denser at the sides of the mid and back tiers when compared to the present distribution of the sound.
It is clearly observed from the study that
Empty(real) Present(pres) Renovated(ren) Optimum
RT (s) 500 Hz 6.48 3.11 2.74 1.6 – 1.8 EDT (s) (s) 500 Hz 5.82 3.22 2.67 1.4 -1.9 C80 (dB) C80 (dB) 500 Hz -5.39 -2.5 -1.3 -2 − +2 D50 (%) D50 (%) 500 Hz 17 27 34 > 20
Table 3: RT, EDT, C80 and D50 values for empty, present (fully
oc-cupied), renovated halls and the optimum values for the parameters [12, 15, 20].
�������������������������������������������������������������������������������������
���������������������������������������������������������������
���������������������������������������������������������������������������
Figure 17: LF80pres Figure 17: LF80pres
Figure 17: LF80 and STI and STI and STI cumulative distribution graphs.prespres
�������������������������������������������������������������������������������������
���������������������������������������������������������������
���������������������������������������������������������������������������
Architectural Science Review Volume 49, Number 2, June 2006
176
Architectural Science Review Volume 49, Number 2, June 2006
176
Architectural Science Review Volume 49, Number 2, June 2006
the major surfaces in an auditorium have important implications on the acoustical quality of a place. In order to avoid acoustical defects the precautions has to be taken at the design stage, as their elimination in a completed hall is a diffi cult and in some cases even an impossible task. In the case of Bilkent Amphitheater some improvement is obtained taking into account the atmospheric and economic limitations. However a perfect solution is facing diffi culties considering the excessive volume and the semi-open condition of the hall, which is exposed to the climatic effects. Consequently, a further study could be the research of new materials, besides the nonwoven fabrics, that have sound absorption properties and durable against these atmospheric conditions. Moreover, the construc-tion methods and the economic aspects of the suggesconstruc-tions should be studied on, while developing new ones by taking into consideration the complete analysis of the hall.
Acknowledgements
The authors wish to express their gratitude for the guidance and techni-cal assistance given by Mehmet Caliskan, Professor at the Department of Mechanical Engineering of Middle East Technical University, Ankara, Turkey. Thanks are also to the Ramiz Akgün, Chief of Construction and Maintenance at Bilkent University, Ankara, Turkey, and the architect of the amphitheater Erkut Sahinbas for their supplying of reports related to the subject. Gratitude is also extended to Henrik Moller, Akukon Oy Consulting Engineers, Finland and his team for their technical support and implementation of the real-size measurements.
References
1. V. O. Knudsen, C. M. Harris: Acoustical Designing in Architecture. Acoustical Society of America, New York, 1988. 29-40 pp.
2. Y. Ando: Architectural Acoustics, Blending Sound Sources, Sound Fields, and Listeners. Springer, New York, 1998. 175-194 pp.
3. Z. Su: Acoustical Performance Analysis of Bilkent University Amphitheater “ODEON”. Thesis Master. Department of Interior Architecture and Environ-mental Design, Bilkent University Ankara, 2004.
4. A. Takatsu, yY. Mori, Y. Ando: The Architectural and Acoustic Design of a Circular Event Hall in Kobe Fashion Plaza. Music & Concert Hall Acoustics, Conference Proceedings from MCHA 1995, eds. Y. Ando, D. Noson. Academic Press, London, 1997. 297-306 pp.
5. M. F. Schmertz, R. E. Fischer: Denver’s Boettcher Concert Hall. Architectural Record, Vol. 3, 1979, pp. 99-110.
6. E. SAHINBAS: Bilkent Kapalı Anfi si (Bilkent Close Amphitheatre). Yapı, Vol. 229, 2000, pp. 88-94.
7. S. L. Vassilantonopoulos, J. N. Mourjopoulos: Virtual Acoustic Reconstruction of Ritual and Public Spaces of Ancient Greece. Acta Acustica united with Acustica, Vol. 87, 2001, pp. 604-609.
8. S. L. Vassilantonopoulos, J. N. Mourjopoulos: A Study of Ancient Greek and Roman Theater Acoustics. Acta Acustica united with Acustica, Vol. 89, 2003, pp. 123-136.
9. D. D. Rife: Maximum Length Sequence System Analyzer, Reference Manual. DRA Laboratories, 1987-1996. 86 pp.
10. ISO 3382: Acoustics Measurement of Reverberation Time of Rooms with Reference to Other Acoustical Parameters, 1997.
11. A. A. Abdou: Measurements of Acoustical Characteristics of Mosques in Saudi Arabia. The Journal of the Acoustical Society of America, Vol. 113, 2003, pp.1504-1517.
12. M.Barron: Auditorium Acoustics and Architectural Design. E&FN Spon,
London, 1993. 24-63 pp.
13. Z. Maekawa, P. LORD: Environmental and Architectural Acoustics. E&FN Spon, London, 1994. 92-97 pp.
14. T. Hidaka, L. L. Beranek, S. Masuda, N. Nishihara, T. Okano: Acoustical Design of the Tokyo Opera City (TOC) Concert Hall, Japan. The Journal of the Acoustical Society of America, Vol. 107, 2000, pp. 340-354.
15. D. Templeton: Acoustics in the Built Environment, Advice for the Design Team. Butterworth, Oxford, 1993. 55- 62 pp.
16. D. D. Reynolds: Engineering Principles of Acoustics, Noise and Vibration Control. Allyn and Bacon, Boston, 1981. 474-477 pp.
17. G. M. Naylor: Odeon – Another Hybrid Room Acoustical Model. Applied Acoustics 38, 1993, pp. 131-143.
18. J. H. Rindel: The Use of Computer Modeling in Room Acoustics. Journal of Vibroengineering, Vol. 3, 2000, pp. 219-224.
19. L. Cremer, H. A. Muller: Principles and Applications of Room Acoustics. Elsevier, New York, 1982. 48-54 pp.
20. M. D. Egan: Architectural Acoustics. McGraw-Hill, New York, 1994. 62-66 pp.
21. H. J. M. Steeneken, T. Houtgast: A Physical Method for Measuring Speech-Transmission Quality. The Journal of the Acoustical Society of America, Vol. 67.1, 1980, pp. 318-326.
22. C. Lynge: ODEON Room Acoustics Program Version 5.0 User Manual, Industrial, Audtorium and Combined Editions. Orsteds Plads, Lyngby, 2001. 55-58 pp.
23. J. S. Bradley, G. A. Soulodre: The Infl uence of Late Arriving Energy on Spatial Impression. Acoustical Society of America, Vol. 97.3, 1995, pp. 2263-2271.
Appendix
Calculated parameters distribution maps for the present and renovated conditions of the hall:
M1: Reverberation time distribution map for 500 Hz, for the present condition of the hall.
M2: Reverberation time distribution map for 500 Hz, for the renovated hall. M3: Early decay time distribution map for 500 Hz, for the present condition of
the hall.
M4: Early decay time distribution map for 500 Hz, for the renovated hall. M5: Clarity distribution map for 500 Hz, for the present condition of the hall. M6: Clarity distribution map for 500 Hz, for the renovated hall.
M7: Defi nition distribution map for 500 Hz, for the present condition of the hall.
M7: Defi nition distribution map for 500 Hz, for the renovated hall.
M9: Lateral fraction distribution map for 500 Hz, for the present condition of the hall.
M10: Lateral fraction distribution map for 500 Hz, for the renovated hall. M11: Speech transmission index distribution map, for the present condition
of the hall.
M12: Speech transmission index distribution map, for the renovated hall. M13: Strength distribution map, for the present condition of the hall. M14: Strength distribution map, for the renovated hall.
177
Acoustical Analysis of Bilkent Amphitheater & Renovation Proposal Sü & Yilmazer
Architectural Science Review Volume 49, Number 2, June 2006
178
Architectural Science Review Volume 49, Number 2, June 2006
178
Architectural Science Review Volume 49, Number 2, June 2006
View publication stats View publication stats