LEARNING FROM REAL-LIFE
EXPERIENCES: A DATA-DRIVEN
EMOTION CONTAGION APPROACH
TOWARDS REALISTIC VIRTUAL CROWDS
a thesis submitted to
the graduate school of engineering and science
of bilkent university
in partial fulfillment of the requirements for
the degree of
master of science
in
computer engineering
By
Ahmet Eren Ba¸sak
September 2017
LEARNING FROM REAL-LIFE EXPERIENCES: A DATA-DRIVEN EMOTION CONTAGION APPROACH TOWARDS REALISTIC VIRTUAL CROWDS
By Ahmet Eren Ba¸sak September 2017
We certify that we have read this thesis and that in our opinion it is fully adequate, in scope and in quality, as a thesis for the degree of Master of Science.
U˘gur G¨ud¨ukbay(Advisor)
¨
Ozg¨ur Ulusoy
Yusuf Sahillio˘glu
ABSTRACT
LEARNING FROM REAL-LIFE EXPERIENCES: A
DATA-DRIVEN EMOTION CONTAGION APPROACH
TOWARDS REALISTIC VIRTUAL CROWDS
Ahmet Eren Ba¸sak M.S. in Computer Engineering
Advisor: U˘gur G¨ud¨ukbay September 2017
We propose a data-driven approach for tuning, validating and optimizing crowd simulations by learning parameters from real-life videos. We discuss the common traits of incidents and their video footages suitable for the learning step. We then demonstrate the learning process in three real-life incidents: a bombing attack, a panic in subway and a Black Friday rush. We reanimate the incidents using an existing emotion contagion and crowd simulation framework and optimize the parameters that characterize agent behavior with respect to the data extracted from the video footages of the incidents.
Keywords: emotion contagion, crowd simulation, parameter learning, data-driven optimization.
¨
OZET
GERC
¸ EK OLAYLARDAN ¨
O ˘
GRENME: GERC
¸ EKC
¸ ˙I
SANAL KALABALIKLAR ˙IC
¸ ˙IN VER˙IYE DAYALI
DUYGU BULAS
¸ICILI ˘
GI
Ahmet Eren Ba¸sak
Bilgisayar M¨uhendisli˘gi, Y¨uksek Lisans Tez Danı¸smanı: U˘gur G¨ud¨ukbay
Eyl¨ul 2017
Bu ¸calı¸sma, kalabalık simulasyonlarının ger¸cek videolarla do˘grulanmasını ve ben-zetim parametrelerinin sonu¸cların videolardaki sonu¸clara benzemesini sa˘glayacak ¸sekilde ayarlanmasını sa˘glayan bir iyile¸stirme y¨ontemi sunmaktadır. ¨Oncelikle, do˘grulama ve iyile¸stirmede kullanılabilecek olayların ve videoların ¨ozellikleri ak-tarılır. Daha sonra bu s¨ure¸cte izlenecek video i¸sleme, veri ¸cıkarma, hata fonksi-yonu tespiti, sanal sahne olu¸sturulması, adımları okuyucuya aktarılır. Daha sonra, sunulan y¨ontemin ¸calı¸sması; bir canlı bomba saldırısı, bir metro vago-nundaki panik hali ve Kara Cuma arbedesinden olu¸san ¨u¸c farklı ger¸cek olay ve bu olayların videoları ¨uzerinden g¨osterilir. Son olarak, ¸calı¸smaların sonunda elde edilen bulgular, modelin ba¸sarımı sunulur.
Acknowledgement
First of all, I would like to express my gratitude to my supervisor Prof. Dr. U˘gur G¨ud¨ukbay. Without his guidance and assistance, it would not be possible to complete this thesis.
I also would like to thank to rest of my thesis committee, Prof. Dr. ¨Ozg¨ur Ulusoy and Assoc. Prof. Yusuf Sahillio˘glu for evaluating this thesis.
Besides, I am grateful to Dr. Funda Durupınar for her contributions, advice and help to this thesis.
I would like to thank my employers ASELSAN A.S¸. and Citus Data, Inc. for supporting me during my studies both financially and mentally.
I am grateful to Aytek Aman for his assistance and advice on preparing virtual scenes.
I would like to thank Ecehan Sava¸s for all her love, encouragement and support during my stressful times.
I want to thank Anıl, Burak, Emra, Levend, Sel¸cuk, Utku and all of my friends for their support and hospitality.
Finally, I want to thank my family for their support through my studies. I could not accomplish my goals without their unconditional love.
Contents
1 Introduction 1
2 Related Work 4
3 Emotion Contagion Approaches 8
3.1 ASCRIBE . . . 8
3.2 ESCAPES . . . 9
3.3 BioCrowds Model . . . 10
3.4 Durupınar Model . . . 11
3.5 Discussion . . . 12
4 Optimization and Parameter Learning Framework 14 4.1 Collecting Data of a Proper Incident . . . 14
4.2 Transfer from Video Pixel Coordinates to Scenario Coordinates . 16 4.3 Parameter Optimization . . . 18
CONTENTS vii
5 Scenarios 20
5.1 Ankara Attack Scenario . . . 20
5.1.1 Surveillance Camera Footage . . . 21
5.1.2 Tracking . . . 22
5.1.3 Virtual Scene . . . 23
5.2 Subway Panic Scenario . . . 25
5.2.1 Security Camera Footage . . . 25
5.2.2 Tracking and Error Function . . . 26
5.2.3 Virtual Scene . . . 26
5.3 Black Friday Scenario . . . 27
5.3.1 Video Tracking . . . 29
5.3.2 Virtual Scene . . . 29
5.3.3 Tuning Parameters . . . 31
6 Results and Discussion 32
List of Figures
4.1 General flow of optimization and parameter learning process. . . . 15
5.1 Surveillance camera footage of Ankara Attack incident. . . 21
5.2 Reference points used for barycentric coordinate projection of tracked pixels in Ankara Attack incident. . . 22
5.3 The virtual recreation of Ankara Attack incident. . . 23
5.4 Security camera footage of Subway Panic incident. . . 26
5.5 Representation of the error function used for optimizing the model for Subway Panic incident. The area between the simulated and tracked people count lines corresponds to our error. . . 27
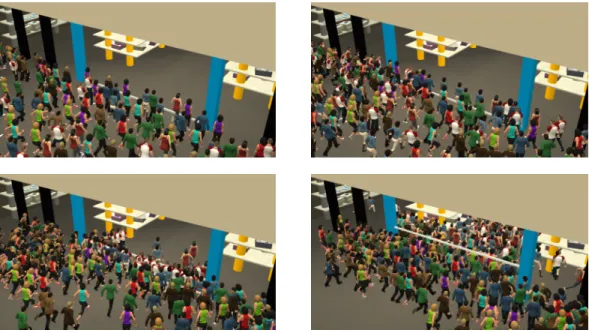
5.6 Virtual simulation of Subway Panic incident. . . 28
5.7 Video footage of Black Friday incident. . . 28
5.8 Virtual simulation of Black Friday incident. . . 30
6.1 Tendency of error as more experiments performed. . . 33
LIST OF FIGURES ix
6.3 Tendency of error with tuning iterations . . . 37
6.4 Sensitivity of parameters as the experiments performed . . . 38
6.5 Parameter Sensitivities of Ankara Attack scenario. . . 39
6.6 Parameter Sensitivities of Subway Panic Scenario. . . 40
List of Tables
5.1 Parameters used in Ankara Attack scenario. . . 25
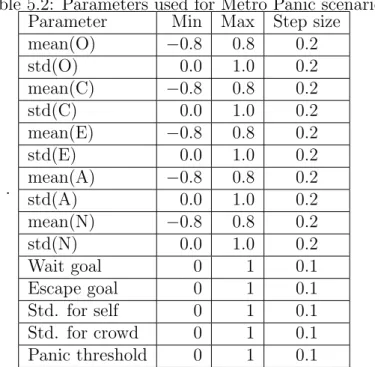
5.2 Parameters used for Metro Panic scenario . . . 29
5.3 Parameters used for Black Friday scenario. . . 31
Chapter 1
Introduction
When people congregate, they sometimes engage in spontaneous, homogeneous and irrational group behavior, losing their sense of identity. This phenomenon is known as collective (mis)behavior. Social psychology literature introduces various theories to explain collective crowd behavior. According to Brown [1], crowds can be classified under two categories as audiences and mobs depending on the exis-tence of observable unified behavior. In both categories, the crowd members share a common goal, unlike pedestrians on a street who happen to be coincidentally at the same place at the same time. A crowd is called an audience if the group stays calm and relatively passive, such as students in a classroom or tourists visiting a historical building. On the other hand, mobs show active reactions, as in protests or hunger riots.
One of the most influential factors in the emergence of collective mob behavior is emotion contagion. Emotion contagion is the phenomenon of having the feelings and responses of one person influencing and manipulating the emotions of others in a group of individuals [2]. Within this continuous feedback mechanism, we generally observe that emotions and resulting behaviors converge to a single active response over time, thus converting audiences to mobs.
Crowd simulation literature involves various techniques to validate the be-haviors of virtual agents [3]. Although many studies exist about evaluating the quality of a crowd simulation system by considering human expert opinions [4] or some numeric metrics [5], we still need a universal, objective, quantitative and reusable method for validating crowd simulation models. Thus we can formally define future improvements to existing simulation systems and compare different systems under different scenario cases. In order to address this issue, we propose a data-driven approach for mimicking real crowd behaviors, learning parameters af-fecting crowd behavior and finally validating crowd simulation systems according to their fidelity to real behaviors. We apply this approach to the epidemiological emotion contagion framework proposed by Durupınar et al. [6]. We explain how to learn the characteristics of emotion contagion from a real-life event video and how to improve and optimize the emotion contagion model by Durupınar et al. using the results of this analysis. To this end, we investigate the agent behavior before and after the incident and recreate the incident in a virtual environment.
The contributions of this research are as follows:
• We propose a data-driven, quantitative and reproducible method for learn-ing parameters from real crowd videos for synthesizlearn-ing virtual crowds. • We explain how real-life incidents can be utilized for evaluation and
im-provement of crowd simulations.
• We clarify the properties of suitable material for this process and demon-strate how to process videos of real-life incidents for virtual environment creation.
• We analyze three contemporary incidents and apply our proposed approach to an existing emotion contagion and crowd simulation system.
The rest of this thesis is organized as follows. In Chapter 2, we discuss the related work in emotion contagion, crowd simulation and empirical evaluation studies. In Chapter 3, we provide a brief overview of existing emotion contagion
Chapter 4, we explain the proposed parameter learning framework and necessary steps to analyze crowd videos before using them for the optimization process. In Chapter 5, we explain the incidents that we studied, how we extracted data from them, how we recreated them in a virtual environment and how we simu-lated them using Durupınar model. In Chapter 6, we demonstrate and discuss the results of our parameter estimation mechanism on the studied incidents. Fi-nally, we summarize our work in Chapter 7, draw conclusions and discuss future improvement ideas.
Chapter 2
Related Work
Pereira et al. [7] present a computational model for emotion contagion simu-lation in virtual crowds, incorporating personality differences and interpersonal relationships. In their work, they take intimacy among the virtual agents into account for the influence of emotions so that higher intimacy results with more homogeneous emotional behaviors in crowds.
Hoogendorn et al. studied the information exchange and emotion contagion among the crowds in [8]. In this work, they model the change of information spread with respect to the emotional states of individuals and simulate an emer-gency situation as the demonstration of their work.
Silverman et al. [9] proposed an architecture that combined the existing pathfinding and cognitive navigation system (MACES) with PMFserv, which models changing behaviors of individuals according to stress, emotions and mo-tivations.
Borodin et al. [10] and Chen et al. [11] applied the concept of influence among the groups of people to social networks and showed that the responses of key individuals steer the behavior of the whole group significantly.
Lemercier et al. [12] propose a crowd simulation model in which agents adapt to their environments and show different behaviors in different situations. They provide heterogeneity by providing virtual agents with different interaction possi-bilities with their environments. They use previously-tuned values for the param-eters in their model for better results; however they do not discuss the metrics and the tuning process.
Helbing et al. demonstrated the social forces model for explaining crowd be-havior in [13], where the characteristics of individuals in a crowd affect the motion of surrounding pedestrians. Later, they modeled the panic behavior in crowds mixing the individualistic behavior and collective instincts in [14]. With this study, they simulated a crowd of people escaping a smoke-filled room and came up with an optimal strategy for escaping from such disasters.
Fridman et al. [15] demonstrate a crowd simulation model based on Social Comparison Theory and argue that their model is suitable for general usage. Furthermore, they propose a method for evaluating the imitation performance by showing people video clips of random crowds and as well as simulations, then ask-ing questions to clarify whether they perceived the video as behavior of unrelated individuals or more like a collective response.
Ramos et al. [4] present a computational model for crowds showing emotional responses via body movements and emotion contagion and discuss their analysis on the role of background perception in emotion contagion. The model uses emotions to simulate body movements. Different from our data-driven approach, they use human expert opinions for evaluation.
Charalambous et al. [5] describe a novel approach for data-driven evalua-tion of crowd simulaevalua-tion models. Similarly, Bera et al. [3], Lee et al. [16] and Lerner et al. [17] propose data-driven approach to learn how pedestrians behave, using trajectories extracted from real-life crowd videos. They optimize the un-derlying multi-agent simulation parameters and make simulated agents decide on actions according to the a database of real-life behaviors. Similar to our work, they analyze videos to extract trajectories of pedestrians and use this data for
evaluation and improvement of their model. However, their material consists of high-quality videos of passive pedestrian audiences or synthetic movements of people in contrast to our focus on active and emotionally-driven mobs.
Singh et al. [18] present a numerical framework for evaluating crowd simulation models, including metrics, scoring methods and test cases. Similar to our work, they score crowd simulation model based on various error functions. However, relative performances of crowd simulation models based on these error metrics do not necessarily indicate realism performance because they are not based on real-life data. Likewise, Musse et al. [19] propose a model to quantitatively compare flow characteristics of two crowds by calculating 4D histogram distances.
Berseth et al. [20] analyze the effects of architectural decisions to the pedestrian flow and demonstrate a framework for optimal architectural element placement. The methodology of optimizing variables by tuning them according to a quan-titative metric of simulation results is similar to our strategy. However, this ar-chitectural work fixes the crowd simulation model and modifies the environment, whereas we adapt the crowd simulation model parameters to the environment and events.
Lin et al. [21] model the crowd behavior evacuating an office building. In their case study, using the videos taken by the security cameras of the building, they calibrate the parameters of their model. Similarly, Tan et al. [22] use an agent-based crowd model for simulating an evacuation incident and used their findings to propose a method for representing indoor space for such simulations.
Bosse et al. [23, 24] use a multi-agent based approach to simulate the emotion contagion phenomenon within crowds and propose the concept of negative emo-tion spirals in teams demonstrating the effects of ambient agents on the emoemo-tional responses of a team. Later, they apply their emotion contagion model to simulate a real world incident that took place in Amsterdam and optimize some decision making parameters accordingly [25].
Tsai et al. [26] show their investigation results of emotion contagion phe-nomenon with various experiments. They introduce ESCAPES, a simulation tool designed for reproducing evacuation scenarios [27]. Later, they compare two emotion contagion models proposed by Bosse et al. and Durupınar et al. and evaluate their impacts using the ESCAPES simulation tool [28].
Durupınar et al. [6] investigate the differences between audiences, which are passive crowds, and mobs, which are active crowds with emotional and seemingly homogeneous behavior. Their model facilitates the simulation of virtual environ-ments and the specification of different groups of agents with varying personality characteristics and roles within a scenario. This allows easy manipulation of the impact of the events, personality traits, goals, and emotions on their behavior.
Chapter 3
Emotion Contagion Approaches
3.1
ASCRIBE
Bosse el al. [25] present ASCRIBE, a computational model of neural mechanisms of social mutual adaptation for satisfactory common group decisions. ASCRIBE incorporates a base for modeling the interaction between the beliefs and emo-tions of an agent while also providing mechanisms for the influence of emoemo-tions, intentions and beliefs among agents.
In its core, ASCRIBE has a model for mirroring mental states between agents, representing the contagion phenomenon. In this model the amount of influence of a mental state of one agent on another depends on the expressiveness of the sender agent, openness of the receiver agent and channel strength between the subjects, which depends on the physical conditions such as distance, and field of view. The combination of influence of all other agents constitutes the overall contagion strength on an agent. Finally, the updated mental state of an agent is calculated as a combination of the overall contagion and agent’s previous state. The coefficient of the contagion component determines the speed of adjustment in an agent’s mental state and convergence of the crowd behavior.
The interaction among emotions, beliefs and intentions of an agent are also incorporated into the ASCRIBE model. In this model, fear starts affecting infor-mation retrieval and amplifies influence of the beliefs on behavior, if it is above a threshold. The value given to information by an agent will be affected by the fear and personality as well, e.g., a pessimistic person with high level of fear would significantly be affected by negative information and positive information would have less influence on the agent’s behavior. Similarly, information influences the emotional state, for example, negative information has tendency to increase fear. Finally, beliefs and emotions together affect the intentions of an agent.
Bosse et al. test ASCRIBE with two scenarios, a synthetic office evacuation scenario which demonstrates the influence of information on agents’ behavior, and a reanimation of a real-life incident for demonstration of the model’s mimicking potential. The May 4th incident that happened in Dam Square, Amsterdam in 2010 involves a group of about 20000 people leaving the area in panic after a person starts screaming, demonstrates the contagious nature of fear.
3.2
ESCAPES
Tsai et al. [27] introduce Evacuation Simulation with Children, Authorities, Par-ents, Emotions, and Social comparison (ESCAPES), a multi agent evacuation system customized for airport evacuation domain. ESCAPES includes four key components for characterization of agent behavior:
• Various types of agents with different roles and priorities, such as individual travelers, families and security personnel.
• Emotional contagion, which causes one agent’s emotion to affect others directly and indirectly. Specifically, passengers adopt the highest level of fear from their surrounding passengers and if there are security personnel nearby passengers tend to calm down.
• Exchange of information related to the scene and incident. ESCAPES is geared towards airport evacuations and airports which, unlike office spaces and houses, have people with little knowledge of the building. This makes exchange of information among passengers and directives of security per-sonnel play a significant role in the behavior of the crowd.
• Behavioral interaction utilizing Social Comparison Theory [29], which ba-sically involves passengers comparing themselves to other passengers by evaluating their behavior. This evaluation involves various features like speed, distance, emotional reactions, and so on. According to this evalu-ation, agents tend to mimic the behavior of the agents that are similar to themselves, causing a convergence in group behavior.
Tsai et al. run proof of concept tests of ESCAPES by modeling Tom Bradley International Terminal at Los Angeles International Airport. They created the 2D model of the building and visualized it in 3D. Later, they compare Durupınar Emotion Contagion model and ASCRIBE model by implementing both models and incorporating them as the way emotional exchange takes place [28].
3.3
BioCrowds Model
Pelachaud et al. [30] introduce the emotion contagion concept into BioCrowds model [31]. Their model for emotional contagion is similar to the model de-scribed by Bosse et al. [24], incorporating a gradual contagion model (instead of threshold based binary contagion), channel strength affecting the inter-agent emotion influence which is inversely proportional with distance. However, emo-tion contagion in BioCrowds supports multiple groups in a scenario and models inter-group emotion contagion as well.
3.4
Durupınar Model
We estimate parameters of the emotion contagion model proposed by Du-rupınar et al. in [6]. DuDu-rupınar emotion contagion model represents person-ality by the OCEAN (Openness, Conscientiousness, Extroversion, Agreeableness, Neuroticism) model [32], which describes five independent dimensions of human personality. The model defines how each personality trait affects the development of emotions both for the individual itself and other people around. By specifying different values for each agent, one can generate heterogeneous crowds easily and observe the change in convergence patterns of crowd behavior with respect to the given personalities.
Alongside the personality traits, agents’ appraisal of their environment and surrounding individuals play an important role in development of emotional re-actions. The framework employs Ortony, Clore, Collins (OCC) model [33] to simulate cognitive appraisal and emotions. In this model, individuals assess their environment in terms of their goals regarding others’ and their own actions, their standards about other individuals and their attitudes towards objects. The frame-work utilizes the Pleasure-Arousal-Dominance model [34] to determine the cur-rent emotional state and make decisions. For emotion contagion in a crowd, they employ the social contagion model proposed by Dodds and Watts [2] with various augmentations.
In Durupınar model, the emotion of an agent is represented as the combina-tion of the agent’s appraised emocombina-tional state with respect to the defined goals, standards and attitudes and the influence of other agents in the crowd, which is the empathy component representing the emotion contagion in the model. The calculation of empathy is straightforward while the appraisal part depends on the nature of the scenario and events happening.
Durupınar model simulates emotion contagion by adopting an epidemiological threshold based approach [2]. This way, the emotions do not show up until they reach a threshold level. Emotions add up when the agents are exposed to
incidents and other agents’ emotional responses and decay over time when they are not affected. The threshold of emotional reactions are mainly determined by the expressiveness of the agent.
3.5
Discussion
Tsai et al. [27] and Bosse et al. [25] discuss the first steps and benefits of quanti-tative evaluation, comparison and optimization of emotion contagion and crowd simulation models using real world incidents. Yet, they do not discuss the prop-erties of suitable incidents and materials; methods to track individuals in video footage and to project the tracking data to the real scene in detail. For instance, Bosse et al. track a relatively small group of 35 individuals in a massive crowd of size about 20000 people and use only this incident for parameter estimation.
Although the mentioned models seemingly serve the same purpose, they have differences in terms of focused application areas. For example, ESCAPES has a very specific focus on airport evacuation scenarios; ASCRIBE and BioCrowd are used for other kinds of scenarios which still involving fear but Durupınar model supports scenarios involving acquisitive mobs like a Black Friday scene and angry mobs as in protest scenarios, alongside fear scenarios like evacuations.
In the sense of supporting multiple groups and individual types in a scenario, the mentioned methods differ from each other. While ASCRIBE copes with only one group in a scenario, ESCAPES, BioCrowd and Durupınar models support multiple groups with different goals, intentions and responsibilities in a scenario.
From the perspective of emotional contagion method, agents in ESCAPES adopt the maximum level of fear from their surrounding agents and their fear level decreases when they pass by an authority figure. In ASCRIBE and BioCrowd, contagion occurs gradually, without any threshold, among agents and distance is the major external factor in determining the strength of influence. The Durupınar
model incorporates an epidemiological emotion concept where emotions show up after they exceed a threshold and decay over time.
Overall, because of its capability of supporting various kinds of scenarios where crowds behave as a whole and react with various emotions, we base our studies on Durupınar Emotion Contagion Model and Crowd Simulation System.
Chapter 4
Optimization and Parameter
Learning Framework
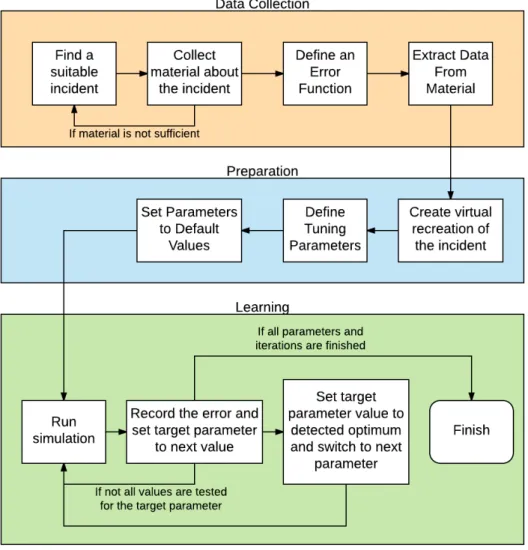
Given a crowd simulation model we try to estimate the parameters per incident basis, with three major stages. First, in the data collection stage, we find a suit-able incident and extract data from it. In the preparation stage, we create the virtual environment for the simulation and define the parameters of the simula-tion model to be tuned. Finally, in the learning stage, the optimizasimula-tion frame-work automatically runs the simulation multiple times and tunes the parameters (see Figure 4.1).
4.1
Collecting Data of a Proper Incident
Our framework learns parameters of crowd simulation models using videos of real-life incidents. In order to perform efficient parameter learning, the incident and its material should satisfy the following properties:
Figure 4.1: General flow of optimization and parameter learning process.
taken from a static camera, like a security or surveillance camera, and at least some of the individuals in the incident should be trackable for some period of time.
• The incident should be suitable for the use-case of the selected simulation model. In our case, the selected video should involve emotional responses of people in the scene because Durupınar emotion contagion model geared towards simulation emotional behavior of crowds.
• The size of the crowd should be suitable for the underlying crowd simulation model. For example in order to evaluate the Durupınar model, we aim for crowds of size less than 500 people, ideally between 75 and 200.
• If the chosen error function is trajectory comparison, for easier projection, the scene should not have variations in the vertical space; i.e., the surface that the pedestrians move should be flat. Otherwise, it becomes difficult to project the camera image to the virtual scene. For a non-flat environ-ment, a high resolution height map of the terrain would be required and the barycentric coordinate transformation would not be applicable.
In our parameter learning framework, we first collect video footage for suitable incidents and preprocess them when necessary. Next, we track the people on the video and extract relevant data, either trajectories of individuals or occurrences of defined events and define an error function which would represent the accuracy of a simulation. Then, we recreate the scene in the virtual environment of the target crowd simulation model with its static obstacles, reference points and virtual agents. We project the extracted trajectories from video to the virtual scene. Finally, we define the parameters to be learned and run the parameter optimization algorithm.
4.2
Transfer from Video Pixel Coordinates to
Scenario Coordinates
In order to synthesize the environment of the incident, if the chosen error function is trajectory matching, i.e. the difference between the path individuals follow during the real incident and the simulated path of virtual agents, we need to transform the pixel coordinates that constitute the output of the tracking process to the virtual scene. There are two possible approaches to this end: barycentric coordinate translation and camera parameter extraction.
The camera parameter extraction relies heavily on a high amount of known reference points (around 60) [35], which are generally captured by placing a simple and easy to detect pattern, such as a checkerboard, in the recorded video. This approach is not applicable to our case, because most of the time, videos of real-life incidents suitable for our framework are obtained by surveillance cameras, making camera parameter extraction is not possible. Therefore, we focus on barycentric coordinate translation, which can be performed with as few as three reference points.
Barycentric coordinates allow us to describe a point in space with respect to other known reference points [36]. They represent a point as a weighted aver-age of other known (reference) points. For convenience, the weights are usually normalized, i.e., they sum up to 1. One important property of barycentric coor-dinates is that they do not change with linear projections; i.e, when the space is scaled, translated or rotated, barycentric coordinates stay the same.
In our case, we can benefit from the barycentric coordinates within the two dimensional space. For our three reference points, we know the camera space coordinates as well as the 2D coordinates in the scene. We calculate the barycen-tric coordinates for all the pixels in the video frames with respect to our three reference points. Then, we calculate the coordinates of the point in the three dimensional scene using the barycentric coordinates.
Let our reference points be rpi = [xi, yi], i = 1, 2, 3 and query point be qp =
[xp, yp] with the barycentric coordinates [b1, b2, b3]. We can find the corresponding
pixel coordinates as follows:
1. Calculate the barycentric coordinates [b1, b2, b3] of the query point (qp) with
respect to the pixel coordinates of the three reference points by solving the following linear equation:
x1 x2 x3 y1 y2 y3 1 1 1 b1 b2 b = xp yp 1
2. Calculate the scene coordinates sc of the query point with the known scene coordinates of the three reference points (srp1,2,3) as:
sc = srp1 b1+ srp2 b2+ srp3 b3.
This approach assumes that the event scene is flat and the camera image is a perfect linear projection of the scene without any lens distortion. For better results, the camera image can be preprocessed to disable lens distortion.
4.3
Parameter Optimization
Our goal is to find the best combination of various parameters that play role in the behavior of virtual agents. For this purpose, we must formulate an error function that reflects the difference between the simulated scenario and the real events. The error function should be formulated per-scenario basis, considering the natures of events in the scenario. With this, the meaning of “best combination of parameters” becomes the vector of values, which minimizes the defined error function:
minimize
P error(P )
subject to pimin≤ pi ≤ pimax, pi ∈ P
For searching the optimum parameter values in the search space, we run a simple independent parameter tuning algorithm (cf. Algorithm 1), similar to the work of Bosse et al. [25]. This method instantiates parameters to their minimum values at the beginning, iterates through parameters optimizing one parameter at a time by calculating the error when the value of the parameter being optimized is changed step by step and values of the rest of the parameters are fixed.
This optimization process allows us to scale the tuning ranges of individual parameters with minimal overhead to complete the whole process and gives
in-results. By taking advantage of these properties, we can automatically improve the testing efficiency with each iteration by reducing the step size of sensitive parameters and increasing the possibility range of critical variables.
This technique also scales quite well in terms of number of parameters to be searched as well as number of distinct values (steps) each parameter can take. If n is the number of parameters and m is the average number of steps of parameters, then the runtime of this algorithm is O(n × m).
After all values have been tested, the parameter is assigned to the optimal value and the tuning process continues with the next parameter. After all parameters are tuned, the whole process restarts with the first parameter using the previously found optimum values.
Algorithm 1 Independent Parameter Tuning. k: number of tuning iterations
P : set of parameters
si: step size of parameter pi
min(pi): minimum value of pi
max(pi): maximum value of pi
val[pi]: current value of pi
for c = 1 to k do for all pi ∈ P do
val[pi] ⇐ min(pi)
bestError ⇐ ∞ bestV al ⇐ val[pi]
while val[pi] ≤ max(pi) do
calculate currentError val[pi] ⇐ val[pi] + si
if currentError < bestError then bestError ⇐ currentError bestV al = val[pi] end if end while end for end for
Chapter 5
Scenarios
In order to demonstrate our system, we have studied three different real-life inci-dents involving emotional responses of crowds and virtually recreated them using Durupınar emotion contagion model and her crowd simulation system. The first incident involves a suicide bomber detonating himself and crowd’s escape from the scene of accident. The second incident is a state of panic in a subway train where crowd suspects one of the passengers being a suicide bomber. The third incident is a crowd storming the gate of a shop opening on black friday.
5.1
Ankara Attack Scenario
In order to demonstrate our proposed parameter learning method, we have used the video of the terrorist attack in Ankara Train Station on October 10, 2015, which we are going to refer from now on as Ankara Attack. During a gathering in an open space just outside the railway station, two bombs were detonated, resulting in a death toll of 103 civilians and the physical injury of more than 400. We chose this video because
Figure 5.1: Surveillance camera footage of Ankara Attack incident.
• there is a stable video footage of the incident taken from a surveillance camera overseeing the scene and the panicking crowd,
• the size of the crowd captured by the camera is between 50 and 200 people, which is suitable for the crowd simulation model,
• the footage does not contain graphic violence, thus can be used in public media, and
• the environment is flat.
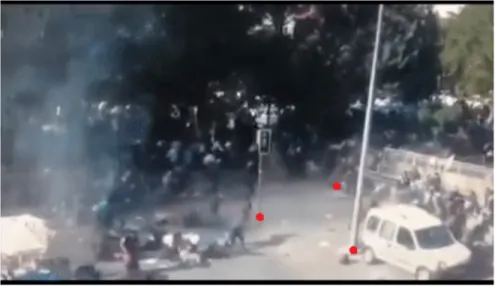
In the scene, we have identified three spots as the reference points: the traffic pole in the center, the street light on the right, and the corner of protection bars of the underpass for the projection process. The reference points are shown with red dots in Figure 5.1.
5.1.1
Surveillance Camera Footage
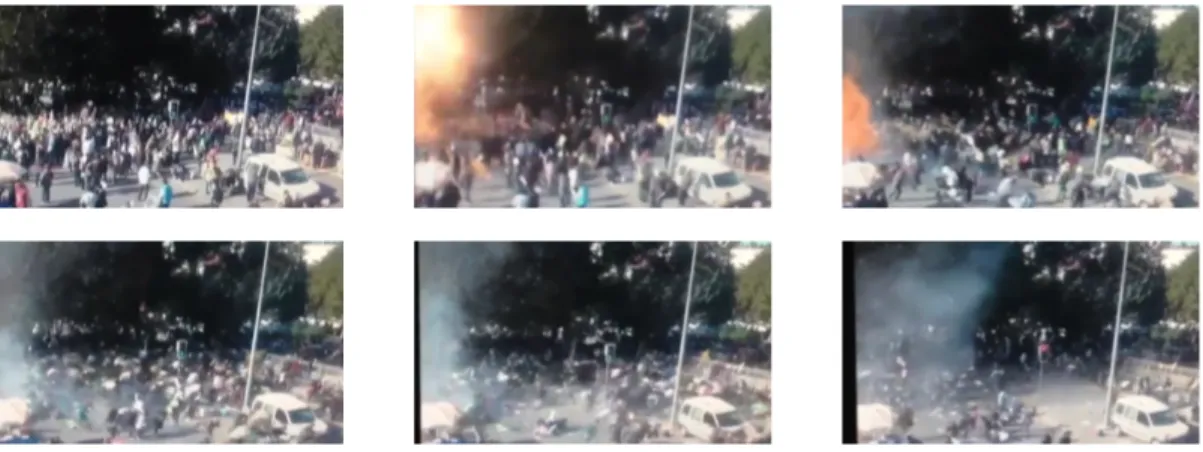
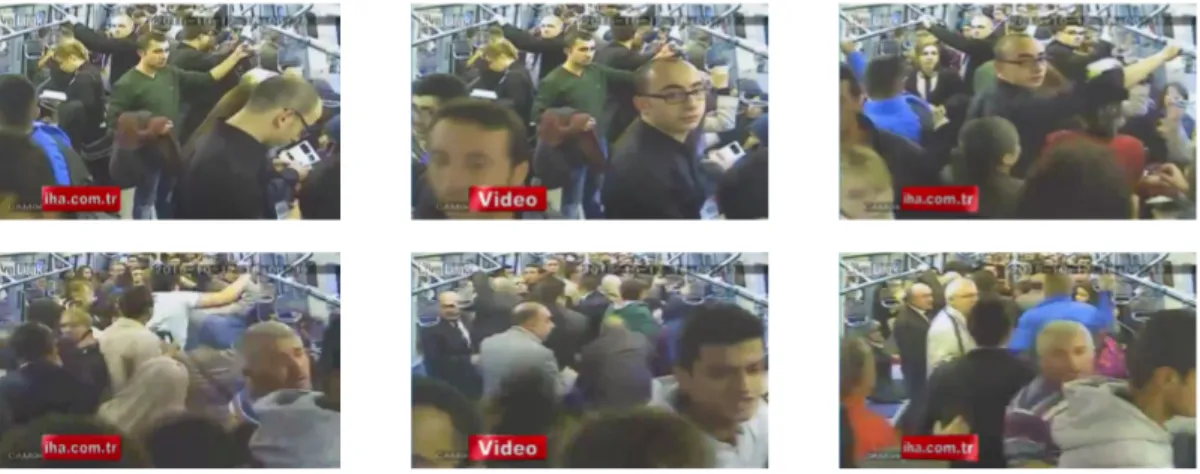
The video footage is taken from a city surveillance camera at the center of the gathering area, pointing to the west. In the video, there is a traffic light pole at the center, a street light pole and a white panel van car parked at the bottom right corner; and the scene is filled by the crowd slowly roaming the area or standing still. The explosion is seen on the left at the 11th second of the original
Figure 5.2: Reference points used for barycentric coordinate projection of tracked pixels in Ankara Attack incident.
video. After that, the crowd starts running away from the center of explosion to the top and bottom right corners of the video.
The original video that we have access to is a mobile phone camera recording of a computer screen, playing the actual surveillance camera footage. Therefore, it contains unwanted panning and motion blur. In order to reduce these glitches, we preprocessed the video by stabilizing it with the traffic light pole as the reference point. After stabilizing the video, we cropped it so that the whole scene consists of the actual footage of the surveillance camera. Finally, we trimmed the video. The processed video has 446 × 250 resolution, 16 seconds of length with 12 frames per seconds and 434 kbps of bit rate, which sums to 826 kilobytes in size.
5.1.2
Tracking
In order to track people in the crowd, we automated the pedestrian trajectory extraction, as described in [3]. Because the quality of the video is low, the pedes-trian detection methods perform poorly. After various attempts, we decided to track people manually, as it is done in [24]. We used an open source software,
called “Tracker” [37] for tracking people in the crowd. This was done in a per-agent basis, by clicking on the position of a person at each frame, doing this until the person leaves the area covered by the video. Because the video is blurry, it is difficult to track the positions of individuals in groups. We were able to track ten individuals. We started tracking just before the explosion and tracked these individuals for various durations– five seconds (or 62 frames) on the average. For barycentric coordinate projection, we chose three reference points in the scene, as it can be seen in Figure 5.2.
5.1.3
Virtual Scene
Figure 5.3: The virtual recreation of Ankara Attack incident.
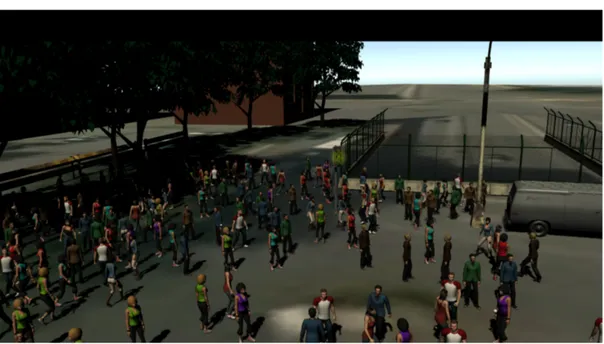
We created the virtual scene with 180 agents by exporting a satellite image from Google Earth around the coordinates of 39.9366 latitude and 32.8442 lon-gitude (see Figure 5.3). We scaled the image as the ground plane in a Unity 3D scene with real world coordinates of one meter corresponding to one unit in Unity.
The scene is placed in such a way that the base of surveillance camera pole sits at the origin of the world coordinate system with the positive z axis pointing
to the north and the positive x axis pointing to the east. With this setup, y axis points to the sky because Unity uses left-handed coordinate system. We placed static obstacles for the train station building, trees between the train station and incident scene, the traffic light pole, the street light pole, the car under the street light and the underpass to populate the scene.
The Durupınar emotion contagion model allows us to define standards that individuals have for themselves as well as the others. In this scenario, we set approving standards of individuals towards themselves as well as towards other agents. This is based on the fact that the people gathered in the area for a com-mon goal, therefore they sympathize with each other. We also gave a displeased goal of waiting in the area because the gathering was about a protest.
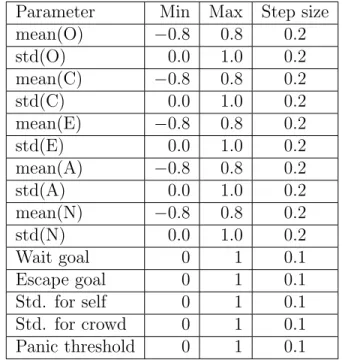
We defined 15 parameters that can be tuned easily and impact the outcomes of the simulation results (cf. Table 5.1). Ten of these parameters are the mean and standard deviations of the five personality factors. Alongside the personality variation, we tuned the parameters for the weights of standards the agents have for themselves and for the other people, the initial goal of roaming around the gathering area, the goal of running from the explosion and the fear threshold for starting to panic.
We also define the error function for this scenario to be a trajectory matching error function, which is the sum of distances between of each tracked agent and its corresponding virtual agent. Optimizing this error function allows us to obtain a more realistic escaping pattern with more accurate running speeds, escaping directions and obstacle avoidance behavior of agents.
We set the tuning environment for the virtual Ankara Attack scenario with the described 15 parameters, running each test three times and taking the median for the error. The tests run for four iterations so the parameters took turns four times in the tuning process, with another set of tuned parameters each time. Moreover, we run the testing scenario in 0.5× slow motion in order to let Unity dedicate more processing time at each frame. With these numbers, the tuning
Table 5.1: Parameters used in Ankara Attack scenario. Parameter Min Max Step size
mean(O) −0.8 0.8 0.2 std(O) 0.0 1.0 0.2 mean(C) −0.8 0.8 0.2 std(C) 0.0 1.0 0.2 mean(E) −0.8 0.8 0.2 std(E) 0.0 1.0 0.2 mean(A) −0.8 0.8 0.2 std(A) 0.0 1.0 0.2 mean(N) −0.8 0.8 0.2 std(N) 0.0 1.0 0.2 Wait goal 0 1 0.1 Escape goal 0 1 0.1 Std. for self 0 1 0.1 Std. for crowd 0 1 0.1 Panic threshold 0 1 0.1
5.2
Subway Panic Scenario
The second incident that we study is a state of panic on a subway car. Late 2015 was a period in Turkey where various terrorist bombing attacks have happened and people were expecting more attacks because of rumors in social media [38]. On October 16th, two days after a bombing attack has happened, during rush hour in a subway car in Ankara, a passenger started yelling and pointing another passenger stating that she suspects him to be a suicide bomber. At that point, two undercover police officers rushed to neutralize the suspected person while other passengers run away from the suspected person.
5.2.1
Security Camera Footage
The incident can be seen from video footage of a security camera in the car, published by the press. In the video, we see the passengers turning their heads to
Figure 5.4: Security camera footage of Subway Panic incident.
the screaming person and starting to run away from the incident point (see Fig-ure 5.4). The camera looks away from the screaming person so the screaming person is not visible.
5.2.2
Tracking and Error Function
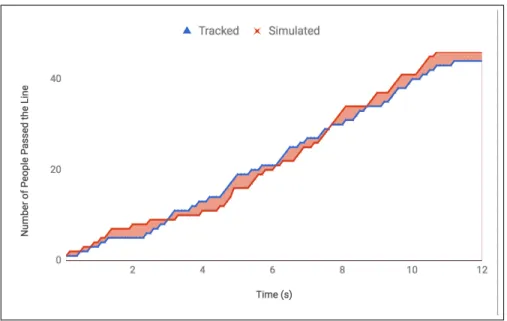
We have tracked the movement of individuals to get the flow throughput of the crowd in the car. We counted around 50 people as they run from the suspect in fear and came up with a time series graph of number of people crossed the line with respect to time passed. When we created the simulation, we obtained the same graph but with the virtual agents and used the difference between the tracked and simulated graphs as an error function, as it can be seen in Figure 5.5.
5.2.3
Virtual Scene
We have created a scene with 300 virtual agents in three wagons, with middle wagon representing the wagon seen in the video footage. In the scene, seats are assigned to virtual agents by their proximities and the seat-assigned agents are sitting initially (see Figure 5.6). When the fear level of an agent exceeds a fear
Figure 5.5: Representation of the error function used for optimizing the model for Subway Panic incident. The area between the simulated and tracked people count lines corresponds to our error.
threshold, which is a tuning parameter of the scene, that agent stands up and tries to run away.
Similar to Ankara Attack scene, 10 of the tuning parameters comes from the OCEAN personality model: mean and standard deviation of each of the five personality traits. Additionally, we have defined a goal to stand still as nothing has happened, a goal for escaping from the danger, an approving standard for the agent itself, a neutral standard for the surrounding agents and a fear panic threshold, after which the agents start running away (cf. Table 5.2).
5.3
Black Friday Scenario
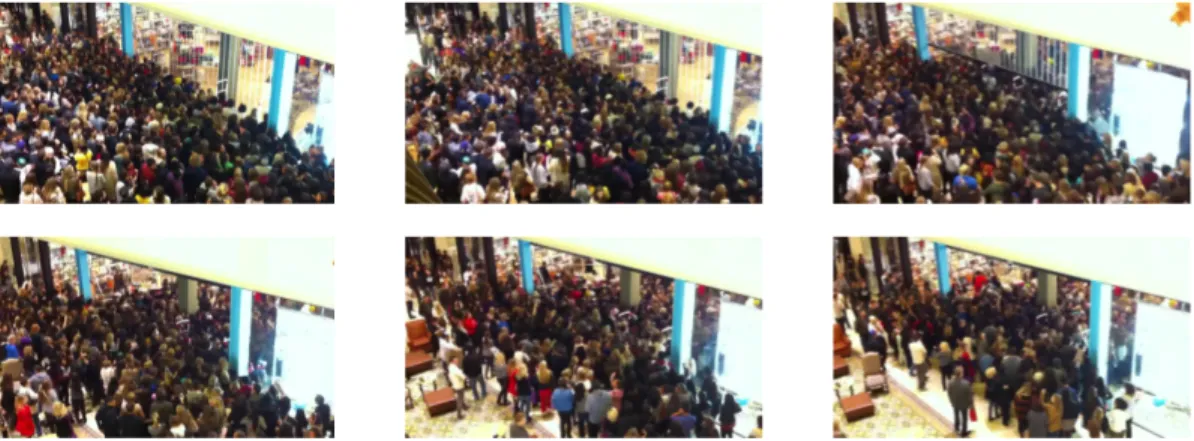
The third incident that we study for simulation is a Black Friday midnight opening of a shop in a mall on November 25, 2011 where a crowd of people rushed to get inside the shop. The incident involves about 400 people, getting inside the shop in about 30 seconds.
Figure 5.6: Virtual simulation of Subway Panic incident.
We have a 30 second video of the incident, taken by a person with a cell phone camera from a higher ground. In the beginning, where the gate is closed, people are waiting outside the shop. When the gates are started to open in two seconds, from bottom to top, people start making noise and pushing each other towards the shop gate. After a few seconds, people start getting inside the shop and it takes about 30 seconds for all people to get inside (see Figure 5.7).
Table 5.2: Parameters used for Metro Panic scenario
.
Parameter Min Max Step size mean(O) −0.8 0.8 0.2 std(O) 0.0 1.0 0.2 mean(C) −0.8 0.8 0.2 std(C) 0.0 1.0 0.2 mean(E) −0.8 0.8 0.2 std(E) 0.0 1.0 0.2 mean(A) −0.8 0.8 0.2 std(A) 0.0 1.0 0.2 mean(N) −0.8 0.8 0.2 std(N) 0.0 1.0 0.2 Wait goal 0 1 0.1 Escape goal 0 1 0.1 Std. for self 0 1 0.1 Std. for crowd 0 1 0.1 Panic threshold 0 1 0.1
5.3.1
Video Tracking
We selected evenly-positioned 14 people in the crowd from the video and recorded their time to enter the store. Similar to Ankara Attack scenario, we transformed the pixel coordinates of initial positions of the selected people to virtual scene positions. In the virtual crowd, according to initial positions, created clusters of virtual agents, according to their proximities to the tracked people. In the scenario, the sum of differences between the average time to enter the store of the cluster and recorded time to enter the store of the representing agent.
5.3.2
Virtual Scene
We have created a virtual scene with 400 waiting outside the shop (see Figure 5.8). At the beginning of the scenario, we assign the agents to their representative tracked person, forming a cluster around the tracked people. We also select a weighted random destination for each virtual agent inside the shop. The weights
Figure 5.8: Virtual simulation of Black Friday incident.
used in selecting the random destination are whether the agent is on the left side of the crowd or right. Depending on this, the selected random destination is more likely to be in the same side as the agent. The virtual gate starts to open after two seconds from the scenario beginning at 0.25 m/s speed. When the gate starts opening, virtual agents try to push towards the gate, similar to what happens in the video. To simulate the people getting inside the shop before the gate is fully open, we assigned a random threshold height between 1 m and 1.8 m for each virtual agent so that after the gate height is above the threshold, the agent can cross the shop.
The error function that we used for optimizing the model for the black friday scenario is basically the difference between the tracked time-to-enter and average simulated time-to-enter for the tracked people. For each virtual agent, we register the time to enter the store and after all agents in the scene enters the store, we calculate the average time to enter store of clusters and sum the differences between the cluster averages and tracked people. With n being number of tracked people, tai being the ith tracked person, aai,j being the jth virtual agent assigned
being the time to enter the store for tai and aai,j, respectively, the error function
can be formulated as:
error = n X i=1 |t(tai) − Pci j=1t(aai,j) ci |
5.3.3
Tuning Parameters
We have 16 tunable variables in this scenario (cf. Table 5.3). Ten of these vari-ables, as in the other scenarios, consist of mean and standard deviation of dis-tributions of five OCEAN personality traits. We defined a goal to pass the gate, displeasure towards the other shoppers, and some stimulating factor towards the sales event. If the neuroticism value of an agent is below a threshold, which is also a tuning variable, then the stimulating factor is used as “hope to get wanted items”. If the neuroticism level is above the threshold, then the stimulating factor represents the “fear of not getting the items”.
Table 5.3: Parameters used for Black Friday scenario. Parameter Min Max Step size mean(O) −0.8 0.8 0.2 std(O) 0.0 1.0 0.2 mean(C) −0.8 0.8 0.2 std(C) 0.0 1.0 0.2 mean(E) −0.8 0.8 0.2 std(E) 0.0 1.0 0.2 mean(A) −0.8 0.8 0.2 std(A) 0.0 1.0 0.2 mean(N) −0.8 0.8 0.2 std(N) 0.0 1.0 0.2 Standard for Gate 0 1 0.1 Crowd Displeasure 0 1 0.1 Sales Fear 0 1 0.1 Sales Hope 0 1 0.1
Chapter 6
Results and Discussion
At a higher level, because this is a work of tuning parameters to reduce a de-fined error, we expect the output of the error function to get smaller as we run experiments and tune the parameters accordingly. With the nature of our multi-pass greedy tuning approach and the indeterministic behavior of the simulation, causing the error function to be indeterministic too, we predict that the process would include fluctuations.
In our experiment results, we observe that the error tends to go down as we perform more experiments and tune the parameters accordingly (see Figure 6.1). The improvement happens in a faster rate at the beginning, because of the over-written default values but especially after the first pass, the improvement pace slows down and especially on the Black Friday scenario it is very difficult to notice the improvement after about 150 experiments.
0 50 100 150 200 250 300 350 400 450 500 550 600 650 55
60
Number of Experiments Performed
Error
(m
·
s
)
(a) Ankara Attack
0 50 100 150 200 250 300 350 400 450 500 550 600 650 3
3.5 4 4.5
Number of Experiments Performed
Error (s ) (b) Subway Panic 0 50 100 150 200 250 300 350 400 450 500 550 600 650 700 3 3.5 4 4.5
Number of Experiments Performed
Error
(s
)
(c) Black Friday
Figure 6.1: Tendency of error as more experiments performed.
Notice that the error values do not go in a non-increasing fashion. The fluc-tuations in the error graphs have two possible reasons. The first reason is, due to the parameter estimation algorithm, different values for single parameter are tested over time and we can expect an actual improvement only when the com-plete range of values for a parameter is evaluated and a local optimum is chosen
for that parameter. The second reason is that the underlying Durupınar crowd system is not deterministic; that is, even if the same simulation is performed with the same parameter configuration, the results vary significantly. In order to achieve more stable simulation results, we have run each experiment multiple times, which we call these experiments a repetition group, and recorded the aver-age of observed error within a repetition group as the error value of a parameter configuration.
As parameters are tuned further, we expect the minimum, mean and maximum error values observed within the tuning groups to go down as well. In this context, a tuning group is a set of experiments where one parameter changing its value and other parameters are fixed. This is because parameters together affect the the simulation results and as more parameters are in their ’correct’ values, the effect of one ’wrong’ parameter would be smaller. Our results show that this is the case, especially for Ankara Attack and Metro Panic scenarios, as more parameters are tuned, the range of observed error values go down (see Figure 6.2). On the Black Friday scenario, blessing of indeterminism plays a role and the best error is reached in the earliest stages but as more parameters are tuned, the results become more stable. Ideally, this graph would be a non-increasing one, because every step represents one more tuned parameter, that would result with a new error value which is less than or equal to the previous one. Although the indeterminism of the simulation causes fluctuations, observed errors tend to go down.
0 10 20 30 40 50 60 70 80 50
60
Number of Tuned Parameters
Error (m · s ) Min. Error Mean Error Max. Error
(a) Ankara Attack
0 10 20 30 40 50 60 70 80
2 3 4 5
Number of Tuned Parameters
Error (s ) Min. Error Mean Error Max. Error (b) Subway Panic 0 10 20 30 40 50 60 70 80 3 4 5
Number of Tuned Parameters
Error (s ) Min. Error Mean Error Max. Error (c) Black Friday
We expected that performing multiple passes of parameter tuning, i.e. after tuning all parameters and setting them to their observed bests restarting from the first parameter to tune all parameters, would decrease the error function further. This is because we believe that, although the parameters themselves (personality traits, goals, standards, etc.) are independent of each other, their influence of agent behavior and overall simulation results are not. Therefore, the observed optimum value of a parameter may change according to changed val-ues of other parameters. Indeed our experiments show that performing multiple tuning iterations would increase simulation accuracy as can be seen in Figure 6.3.
Overall, the results that can be observed from Figure 6.1, Figure 6.2 and Fig-ure 6.3 show that our methodology can allows simulations to resemble the real world events. Next, we observe the sensitivities of parameters in each scenario, that is the amount of change in error changing a parameter values causes. Sen-sitivity allows determining the order of significance and granularity of tuning ranges of parameters.
1 1.5 2 2.5 3 3.5 4 4.5 5 50 60 Iterations Passed Error (m · s ) Min. Error Mean Error Max. Error
(a) Ankara Attack
1 1.5 2 2.5 3 3.5 4 4.5 5 2 3 4 5 Iterations Passed Error (s ) Min. Error Mean Error Max. Error (b) Subway Panic 1 1.5 2 2.5 3 3.5 4 4.5 5 3 4 5 Iterations Passed Error (s ) Min. Error Mean Error Max. Error (c) Black Friday
Figure 6.3: Tendency of error with tuning iterations
Initially, we expected parameter sensitivities to go down as parameters are being tuned, as more parameters get tuned, the error would decrease and the effect of changing single parameter while other parameters are fixed on their lat-est optima would get smaller over time. However, the experiment results (see
Figure 6.4) show that there is no correlation between overall parameter sensitiv-ity and number of experiments performed. We suspect that the indeterministic nature of the simulations and the amount of change in the error due to optimiza-tions being smaller than the actual sensitivity of a parameter; i.e., the change in error when a parameter is changed could cause such behavior.
0 50 100 150 200 250 300 350 400 450 500 550 600 2 3 4 Experiments Performed Sensitivit y (m · s )
(a) Ankara Attack
0 50 100 150 200 250 300 350 400 450 500 550 600 0.4 0.5 0.6 0.7 Experiments Performed Sensitivit y (s ) (b) Subway Panic 0 50 100 150 200 250 300 350 400 450 500 550 600 650 700 0.3 0.4 0.5 0.6 Experiments Performed Sensitivit y (s ) (c) Black Friday
In Ankara Attack scenario, we expected the most sensitive parameters to be the ones about survival instincts, which are the standards that agents have for themselves, their fear threshold to start panicking, goals about running away from the explosion. In our results, as shown in Figure 6.5, we confirm that individuals’ standards for themselves and goal about the explosion have the highest sensitiv-ity. Personality parameters have slightly less significance compared to appraisal elements because they usually affect the reactions indirectly. It is not surprising that neuroticism trait is one of the most significant traits because it is directly connected to the contagion of fear. Conscientiousness trait is also a significant parameter. One explanation to this observation is that because the conscien-tiousness of agents affect the collision avoidance of the agents, it can affect the escape paths of the agents, thus affecting the error function. The distribution variations of personality traits have the less significant parameters. This can be assessed as extend of individual differences do not matter because the crowd reaction converges quickly.
0 2 4 6 8 10 12 o-std c-std e-std e-mean a-std n-std a-mean o-mean n-mean initial-standard-others c-mean escape-goal initial-standard-self panic-threshold wait-goal 2.42 3.19 4.36 5.15 5.19 5.34 6.21 7.67 8.15 8.16 8.24 8.61 8.76 9.15 10.93 Sensitivity (m · s)
The nature of the Subway Panic scenario is very similar to Ankara Attack scenario: survival by escaping from a danger source. This leads us to have similar expectations with Ankara Attack scenario, the most important factors would be about the survival. The experiments showed that, as it can be seen in Figure 6.6, the most sensitive parameters of Subway Panic scenario is very similar to the ones in Ankara Attack scenario. The survival reaction related parameters (escape-goal, wait-goal, neuroticism, standard about self and others) are the most sensitive parameters. However, we would expect the wait goal to have more significance because the fear loads slower than Ankara Attack scenario and tendency to wait as nothing has happened to be a more determining factor. Similarly, we would expect conscientiousness to be a more significant parameter as in Ankara Attack scenario although the actual trajectories of agents are not considered in the error function here. 0 0.2 0.4 0.6 0.8 1 1.2 1.4 1.6 n-std e-std o-std o-mean c-std e-mean c-mean a-std a-mean wait-goal initial-standard-others panic-threshold n-mean escape-goal initial-standard-self 0.46 0.59 0.69 0.78 0.86 0.98 1.04 1.09 1.17 1.19 1.2 1.34 1.39 1.44 1.58 Sensitivity (s)
Figure 6.6: Parameter Sensitivities of Subway Panic Scenario.
competing with each other to get their desired items, which is also about survival in primal sense [39]. Similar to the subway panic scenario, the error function is geared towards capturing a more realistic human flow through a gateway. With these in mind, we expect the wait-goal, which is directly related to people rush-ing towards the shop and passrush-ing under the gate before it is fully open; attitude towards the other members of the crowd (general-liking, crowd-displease), which affects the amount of pushing between agents and goals towards getting into the shop (sales-hope, sales-fear) to be the most significant parameters. The exper-iments (Figure 6.7) showed results that mostly satisfy our expectations. The wait-goal is the most significant factor because it directly affects the error func-tion and crowd-displease is the second for directly affecting the crowd flow. In contrary to what we expected, sales-fear factor is one of the less significant pa-rameters. We observed that fear factor in this scenario didn’t affect the agent behavior until they enter the store and because our error function considers only the motion of entering the store, rather than what happens afterwards, it became a less significant parameter.
0 0.2 0.4 0.6 0.8 1 1.2 1.4 1.6 1.8 e-std o-std n-std a-mean sales-fear o-mean a-std c-std e-mean c-mean general-liking n-mean standard-for-gate sales-hope crowd-displease wait-goal 0.24 0.61 0.71 0.75 0.9 0.91 0.99 1.02 1.16 1.23 1.23 1.34 1.36 1.37 1.55 1.67 Sensitivity (s)
Finally, fhe found optima for parameters of the scenarios can be seen in Ta-ble 6.1. We can see that the found values for personality parameters are corre-lated.
Table 6.1: Optimum values for Ankara Attack scenario parameters. Parameter Value Parameter Value
Ankara Attack mean(O) 0.6 std(O) 0.4 mean(C) 0.2 std(C) 0.2 mean(E) 0.2 std(E) 0.8 mean(A) −0.2 std(A) 0.0 mean(N) 0.6 std(N) 0.6
Wait goal 0.5 Escape goal 0.4 Std. for self 0.7 Std. for crowd 0 Panic threshold 0.5 Subway Panic mean(O) 0.4 std(O) 0.8 mean(C) 0.4 std(C) 0.4 mean(E) 0.4 std(E) 0.4 mean(A) −0.8 std(A) 0.2 mean(N) 0.4 std(N) 0.2
Wait goal 0.2 Escape goal 0.6 Std. for self 0.4 Std. for crowd 0.6 Panic threshold 0.3 Black Friday mean(O) 0.2 std(O) 0.8 mean(C) 0.4 std(C) 0.6 mean(E) 0.6 std(E) 0.4 mean(A) −0.4 std(A) 0.8 mean(N) 0.6 std(N) 0.4
Gate Standard 0.7 Crowd Displeasure 0.5 Sales Fear 1.0 Sales Hope 0 Wait Goal 0.5
Chapter 7
Conclusion, Limitations and
Future Work
We propose a generic method for validating and optimizing by tuning parameters of crowd simulation models by learning from real-life incidents. We describe the nature of suitable incidents for this purpose and steps involved in data extraction from them. We then optimize Durupınar emotion contagion model with respect to a subset of individuals in such an incident by learning personality parameters from real videos and tuning them one by one. We apply the process on three separate incidents and discussed performance of the proposed method and our findings about the incidents.
As a possibility of future work, we could repeat what we did on Ankara At-tack scene with more agents tracked for a longer time span. To achieve this, multiple and clearer video tracks of similar events are required. This would be possible by gaining more access to press media, professional or surveillance cam-era footages. Repeating the work done in this study for other kinds of incidents, such as protests, stampedes, riots, looting incidents, natural disasters, and so on, would show value for augmenting the learned personality distribution and improving the emotion contagion model.
By collecting media for real-life incidents and processing them, we could ac-quire solid evidence about the personalities of different cultures. By optimizing the learned parameters from multiple incidents in a region, we could extract the actual distribution of personalities in the area and use these learned personali-ties for the simulation of possible incidents in order to understand how people would react in such events. This could be used to take precautions and design streets, public gathering areas and crowded buildings such as shopping malls and airports.
We use the barycentric coordinates for projecting positions from the camera to the scene thus ignoring the distortions caused by lenses. If we had more reference points or details about the characteristics of the cameras used, we could use intrinsic and/or extrinsic camera parameter extraction techniques to estimate the projection matrix of the pinhole model of the camera. With this camera matrix, we could reverse the projection from the camera to the 3D world, which would result in a more accurate projection model.
For the parameter optimization problem, we try to optimize the personality parameters independently. Although the underlying OCEAN personality model depicts them as orthogonal traits, their mappings to behaviors and the outcomes of these behaviors would affect each other. Therefore, more general and stable parameter optimization methods, like genetic algorithms or support vector ma-chines, would produce faster and more accurate results. Moreover, the parameter estimation could be expanded to the amount of emotion doses according to the reactions to events, goals and response thresholds.
As the error function of Ankara Attack incident, we use the sum of distances between the tracked agents and their corresponding virtual agent. Although this metric is beneficial for estimating the running speeds, directions and reaction times, using more accurate metrics could lead to better understanding on the decisions made by the agents. One such metric could be the proportion of people doing action ak, 1 ≤ k ≤ n in a set of actions {ai, i ∈ 1, . . . , n}. For example,
the parameters for multiple metrics at the same time would help produce more robust models.
The immense computational requirements of the emotion contagion models and parameter estimation techniques limit us on the number of tuning iterations, granularity of parameter ranges, crowd size of studied incidents etc. Improvement in the results of this study can be achieved by dedicating more computational resources and time on the tuning process and working on areas of computational optimization in the crowd simulation model implementation.
Bibliography
[1] R. W. Brown, The Handbook of Social Psychology, G. Lindzey (ed.), ch. Mass Phenomena, pp. 833–876. Cambridge, MA: Addison-Wesley, 1954.
[2] P. S. Dodds and D. J. Watts, “A generalized model of social and biological contagion,” Journal of Theoretical Biology, vol. 232, no. 4, pp. 587–604, 2005.
[3] A. Bera, S. Kim, and D. Manocha, “Efficient trajectory extraction and pa-rameter learning for data-driven crowd simulation,” in Proceedings of the 41st Graphics Interface (GI ’15), pp. 65–72, Canadian Information Process-ing Society, 2015.
[4] M. R. Carretero, “Expression of emotion in virtual crowds: Investigating emotion contagion and perception of emotional behaviour in crowd simula-tion,” Master’s thesis, Department of Computer Science and Communica-tions, KTH Royal Institute of Technology, 2014.
[5] P. Charalambous, I. Karamouzas, S. J. Guy, and Y. Chrysanthou, “A data-driven framework for visual crowd analysis,” Computer Graphics Forum, vol. 33, no. 7, pp. 41–50, 2014.
[6] F. Durupınar, U. G¨ud¨ukbay, A. Aman, and N. I. Badler, “Psychological parameters for crowd simulation: From audiences to mobs,” IEEE Transac-tions on Visualization and Computer Graphics, vol. 22, no. 9, pp. 2145–2159, 2016.
emo-Conference on Affective Computing and Intelligent Interaction, pp. 256–266, Springer, 2011.
[8] M. Hoogendoorn, J. Treur, C. N. van der Wal, and A. van Wissen, “An agent-based model for the interplay of information and emotion in social diffusion,” in Proceedings of the IEEE/WIC/ACM International Conference on Web Intelligence and Intelligent Agent Technology, vol. 2, pp. 439–444, IEEE Computer Society, 2010.
[9] B. G. Silverman, N. I. Badler, N. Pelechano, and K. O’Brien, “Crowd simu-lation incorporating agent psychological models, roles and communication,” tech. rep., Center for Human Modeling and Simulation, University of Penn-sylvania, 2005.
[10] A. Borodin, Y. Filmus, and J. Oren, “Threshold models for competitive influ-ence in social networks,” in WINE 2010: Internet and Network Economics, Lecture Notes in Computer Science, vol. 6484, pp. 539–550, Springer, 2010.
[11] W. Chen, C. Wang, and Y. Wang, “Scalable influence maximization for prevalent viral marketing in large-scale social networks,” in Proceedings of the 16th ACM SIGKDD International Conference on Knowledge Discovery and Data Mining, pp. 1029–1038, ACM, 2010.
[12] S. Lemercier and J.-M. Auberlet, “Towards more behaviours in crowd simu-lation,” Computer Animation and Virtual Worlds, vol. 27, no. 1, pp. 24–34, 2016.
[13] D. Helbing and P. Molnar, “Social force model for pedestrian dynamics,” Physical Review E, vol. 51, no. 5, p. 4282, 1995.
[14] D. Helbing, I. Farkas, and T. Vicsek, “Simulating dynamical features of escape panic,” Nature, vol. 407, no. 6803, pp. 487–490, 2000.
[15] N. Fridman and G. A. Kaminka, “Comparing human and synthetic group behaviors: A model based on social psychology,” in Proceedings of the Inter-national Conference on Cognitive Modeling (ICCM-09), 2009.
[16] K. H. Lee, M. G. Choi, Q. Hong, and J. Lee, “Group behavior from video: a data-driven approach to crowd simulation,” in Proceedings of the ACM SIGGRAPH/Eurographics symposium on Computer animation, pp. 109–118, Eurographics, 2007.
[17] A. Lerner, Y. Chrysanthou, and D. Lischinski, “Crowds by example,” in Computer Graphics Forum, vol. 26, pp. 655–664, Wiley Online Library, 2007. [18] S. Singh, M. Kapadia, P. Faloutsos, and G. Reinman, “SteerBench: a bench-mark suite for evaluating steering behaviors,” Computer Animation and Vir-tual Worlds, vol. 20, no. 5-6, pp. 533–548, 2009.
[19] S. R. Musse, V. J. Cassol, and C. R. Jung, “Towards a quantitative approach for comparing crowds,” Computer Animation and Virtual Worlds, vol. 23, no. 1, pp. 49–57, 2012.
[20] G. Berseth, M. Usman, B. Haworth, M. Kapadia, and P. Faloutsos, “En-vironment optimization for crowd evacuation,” Computer Animation and Virtual Worlds, vol. 26, no. 3-4, pp. 377–386, 2015.
[21] Y. Lin, I. Fedchenia, B. LaBarre, and R. Tomastik, “Agent-based simulation of evacuation: An office building case study,” in Pedestrian and Evacuation Dynamics 2008, pp. 347–357, Springer, 2010.
[22] L. Tan, H. Lin, M. Hu, and W. Che, “Agent-based simulation of build-ing evacuation usbuild-ing a grid graph-based model,” in IOP Conference Series: Earth and Environmental Science, vol. 18, p. 012123, IOP Publishing, 2014. [23] T. Bosse, R. Duell, Z. A. Memon, J. Treur, and C. N. Van Der Wal, “Multi-agent model for mutual absorption of emotions,” in Proceedings of the 23rd European Conference on Modelling and Simulation (ECMS ’09), pp. 212– 218, ECMS, 2009.
[24] T. Bosse, R. Duell, Z. A. Memon, J. Treur, and C. N. Van Der Wal, “A multi-agent model for emotion contagion spirals integrated within a supporting ambient agent model,” in Proceedings of the International Conference on Principles and Practice of Multi-Agent Systems (PRIMA 2016), pp. 48–67,
[25] T. Bosse, M. Hoogendoorn, M. C. Klein, J. Treur, C. N. Van Der Wal, and A. Van Wissen, “Modelling collective decision making in groups and crowds: Integrating social contagion and interacting emotions, beliefs and intentions,” Autonomous Agents and Multi-Agent Systems, vol. 27, no. 1, pp. 52–84, 2013.
[26] J. Tsai, E. Bowring, S. Marsella, W. Wood, and M. Tambe, “A study of emo-tional contagion with virtual characters,” in Proceedings of the Internaemo-tional Conference on Intelligent Virtual Agents (IVA ’12), pp. 81–88, Springer, 2012.
[27] J. Tsai, N. Fridman, E. Bowring, M. Brown, S. Epstein, G. Kaminka, S. Marsella, A. Ogden, I. Rika, A. Sheel, et al., “ESCAPES: Evacuation Simulation with Children, Authorities, Parents, Emotions, and social com-parison,” in Proceedings of the 10th International Conference on Autonomous Agents and Multiagent Systems (AAMAS ’11), vol. 2, pp. 457–464, IFAA-MAS, 2011.
[28] J. Tsai, E. Bowring, S. Marsella, and M. Tambe, “Empirical evaluation of computational fear contagion models in crowd dispersions,” Autonomous Agents and Multi-agent Systems, vol. 27, no. 2, pp. 200–217, 2013.
[29] L. Festinger, “A theory of social comparison processes,” Human Relations, vol. 7, no. 2, pp. 117–140, 1954.
[30] A. Borges Fortes Neto, C. Pelachaud, and S. R. Musse, Giving Emotional Contagion Ability to Virtual Agents in Crowds, pp. 63–72. Cham: Springer International Publishing, 2017.
[31] A. d. L. Bicho et al., “Da modelagem de plantas `a dinˆamica de multid˜oes: um modelo de anima¸c˜ao comportamental bio-inspirado,” 2009.
[32] F. Durupınar, N. Pelechano, J. M. Allbeck, U. G¨ud¨ukbay, and N. Badler, “How the Ocean personality model affects the perception of crowds,” IEEE Computer Graphics and Applications, vol. 31, no. 3, pp. 22–31, 2011.
[33] A. Ortony, G. L. Clore, and A. Collins, The Cognitive Structure of Emotions. Cambridge, MA: Cambridge University Press, 1988.