Does the Interaction Between Growth Determinants A Drive For Global
Environmental Sustainability? Evidence from World Top 10 Pollutant
Emissions Countries
Kayode Kolawe Eluwole
e
Faculty of Tourism Management, Department of Tourism, Famagusta, Eastern Mediterranean University, North Cyprus, via Mersin 10, Turkey.
Email: [email protected]
Seyi Saint Akadiri
1a
International Economics and Management Department, Graduate School of Economics and Management, Ural Federal University, Ekaterinburg, Russia.
b
College of Business, Westcliff University, Irvine, California, United States. Correspondent Author: [email protected]
Andrew Adewale Alola
c Faculty of Economics, and Administrative and Social Sciences, Istanbul Gelisim University, Istanbul, Turkey.
d
Department of Financial Technologies, South Ural State University, Chelyabinsk, Russia. Email: [email protected]
Mfonobong Udom Etokakpan
e
Faculty of Business and Economics, Department of Economics, Famagusta, Eastern Mediterranean University, North Cyprus, via Mersin 10, Turkey.
f
Economics Department, Babcock University, Ogun State Email: [email protected]
Abstract:
Economic interdependence through foreign direct investment and trade of energy resources in a globalized world filled with mixed heritage sites stimulates economic activities thereby serving as a great catalyst for economic growth. However, the importance of these economies’ interdependence transcends economic and socio-cultural-political benefits to coastal protection, carbon sequestration, flood prevention and soil stabilization amongst others. To this end, this study seeks to examine whether the interdependence and interaction among foreign direct investment, energy consumption, real income is a drive for global environmental sustainability targets or not. In order to achieve our research objective, we make use of a panel-based study of world’s top 10 pollutant emissions that comprises 37 developed countries of the world, using the Dynamic Autoregressive Distributed Lag techniques of Pooled Mean Group, Mean Group and Dynamic Fixed Effects estimators over the periods of 1995-2014 that incorporate tourism as an additional variable. Panel cointegration result shows that increase in explanatory variables contributes to environmental degradation in the long-run. A 1% increase in kg oil equivalent of energy consumed led to 0.918% increase in environmental degradation, while a 1% increase real income and foreign direct investment decrease environmental degradation by 0.635% and 0.064%, with tourism insignificant impact in the long-run. Consequently, economic and environmental sustainability measures that would help to promote a cleaner and healthy environment globally for both the immediate and future generation were suggested.
1. Introduction
Developed countries are faced with the dichotomous challenge of balancing the quest for economic growth and its associated risks for the environment. Without doubt, most developed nations are aware of the threat that economic development poses to the environment and thus strive to put in place environmental-friendly policies to augment the hazardous effect of growth on the environment. Understandably, such efforts have yielded positive results but not at the rate with which the concerns for global environmental sustainability is growing. The twenty-first century has been characterized has the jet-age; one in which the entire world has become globalized into a small village thanks to the advancement in technology. This evolution from local individualized states into the globally interconnected world has countless benefits however, with such development comes a greater anthropogenic influence of man (Sarkis, & Zhu, 2018). Notably, the anthropogenic interference of man via economic growth and development is causing a harmful effect on the environment.
Characteristically, an improved economy translates to increased energy consumption (renewable and non-renewable) as energy use is the bedrock of economic growth (Paramati, Sinha, & Dogan, 2017). Undoubtedly, increased energy consumption is tantamount to the emission of greenhouse gas (CO2) and the depletion of non-renewable resources. This obviously raises ecological concerns as CO2 emission is known to be among the key contributor to environmental degradation and global warming (Wang, 2019). While environmental degradation is a problem, many believed that with appropriate policies and approach, it 1can be controlled without hampering economic growth (Omri, Euchi, Hasaballah, & Al-Tit, 2019).
Developed economies are heavily industrialized with economic growths driven by foreign investment in dirty industries and high energy use resulting in degradation (Paramati et al., 2017;
Shahbaz, Balsalobre-Lorente, & Sinha, 2019). The coupling relationship between foreign direct investment (FDI) and economic growth have become a critical topic, locally and globally. Several scholars have argued that FDI accelerates economic growth. They indicate that through FDI, countries have direct access to capital financing, productivity gain, technology transmission and generate of positive externalities; all of which enhances economic development (Koçak, & Şarkgüneşi, 2018; Lee, 2013). On the contrary view, environmentalist argued that FDI worsens environmental conditions of the recipient nation. They indicate that support for FDI is support for pollution haven hypothesis which posits that inward FDI aggravates environmental degradation (Lan, Kakinaka, & Huang, 2012; Shao, Wang, Zhou, & Balogh, 2019).
Recently, the nexus of economic growth, energy consumption, FDI, real income and environmental sustainability have taken the central stage among scholars and policymakers (see Omri et al., 2019; Saint Akadiri, Alkawfi, Uğural, & Akadiri, 2019; Saint Akadiri, Bekun, & Sarkodie, 2019). One glaring conclusion from these studies is that the increase in energy consumption, FDI, real income and economic growth lead to an increase in pollution which impacts environmental sustainability negatively. Although in developed states preventive legislation, sound environmental policies, and energy-efficient technologies are put forward to mitigate the effect of pollution, the reality still shows that develop nations constitutes the highest pollutant. Thus, energy consumption, FDI and real income are significant determinants of environmental degradation.
Economic interdependence through foreign direct investment and trade of energy resources in a globalized world filled with mixed heritage sites stimulates economic activities thereby serving as a great catalyst for economic growth. However, the importance of these economies’ interdependence transcends economic and socio-cultural-political benefits to coastal protection,
carbon sequestration, flood prevention and soil stabilization amongst others. To this end, this study seeks to examine whether the interdependence and interaction among foreign direct investment, energy consumption, real income is a drive for global environmental sustainability targets or not. In order to achieve our research objective, we make use of a panel-based study of world’s top 10 pollutant emissions that comprises 37 developed countries of the world, using the Dynamic Autoregressive Distributed Lag techniques of Pooled Mean Group, Mean Group and Dynamic Fixed Effects estimators over the periods of 1995-2014 that incorporate tourism as an additional variable.
This study offers a number of contributions. Firstly, the result of our empirical analysis revealed that a percentage increase in real income and FDI results in 0.635% and 0.064% reduction in environmental degradation on the long-run. This result suggests that these countries are already implementing efficient environmental policies that are gradually driving them towards environmental sustainability. Secondly, we found that a 1% increase in kg oil equivalent of energy consumed led to 0.918% increase in environmental degradation. This indicates that energy consumption in the countries under investigation results in decreasing environmental degradation. Thus, both on the short and long run, variations in the macroeconomics variable of energy consumption represents a drive for environmental sustainability for the case of the 37 countries in the current study. Lastly, based on the empirical findings of this study, we inferred that environmental and energy policies and regulations will only catapult these countries towards better environmental quality as their economic growth is not dependent on energy consumption.
2. The Role of Macroeconmic Variables in Environmental Sustainability
2.1 Energy Sources and FDI as Environmental Determinants
The roles of macroeconomic variables of concerns in this study have been well documented in the literature. For instance, globally, the debate regarding the role of FDI in attaining environmental sustainability is still ongoing. For example, in the case of Brazil and Singapore, Kostakis, Lolos, and Sardianou, (2017) found that while FDI significantly caused an increase in CO2 emission for Brazil, it does not have the same effect in the case of Singapore. Using heterogeneous panel data of 99 countries, Shahbaz, Nasreen, Abbas, and Anis, (2015) found positive interaction between FDI and CO2 emission. Their findings support pollution haven hypothesis and also indicated in the case of global panel and middle-income panel, a quadratic relationship also existed thus while FDI causes environmental degradation at first, such impact reduces with time and later result in better environmental quality. In the context of Middle-east and African Nations (MENA), Shahbaz et al. (2019) revealed that in the absence of authoritarian policy, FDI partly results in environmental pollution. Their study validated the existence of the N-shaped relationship between CO2 emission and FDI. This implies that environmental deterioration starts in the initial phase of FDI but rises with more investment and begin to come down after a certain level of investments have been attained.
Extant literature investigating the role of energy consumption in the environmental sustainability goals abound. Stucley et al. (2004) found for the case of Australia that water quality, soil salinity, soil protection and other forms of environmental improvements can be achieved in a more cost-effective manner through the development of biomass energy. Sarkodie et al. (2019) also found support for the positive contribution of biomass consumption in Australia’s bid to transition to a decarbonized economy as biomass consumption significantly reduces GHG emissions. Bekun,
Emir, and Sarkodie (2019) using data from South Africa found a positive long and short-run association between renewable energy use and CO2 emission. Using panel data from France, Germany and the UK, Alola, Yalçiner, Alola, and Saint Akadiri (2019) revealed evidence of Granger causality between CO2 emission and renewable energy consumption.
2.2 Economic Growth as Environmental Determinant
In examining the role of economic growth in environmental sustainability, Salahuddin, Alam and Ozturk (2016) employed the Organization for Economic Co-operation and Development (OECD) as a case study for the experimental period 1991-2012. Accordingly, and by the using the Pooled Mean Group, the study found that economic growth has no significant short-term and long-term impact on carbon emissions in the panel of OECD countries. However, the evidence of economic growth and carbon emissions in the studies of Kais and Sami (2016) and Narayan, Saboori and Soleymani (2016) are slighty different. While investigating the growth and carbon emission nexus for 181 countries, Narayan, Saboori and Soleymani (2016) found that income growth is responsible for environmental degradation in 49 of the 181 countries (representing 27% of the examined countries). Similarly, Kais and Sami (2016) equally found that income growth drives the growth of carbon emissions positively for the global panel. Since the study also evaluated the aforementioned relationship for three regional sub-groups, it further found that income growth worsen the environment in the Europe and North Asia, the Middle Eastern, North Africa, and in the sub-Saharan Africa. Nothwithstanding, Kais and Sami (2016) further revealed that the inverted U-shaped (the EKC) hypothesis is also preserved in the examined cases. Moreover, Saint Akadiri et al. (2019b) and Saint Akadiri et al. (2019a) respectively concluded that real income significantly increases environmental quality for the case of South Africa and that real income Granger cause CO2 emission for the case of Italy. Whereas, Usman, Iorember,
and Olanipekun (2019) also found unidirectional Granger causality from real income to environmental degradation.
3. Data and Methodological Framework
3.1 Data
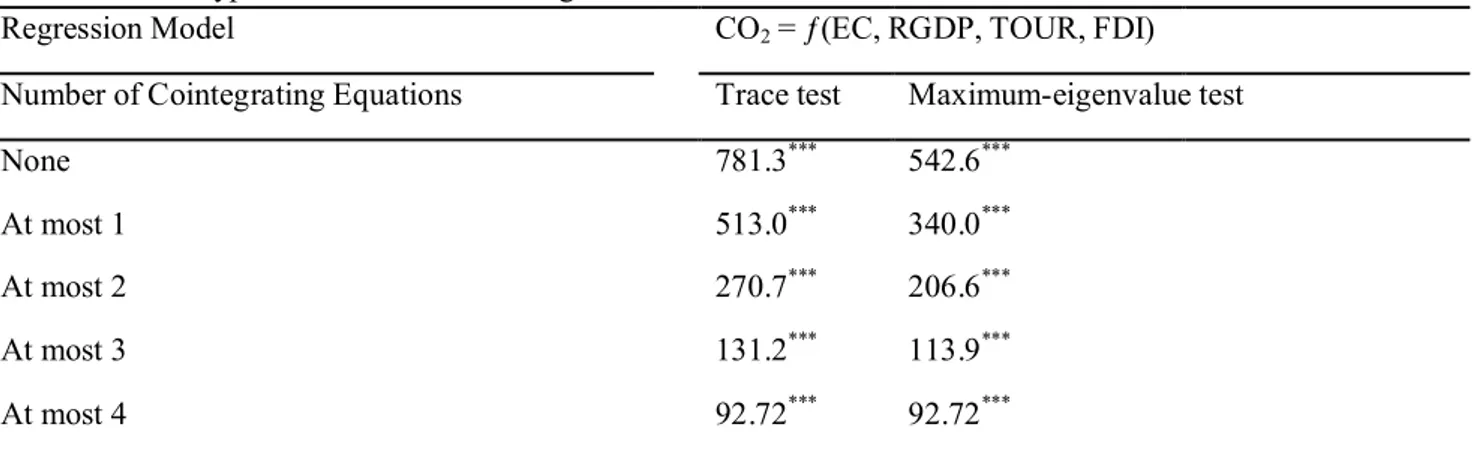
This study employed a panel of the world’s top 10 pollutant emissions that comprises a total of 37 developed countries of the world, the time frame span from 1995 – 2014 and the data are sourced from the world development indicator (WDI) database. The time frame of the study is restricted due to the availability of data for the choice of variables. While the summary of variable descriptions are expressed in Table 1, these variables of interest are further discussed
<Insert Table 1>
Carbons Emissions (CO2): This is the dependent variable used as a proxy for the environment.
The unit of measurement of carbon emissions (CO2) is metric tons per capita. In this study, a positive percentage change in CO2 indicates environmental degradation which implies that the environment lacks sustainability.
Real Gross Domestic Product per Capita (RGDPC): This variable is used as an independent variable to proxy for economic growth. The RGDPC USD figures are transformed by applying the current exchange from the local currencies. A positive change in the RGDPC in this study signifies economic growth (Lee & Brahmasrene, 2013; Ng, Lye, & Lim, 2016).
Foreign Direct Investment (FDI): For this study, we proxy FDI as net inflow. that is the balance of payment in USD. For the purpose of sensitivity analysis, this variable has been employed because it has been seen as a major determinant of economic growth and by extension environmental sustainability.
Tourism (TOURI): This independent variable is proxy by tourism receipts and measured in per capita current USD. This tourism variable comprises of expenditures by international inbound visitors including payment for goods and services obtained in the destination countries as well as any other payment made for the purpose of international transport to the resident carriers (Lee & Ng et al., 2016).
Energy Consumption (EC): This variable is measured in kilograms of oil equivalent per capita. It is used to represent the portion of energy or power used. It can also be equated to the indigenous use plus imports and stock changes, automobiles, aircraft used in the international transport and fuels supplied to ships (Lee & Chang, 2008b; Ozturk & Acaravci, 2010).
Pearson correlation coefficient for the variables under consideration is reported in Table 2. The results of the Pearson correlation coefficient for the panel-based series as shown in Table 2 and further supported with graphical illustrations (see Figure 1), reveal a statistically significant positive relationship between CO2, FDI, TOURI and EC at 1% (p < 0.01) level, whereas CO2 and RGDPC is seen to be statistically insignificant, a such a negative relationship exist between these variables. CO2 is positively related to energy consumption, FDI and Tourism at 1% level of significance whereas RGDPC is negatively correlated and statistically insignificant. In like manner, EC is positively and significantly correlated with FDI and TOURI at 1% significant level but RGDPC is negatively related with EC and not statistically significant. Finally, FDI is negatively correlated with TOURI but with a significant statistical coefficient at 1% significance level. The pairwise correlation relationships among the variables of interest are of necessity even though they are subject to change in the presence of panel-based multivariate regression models. This test and others within the panel framework are necessary to enhance an empirically consistent estimations and also avoid spurious results.
<Insert Table 2> <Insert Figure 1> 3.2 Methodological Framework
3.2.1 Dynamic Panel Cointegration Approach (ARDL)
This study seeks to follow the work of Akadiri et al. (2017), Narayan et al. (2010) and host of other studies in the literature such as Lee and Chang (2008b), Dritsakis (2004), Ayres (2000), Balaguer and Cantavella-Jorda (2002) and Khalil, Kakar, and Malik (2007) the study employed a panel-based multivariate model to examine long-run relationship between foreign direct investment, real income, energy consumption and carbon emissions incorporating tourism as an additional variable. The empirical model for the analysis is specified below:
CO2i,t = f (RGDPCi,t, FDIi,t, TOURIi,t, ECi,t) (1) The above equation given its linear natural logarithm can be expressed as:
Ln CO2i,t = β0 + β1 Ln RGDPCi,t, + β2 Ln FDIi,t, + β3 Ln TOURIi,t, + β4 Ln ECi,t + ɛi,t (2) This study employs the typical ARDL model along with the growth model as proposed by Pesaran et al. (1999) that incorporates lagged dependent variables and lagged independent variables in the model:
, = + ∑ Ɣ , + ∑ , + ɛ, (3) Where Ti,t = ( Ln RGDPCi,t, Ln FDIi,t, Ln TOURIi,t, Ln ECi,t).
In Equation (3) for all i = 1, 2, 3, …., N and t = 1, 2, 3, …, T, the vector Tij includes independent variables, represents the country-level fixed effects, while denotes the coefficient of the lagged Ln and represent the coefficients of the lagged independent variables.
The ARDL cointegration methods are superior to other standard cointegration methods as it accounts for short-run and long-run estimates, and endogeneity separately in a single model and
it is widely used by researchers specifically due to this econometric advantage. The order of integration of the variable (whether I(0), I(1) or partially integrated) is inconsequential to this technique and as such, makes this technique unique in this way.
In most cases, many economic variables include stochastic term and these lead to making spurious results that will lead to invalid conclusions. The stationarity of the time series would be possible if the autocovariance of such variables does not depend on time, that is, time-invariant. A macro panel variable is said to have a unit root where the variable is not stationary either in the panel or in time series analysis statistically. Panel-based unit root test in current studies has been observed to have a higher power relative to the individual time series unit root tests (Baltagi, 2008). The panel unit root test as proposed by Maddala and Wu (1999) is employed in this study. Indicatively, the Fisher-ADF and Fisher-PP type, Im, Pesaran, and Shin (2003) and Levin, Lin, and Chu (2002) are all used in the study to investigate the stationarity such that the result is presented in Table 3.
<Insert Table 3>
The ADF as considered by Levin et al. (2002) panel unit root test is specified as: ∆ , = , + ∑ ∆ , + , (4)
The persistence parameters in this test are assumed to be parallel across the cross-sections (implying that = for all i) though the explicit difference may exist in the lag order of . The null hypothesis = 0 for all i as opposed the alternative hypothesis < 0 for all i, is being evaluated by this process. The rejection of the null hypothesis signifies that the panel integration procedure is feasible.
The report of the panel unit root results in Table 3 reveal that most of the variables are non-stationary at level, but integrated at first order I(1), that is the first difference. To further validate
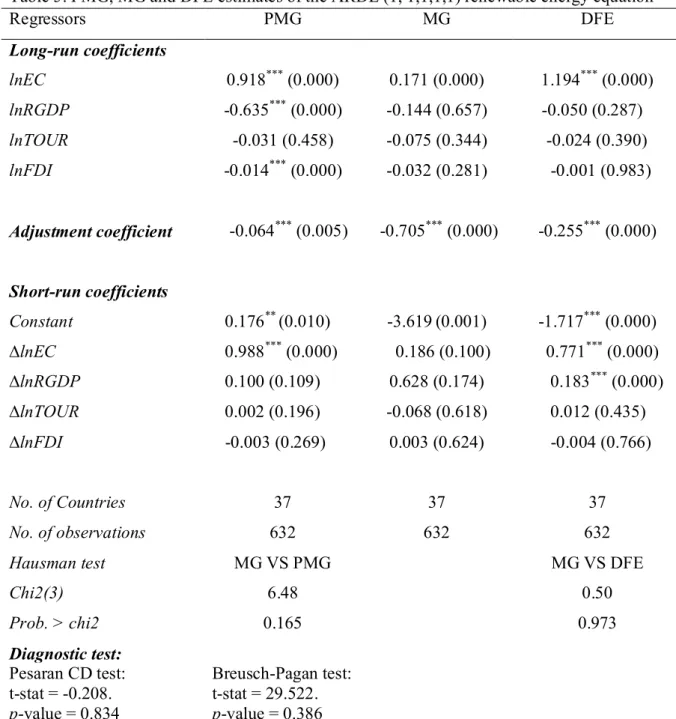
the consistency of the explanatory variables as induced by the stationarity of the variables, the cointegration test was carried out. This test was to augment the ARDL cointegration test results. In this case, the Johansen (1991) panel Fisher-type cointegration test is employed to provide sensitivity on the results reported in Table 4, this check is only possible under the null hypothesis of no cointegration. The results as reported in Table 4 confirm the existence of a long-run equilibrium relationship between RGDPC, FDI, TOURI, EC, and CO2 at the 1% ( < 0.01) level of significance.
<Insert Table 4>
The chosen ARDL model would be estimated using the error correction model (ECM) form for its specification, hence we are rewriting equation (3) in this form below:
∆ , = , − , + ∑ ∗, ∆ , + ∑ ∗ ∆ , + , (5) Where: = −(1 − ∑ ), = − ∑ ( ∑ ) = − ∑ ; ∗ = − ∑ , ; ∗ = − ∑ ,
The adjustment coefficient of growth towards deviation from the long-run equilibrium path of the regressors is given by the first section of equation (5) ( , − , ). The section of the equation (5) accounts for the short-run dynamics of the growth equation. The vector parameter represents the coefficients in evaluating the long-run growth, whereas denotes the speed of adjustment for error correction term. Where the < 0, it suggests strongly that the growth model has evidence of a long-run relationship between , and the regressors. The greater the absolute value of the speed of adjustment term, the faster will be the rate of convergence of the model from the deviation in the short-run towards the long-run equilibrium path and vice versa. If the ≥ 0, this suggests strongly the absence of stable linkage between
the regressors and the dependent variable in the long-run. The two main strongholds of the study are the speed of adjustment parameters ( ) and the long-run coefficients ( ).
By adopting the ARDL frameworks, = = 1 is primarily stated. This is usually used to conduct the empirical investigation for studies that use ARDL models (Frank, 2009; Bassanini & Scarpetta, 2002; Xing, 2012; Martı´nez-Zarzoso & Bengochea-Morancho, 2004). This study in line with other existing studies proposes an ARDL model with = = 1 specification. Hence, the equation given below is an extract of equation (3) by assuming ARDL (1,1):
, = + , + , , + , , + , (6)
Equation (6) can be rewritten in the ECM form as:
∆ , = , − , − , − , ∆ , + , (7)
Where = −(1 − ); = − , ,
; and , = −
The following methods were employed in equation (7) estimations: Dynamic Fixed-Effect (DFE), the Mean Group (MG) method and the PMG (Pooled Mean Group) method. The DFE estimator adopts homogeneity across the cross-sections in the short-run coefficients as well as the long-run coefficients with exception to the intercept term, whereas the MG estimator relaxes the assumption of homogeneity as put forward by Pesaran and Smith (1995). Pesaran, Shin, and Smith (1999) advance that PMG estimator is homogeneous as proposed by the long-run coefficients as well as allows other slope coefficients to differ cross-sectionally. In the case where the N and T are both large, the MG is assumed to be consistent. Where the heterogeneity assumption of the long-run slope coefficient is established, then the PMG estimator is inconsistent. Moreover, according to Blackburne and Frank (2007), once the homogeneity assumption is conceived, the PMG estimator becomes more robust and consistent with regards to the MG estimator. However, in a case where T is small and N is significantly large, the MG
estimator would be sensitive to the sample size and outliers. According to Pesaran et al. (1999), PMG estimator is robust and more reliable to outliers and lag orders. Therefore, the Hausman specification test is usually the suitable and optimal model to employ when choosing between these estimators as indicated in Table 5.
<Insert Table 5> 3.2.2 Panel Granger causality test technique
Dumitrescu and Hurlin (2012) proposed the panel Granger causality test for heterogenous non-causality and was employed in this study. This test is appropriate when N is lesser than T, inversely. With the presence of cross-sectional dependence, the test is reliable because it is built on the vector autoregressive model. The test possesses two specific distributions namely asymptotic and semi-asymptotic distribution. The asymptotic distribution is used when (T) is larger than (N), whereas the semi-asymptotic distribution as employed is the reverse of asymptotic.
Equation (8) below gives the linear model specification as follows: , = + ∑ , + ∑ , + , (8)
From the above equation (8), X denotes environmental sustainability whereas T signifies the vector that captures the independent variables (i.e RGDPC gross domestic product per capita, FDI foreign direct investment, TOURI tourism and EC energy consumption). The ability to account for heterogeneity and be normally distributed is an assumption of the panel Granger causality test. Furthermore, to examine the causal relationship for heterogeneity in panel models requires homogeneous non-stationarity (HNC) proposition. The null and alternative hypothesis test for HNC are specified as follows:
: = 0 ∀ = 1, … . ,
≠ 0 ∀ = + 1, + 2,…. K,
Where the unknown parameter that fulfils the condition 0≤ ⁄ < 1 . The ratio of ⁄ should be predictably less than 1 irrespective of the condition. The case of non-Granger causality relationship within the panel is denoted with = . However, where = 0 then this is an indication that Granger causality relationship exists within the cross-sections. In Table 6, the result of the panel Granger causality as described above is provided in Table 6.
<Insert Table 6>
4. Results and Discussion
The combined results from the correlation matrix (see Table 2) and the cointegration evidence of the Fisher Johansen Panel cointegration (see Table 4) gives a priori information about the relationship between the estimated variables. The statistical evidence implied that carbon emissions exhibit high correlation with almost all the independent variables vis-à-vis the energy consumption (ec), real gross domestic product (rgdp), foreign direct investment (fdi), and tourism (tour). In regard to the evidence of cointegration, it is observed in Table 4 that there exists statistical evidence of at most four (4) cointegrating equation in the estimated model. Hence, the apriori cointegration evidence supports further investigation of cointegration properties such as the short and long-run relationships the pairs of carbon emissions and each of the independent variables. Prior to employing the short and long-run relationship, the graphical observation in Figure 1 further provided interesting relationships between the rgdp, fdi, ec, and
tourism for each of the investigated country. Considering this observation, the trio of Canada,
In regard to the long-run and short-run statistical inference, the Pooled Mean Group (PMG), Mean Group (MG) and the Dynamic Fixed-Effect (DFE) approaches of the autoregressive distributed lag (ARDL) were employed as displayed in Table 5. Given the preference of the PMG over the MG and the DFE after empirical comparison, the results from the PMG is employed for further discussion in the current study. Foremost, the energy consumption (ec) is observed to aggravate environmental pollution in the panel countries because 1 per cent increase in energy consumption is responsible for 91% increase in carbon emissions in the panel countries, especially in the long-run. Although the long-run impact of ec is observed to be lower than the short-run where ec is expected to cause an increase of about 98% emissions of CO2, the effect of energy consumption in the two periods are not desirable. The reason for the high and positive impact of ec on carbon emissions is likely associated with the high share of fossil fuel energy in the energy portfolio of the estimated countries. Similar observations were recorded in the studies of Alola and Alola (2018), Alola (2019a&b), and Bekun, Alola and Sarkodie (2019). Specifically, Alola, Bekun and Sarkodie (2019) found that non-renewable energy consumption is responsible for a significant increase in the environmental degradation of the panel of sixteen (16) European countries in the long-run. Their study posits that a 1 per cent rise in the consumption of non-renewable energy consumption will increase the carbon emissions of the panel countries by about 98%.
Notwithstanding, the long-run relationships between carbon emissions and the real gross domestic product, tourism inbound and foreign direct investment all posits negative impacts. The interpretation suggests that the economic growth as indicated by a per cent increase in the gdp is observed to cause about a 64% decline in environmental hazard of the panel countries. The result further implies that as the economy of the panel countries improves, the air and environmental
quality of the pooled countries also improves. Similarly, the same sentiment is being observed for both the dynamic of tourism inbound and foreign direct investment with carbon emissions in the panel countries. Although the short-run evidence reveals that the rgdp and tour exerts a harmful impact on the environmental quality, the long-run result supports the evidence that the increase or improvement in the rgdp, tourism activities, and foreign direct investment are all essential for the environmental sustainability of the panel countries. In a related observation, the study of Saint Akadiri, Lasisi, Uzuner and Akadiri (2019) showed that the impact of tourism arrivals on carbon emissions in a panel of tourism destination countries is negative especially in the long-run. In extant studies, most investigations have supported the aforesaid dynamics of
rgdp, tour and fdi on carbon emissions for different cases (Sbia, Shahbaz & Hamdi, 2014,
Shahbaz, Nasreen, Abbas & Anis, 2015; Dogan & Aslan, 2017; Sarkodie & Strezov, 2019).
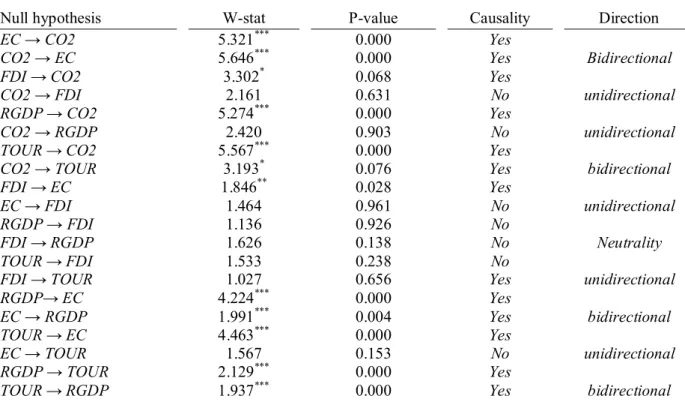
Moreover, the diagnostic test of the above results further affirms the statistical significance of the relationship between the variables. Specifically, the cross-sectional dependence and the serial correlation tests as indicated in the last part of Table 5 are desirable. In addition to the diagnostic test, the robustness evidence through the Granger causality of Dumitrescu and Hurlin (2012) in Table 6 proof to be a valid inference. The result illustrates that there is a bidirectional Granger causality between carbon emissions and energy consumption and between carbon emission carbon emissions and tourism inbound. Whereas, the evidence of Granger causality between carbon emissions and the real gross domestic product, and between carbon emission and foreign direct investment is unidirectional. Illustratively, the Granger causality is observed to be from each of rgdp and fdi to the carbon emissions without feedback.
5. Concluding Remark and Policy Suggestion
Considering that the sources of pollutant emissions vary across locations, regions and countries, the impact of these emission types on environmental sustainability are indicatively dependent on both the emission type and its concentration. Indicatively, the current study considered the 10 most pollutant emissions that constitute an environmental hazard in thirty-seven (37) countries of the world. In doing, the study investigated the nature of the impact of foreign direct investment, energy consumption, real income (measured by the real gdp) and tourism inbound on the carbon emissions in the panel countries. By using the dynamic autoregressive distributed lag (ARDL) techniques for the data span of 1995-2014, it is observed that energy consumption in the panel country is detrimental to environmental quality in both the short and long-run. However, the long-run impact of foreign direct investment, real gross domestic product, and tourism inbound on carbon emissions are observed to be negative. Thus, the result posits that the fdi, rgdp and
tour are the likely desirable factors that could be employed to a more sustainable environment in
the panel countries.
The implication of this investigation has however presented policy dimensions regarding the nexus of environmental sustainability vis-à-vis the trend of carbon emissions in the panel countries and other related cases. Foremost, the evidence of the positive nexus of energy consumption and carbon emissions implies that more energy portfolio diversification, especially among the examined countries is significantly important. The stakeholders in these countries could adopt a more energy-efficient or low-carbon energy and technology approach to economic and environmental sustainability. On the other hand, a rather complementary approach could be
adopted regarding the effect of tourism inbound, foreign direct investment and income on environmental sustainability. Since the current dynamics of rgdp, fdi and tour favours desirable environmental sustainability of the panel countries, the government, environmentalist and other stakeholders should be encouraged to enforce a complementary policy that is targeted at improving the success story in the examined panel countries. Furthermore, the current study can be improved in the future investigation the impact of energy consumption, foreign direct investment, tourism inbound, income among others on each of the categorized or prominent pollutant emissions.
References
Akadiri, S. S., Akadiri, A. C., & Alola, U. V. (2017). Is there growth impact of tourism? Evidence from selected small island states. Current Issue in Tourism. doi:10.1080/13683500.2017.1381947.
Alola, A. A., Yalçiner, K., Alola, U. V., & Saint Akadiri, S. (2019). The role of renewable energy, immigration and real income in environmental sustainability target. Evidence from Europe largest states. Science of The Total Environment, 674, 307-315.
Alola, A. A., & Alola, U. V. (2018). Agricultural land usage and tourism impact on renewable energy consumption among Coastline Mediterranean Countries. Energy & Environment,
29(8), 1438-1454.
Alola, A. A. (2019). Carbon emissions and the trilemma of trade policy, migration policy and health care in the US. Carbon Management, 10(2), 209-218.
Alola, A. A. (2019). Carbon emissions and the trilemma of trade policy, migration policy and health care in the US. Carbon Management, 10(2), 209-218.
Alola, A. A., Bekun, F. V., & Sarkodie, S. A. (2019). Dynamic impact of trade policy, economic growth, fertility rate, renewable and non-renewable energy consumption on ecological footprint in Europe. Science of The Total Environment, 685, 702-709.
Ayres, R. (2000). Tourism as a passport to development in small states: Reflections on Cyprus. International Journal of Social Economics, 27(2), 114–133.
Baltagi, B. H. (2008). Econometric analysis of panel data (3rd ed.). Somerset, NJ: Wiley.
Balaguer, J., & Cantavella-Jorda, M. (2002). Tourism as a long-run economic growth factor: The Spanish case. Applied Economics, 34(7), 877–884.
Bassanini, A., & Scarpetta, S. (2002). Does human capital matter for growth in OECD countries? A pooled mean-group approach. Economics Letters, 74(3), 399–405.
Bekun, F. V., Emir, F., & Sarkodie, S. A. (2019). Another look at the relationship between energy consumption, carbon dioxide emissions, and economic growth in South Africa. Science of The Total Environment, 655, 759-765.
Blackburne, E. F., & Frank, M. W. (2007). Estimation of non-stationary heterogeneous panels. Stata Journal, 7(2), 197.
Dritsakis, N. (2004). Tourism as a long-run economic growth factor: An empirical investigation for Greece using causality analysis. Tourism Economics, 10(3), 305–316. Dumitrescu, E. I., & Hurlin, C. (2012). Testing for Granger non-causality in heterogeneous
panels. Economic Modelling, 29(4), 1450–1460.
Dogan, E., & Aslan, A. (2017). Exploring the relationship among CO2 emissions, real GDP, energy consumption and tourism in the EU and candidate countries: Evidence from panel
models robust to heterogeneity and cross-sectional dependence. Renewable and
Sustainable Energy Reviews, 77, 239-245
Frank, M. W. (2009). Inequality and growth in the United States: Evidence from a new state-level panel of income inequality measures. Economic Inquiry, 47(1), 55–68.
Im, K. S., Pesaran, M. H., & Shin, Y. (2003). Testing for unit roots in heterogeneous panels. Journal of Econometrics, 115(1), 53–74.
Johansen, S. (1991). Estimation and hypothesis testing of cointegration vectors in Gaussian vector autoregressive models. Econometrica: Journal of the Econometric Society, 59(6), 1551–1580.
Kais, S., & Sami, H. (2016). An econometric study of the impact of economic growth and energy use on carbon emissions: panel data evidence from fifty eight countries. Renewable and Sustainable Energy Reviews, 59, 1101-1110.
Khalil, S., Kakar, M. K., & Malik, A. (2007). Role of tourism in economic growth: Empirical evidence from Pakistan economy [with comments]. The Pakistan Development Review, 46(4), 985–995.
Koçak, E., & Şarkgüneşi, A. (2018). The impact of foreign direct investment on CO 2 emissions in Turkey: new evidence from cointegration and bootstrap causality analysis. Environmental Science and Pollution Research, 25(1), 790-804.
Kostakis, I., Lolos, S., & Sardianou, E. (2017). Foreign Direct Investment and Environmental Degradation: Further Evidence from Brazil and Singapore. Journal of Environmental
Lan, J., Kakinaka, M., & Huang, X. (2012). Foreign direct investment, human capital and environmental pollution in China. Environmental and Resource Economics, 51(2), 255-275.
Lee, J. W. (2013). The contribution of foreign direct investment to clean energy use, carbon emissions and economic growth. Energy Policy, 55, 483-489.
Lee, J.W., & Brahmasrene, T. (2013). Investigating the influence of tourism on economic growth and carbon emissions: Evidence from panel analysis of the European Union. Tourism Management, 38, 69–76.
Lee, C. C., & Chang, C. P. (2008b). Energy consumption and economic growth in Asian economies: A more comprehensive analysis using panel data. Resource and Energy Economics, 30(1), 50–65.
Levin, A., Lin, C. F., & Chu, C. S. J. (2002). Unit root tests in panel data: Asymptotic and finite sample properties. Journal of Econometrics, 108(1), 1–24.
Maddala, G. S., & Wu, S. (1999). A comparative study of unit root tests with panel data and a new simple test. Oxford Bulletin of Economics and Statistics, 61(S1), 631–652.
Martı´nez-Zarzoso, I., & Bengochea-Morancho, A. (2004). Pooled mean group estimation of an environmental Kuznets curve for CO2. Economics Letters, 82(1), 121–126.
Narayan, P. K., Narayan, S., Prasad, A., & Prasad, B. C. (2010). Tourism and economic growth: A panel data analysis for Pacific Island countries. Tourism Economics, 16(1), 169–183.
Narayan, P. K., Saboori, B., & Soleymani, A. (2016). Economic growth and carbon emissions. Economic Modelling, 53, 388-397.
Ng, T. H., Lye, C. T., & Lim, Y. S. (2016). A decomposition analysis of CO2 emissions: Evidence from Malaysia’s tourism industry. International Journal of Sustainable Development & World Ecology, 23(3), 266–277.
Omri, A., Euchi, J., Hasaballah, A. H., & Al-Tit, A. (2019). Determinants of environmental sustainability: Evidence from Saudi Arabia. Science of The Total Environment, 657, 1592-1601.
Ozturk, I., & Acaravci, A. (2010). Co2 emissions, energy consumption and economic growth in Turkey. Renewable and Sustainable Energy Reviews, 14(9), 3220–3225.
Paramati, S. R., Sinha, A., & Dogan, E. (2017). The significance of renewable energy use for economic output and environmental protection: evidence from the Next 11 developing economies. Environmental Science and Pollution Research, 24(15), 13546-13560.
Pesaran, M. H., Shin, Y., & Smith, R. P. (1999). Pooled mean group estimation of dynamic heterogeneous panels. Journal of the American Statistical Association, 94(446), 621–634. Pesaran, M. H., & Smith, R. (1995). Estimating long-run relationships from dynamic
heterogeneous panels. Journal of Econometrics, 68(1), 79–113.
Saint Akadiri, S., Lasisi, T. T., Uzuner, G., & Akadiri, A. C. (2019). Examining the impact of globalization in the environmental Kuznets curve hypothesis: the case of tourist destination states. Environmental Science and Pollution Research, 26(12), 12605-12615. Sarkodie, S. A., & Strezov, V. (2019). Effect of foreign direct investments, economic
development and energy consumption on greenhouse gas emissions in developing countries. Science of the Total Environment, 646, 862-871.
Shahbaz, M., Nasreen, S., Abbas, F., & Anis, O. (2015). Does foreign direct investment impede environmental quality in high-, middle-, and low-income countries? Energy
Economics, 51, 275-287.
Sbia, R., Shahbaz, M., & Hamdi, H. (2014). A contribution of foreign direct investment, clean energy, trade openness, carbon emissions and economic growth to energy demand in UAE. Economic modelling, 36, 191-197.
Saint Akadiri, S., Alkawfi, M. M., Uğural, S., & Akadiri, A. C. (2019a). Towards achieving environmental sustainability target in Italy. The role of energy, real income and globalization. Science of The Total Environment, 671, 1293-1301.
Saint Akadiri, S., Bekun, F. V., & Sarkodie, S. A. (2019b). Contemporaneous interaction between energy consumption, economic growth and environmental sustainability in South Africa: What drives what?. Science of The Total Environment.
Salahuddin, M., Alam, K., & Ozturk, I. (2016). The effects of Internet usage and economic growth on CO2 emissions in OECD countries: A panel investigation. Renewable and
Sustainable Energy Reviews, 62, 1226-1235.
Sarkis, J., & Zhu, Q. (2018). Environmental sustainability and production: Taking the road less travelled. International Journal of Production Research, 56(1-2), 743-759.
Sarkodie, S. A., Strezov, V., Weldekidan, H., Asamoah, E. F., Owusu, P. A., & Doyi, I. N. Y. (2019). Environmental sustainability assessment using dynamic Autoregressive-Distributed Lag simulations—Nexus between greenhouse gas emissions, biomass energy, food and economic growth. Science of the Total Environment, 668, 318-332.
Shahbaz, M., Balsalobre-Lorente, D., & Sinha, A. (2019). Foreign direct Investment–CO2 emissions nexus in Middle East and North African countries: Importance of biomass energy consumption. Journal of Cleaner Production, 217, 603-614.
Shahbaz, M., Nasreen, S., Abbas, F., & Anis, O. (2015). Does foreign direct investment impede environmental quality in high-, middle-, and low-income countries? Energy
Economics, 51, 275-287.
Shao, Q., Wang, X., Zhou, Q., & Balogh, L. (2019). Pollution haven hypothesis revisited: A comparison of the BRICS and MINT countries based on VECM approach. Journal of
Cleaner Production, 227, 724-738.
Stucley, C. R., Schuck, S. M., Sims, R. E. H., Larsen, P. L., Turvey, N. D., & Marino, B. E. (2004). Biomass energy production in Australia. Revised Edition. Rural Industries
Research and Development Corporation, Canberra.
Usman, O., Iorember, P. T., & Olanipekun, I. O. (2019). Revisiting the environmental Kuznets curve (EKC) hypothesis in India: the effects of energy consumption and democracy. Environmental Science and Pollution Research, 1-11.
Wang, Z. (2019). Does biomass energy consumption help to control environmental pollution? Evidence from BRICS countries. Science of the Total Environment, 670, 1075-1083. Xing, J. (2012). Tax structure and growth: How robust is the empirical evidence? Economics
(a) (b) China China China China China China China China China China China China China China China China China China China China USA USA USA USA USA USA USA USA USA USA USA USA USA USA USA USA USA USA USA USA India India India India India India India India India India India India India India India India India India India India Russia Russia Russia Russia Russia Russia Russia Russia Russia Russia Russia Russia Russia Russia Russia Russia Russia Russia Russia Russia Japan Japan Japan Japan Japan Japan Japan Japan Japan Japan Japan Japan Japan Japan Japan Japan Japan Japan Japan Japan Brazil Brazil Brazil Brazil Brazil Brazil Brazil Brazil Brazil Brazil Brazil Brazil Brazil Brazil Brazil Brazil Brazil Brazil Brazil
Brazil IndonesiaIndonesiaIndonesiaIndonesiaIndonesiaIndonesiaIndonesiaIndonesiaIndonesiaIndonesiaIndonesiaIndonesiaIndonesiaIndonesiaIndonesiaIndonesiaIndonesiaIndonesiaIndonesiaIndonesia Canada Canada Canada Canada Canada Canada Canada Canada Canada Canada Canada Canada Canada Canada Canada Canada Canada Canada Canada Canada Iran Iran Iran Iran Iran Iran Iran Iran Iran Iran Iran Iran Iran Iran Iran Iran Iran Iran Iran Iran Austria Austria Austria Austria Austria Austria Austria Austria Austria Austria Austria Austria Austria Austria Austria Austria Austria Austria Austria Austria Belgium Belgium Belgium Belgium Belgium Belgium Belgium Belgium Belgium Belgium Belgium Belgium Belgium Belgium Belgium Belgium Belgium Belgium Belgium Belgium Bulgaria Bulgaria Bulgaria Bulgaria Bulgaria Bulgaria Bulgaria Bulgaria Bulgaria Bulgaria Bulgaria Bulgaria Bulgaria Bulgaria Bulgaria Bulgaria Bulgaria Bulgaria Bulgaria Bulgaria Cyprus Cyprus Cyprus Cyprus Cyprus Cyprus Cyprus Cyprus Cyprus Cyprus Cyprus Cyprus Cyprus Cyprus Cyprus Cyprus Cyprus Cyprus Cyprus Cyprus Czech Rep. Czech Rep. Czech Rep. Czech Rep. Czech Rep. Czech Rep. Czech Rep. Czech Rep. Czech Rep. Czech Rep. Czech Rep. Czech Rep. Czech Rep. Czech Rep. Czech Rep. Czech Rep. Czech Rep. Czech Rep. Czech Rep. Czech Rep. Denmark Denmark Denmark Denmark Denmark Denmark Denmark Denmark Denmark Denmark Denmark Denmark Denmark Denmark Denmark Denmark Denmark Denmark Denmark Denmark Estonia Estonia Estonia Estonia Estonia Estonia Estonia Estonia Estonia Estonia Estonia Estonia Estonia Estonia Estonia Estonia Estonia Estonia Estonia Estonia Finland Finland Finland Finland Finland Finland Finland Finland Finland Finland Finland Finland Finland Finland Finland Finland Finland Finland Finland Finland France France France France France France France France France France France France France France France France France France France France Germany Germany Germany Germany Germany Germany Germany Germany Germany Germany Germany Germany Germany Germany Germany Germany Germany Germany Germany Germany Greece Greece Greece Greece Greece Greece Greece Greece Greece Greece Greece Greece Greece Greece Greece Greece Greece Greece Greece Greece Hungary Hungary Hungary Hungary Hungary Hungary Hungary Hungary Hungary Hungary Hungary Hungary Hungary Hungary Hungary Hungary Hungary Hungary Hungary Hungary Ireland Ireland Ireland Ireland Ireland Ireland Ireland Ireland Ireland Ireland Ireland Ireland Ireland Ireland Ireland Ireland Ireland Ireland Ireland Ireland Italy Italy Italy Italy Italy Italy Italy Italy Italy Italy Italy Italy Italy Italy Italy Italy Italy Italy Italy Italy Latvia Latvia Latvia Latvia Latvia Latvia Latvia Latvia Latvia Latvia Latvia Latvia Latvia Latvia Latvia Latvia Latvia Latvia Latvia Latvia Lithuania Lithuania Lithuania Lithuania Lithuania Lithuania Lithuania Lithuania Lithuania Lithuania Lithuania Lithuania Lithuania Lithuania Lithuania Lithuania Lithuania Lithuania Lithuania Lithuania Luxembourg Luxembourg Luxembourg Luxembourg Luxembourg Luxembourg Luxembourg Luxembourg Luxembourg Luxembourg Luxembourg Luxembourg Luxembourg Luxembourg Luxembourg Luxembourg Luxembourg Luxembourg Luxembourg Luxembourg Malta Malta Malta Malta Malta Malta Malta Malta Malta Malta Malta Malta Malta Malta Malta Malta Malta Malta Malta Malta Netherlands Netherlands Netherlands Netherlands Netherlands Netherlands Netherlands Netherlands Netherlands Netherlands Netherlands Netherlands Netherlands Netherlands Netherlands Netherlands Netherlands Netherlands Netherlands Netherlands Poland Poland Poland Poland Poland Poland Poland Poland Poland Poland Poland Poland Poland Poland Poland Poland Poland Poland Poland Poland Portugal Portugal Portugal Portugal Portugal Portugal Portugal Portugal Portugal Portugal Portugal Portugal Portugal Portugal Portugal Portugal Portugal Portugal Portugal Portugal Romania Romania Romania Romania Romania Romania Romania Romania Romania Romania Romania Romania Romania Romania Romania Romania Romania Romania Romania Romania Slovakia Slovakia Slovakia Slovakia Slovakia Slovakia Slovakia Slovakia Slovakia Slovakia Slovakia Slovakia Slovakia Slovakia Slovakia Slovakia Slovakia Slovakia Slovakia Slovakia Slovenia Slovenia Slovenia Slovenia Slovenia Slovenia Slovenia Slovenia Slovenia Slovenia Slovenia Slovenia Slovenia Slovenia Slovenia Slovenia Slovenia Slovenia Slovenia Slovenia Spain Spain Spain Spain Spain Spain Spain Spain Spain Spain Spain Spain Spain Spain Spain Spain Spain Spain Spain Spain Sweden Sweden Sweden Sweden Sweden Sweden Sweden Sweden Sweden Sweden Sweden Sweden Sweden Sweden Sweden Sweden Sweden Sweden Sweden Sweden United Kingdom United Kingdom United Kingdom United Kingdom United Kingdom United Kingdom United Kingdom United Kingdom United Kingdom United Kingdom United Kingdom United Kingdom United Kingdom United Kingdom United Kingdom United Kingdom United Kingdom United Kingdom United Kingdom United Kingdom Croatia Croatia Croatia Croatia Croatia Croatia Croatia Croatia Croatia Croatia Croatia Croatia Croatia Croatia Croatia Croatia Croatia Croatia Croatia Croatia 0 5 1 0 1 5 2 0 a v C O 2
0 2.00e+07 4.00e+07 6.00e+07 8.00e+07
avRGDP
n = 740 RMSE = 4.174564
avCO2 = 8.1472 - 4.9e-08 avRGDP R2 = 2.0%
China China China China China China China China China China China China China China China China China China China China USA USA USA USA USA USA USA USA USA USA USA USA USA USA USA USA USA USA USA USA India India India India India India India India India India India India India India India India India India India India Russia Russia Russia Russia Russia Russia Russia Russia Russia Russia Russia Russia Russia Russia Russia Russia Russia Russia Russia Russia Japan Japan Japan Japan Japan Japan Japan Japan Japan Japan Japan Japan Japan Japan Japan Japan Japan Japan Japan Japan Brazil Brazil Brazil Brazil Brazil Brazil Brazil Brazil Brazil Brazil Brazil Brazil Brazil Brazil Brazil Brazil Brazil Brazil Brazil Brazil Indonesia Indonesia Indonesia Indonesia Indonesia Indonesia Indonesia Indonesia Indonesia Indonesia Indonesia Indonesia Indonesia Indonesia Indonesia Indonesia Indonesia Indonesia Indonesia Indonesia Canada Canada Canada Canada Canada Canada Canada Canada Canada Canada Canada Canada Canada Canada Canada Canada Canada Canada Canada Canada Iran Iran Iran Iran Iran Iran Iran Iran Iran Iran Iran Iran Iran Iran Iran Iran Iran Iran Iran Iran Austria Austria Austria Austria Austria Austria Austria Austria Austria Austria Austria Austria Austria Austria Austria Austria Austria Austria Austria Austria Belgium Belgium Belgium Belgium Belgium Belgium Belgium Belgium Belgium Belgium Belgium Belgium Belgium Belgium Belgium Belgium Belgium Belgium Belgium Belgium Bulgaria Bulgaria Bulgaria Bulgaria Bulgaria Bulgaria Bulgaria Bulgaria Bulgaria Bulgaria Bulgaria Bulgaria Bulgaria Bulgaria Bulgaria Bulgaria Bulgaria Bulgaria Bulgaria Bulgaria Cyprus Cyprus Cyprus Cyprus Cyprus Cyprus Cyprus Cyprus Cyprus Cyprus Cyprus Cyprus Cyprus Cyprus Cyprus Cyprus Cyprus Cyprus Cyprus Cyprus Czech Rep. Czech Rep. Czech Rep. Czech Rep. Czech Rep. Czech Rep. Czech Rep. Czech Rep. Czech Rep. Czech Rep. Czech Rep. Czech Rep. Czech Rep. Czech Rep. Czech Rep. Czech Rep. Czech Rep. Czech Rep. Czech Rep. Czech Rep. Denmark Denmark Denmark Denmark Denmark Denmark Denmark Denmark Denmark Denmark Denmark Denmark Denmark Denmark Denmark Denmark Denmark Denmark Denmark Denmark Estonia Estonia Estonia Estonia Estonia Estonia Estonia Estonia Estonia Estonia Estonia Estonia Estonia Estonia Estonia Estonia Estonia Estonia Estonia Estonia Finland Finland Finland Finland Finland Finland Finland Finland Finland Finland Finland Finland Finland Finland Finland Finland Finland Finland Finland Finland France France France France France France France France France France France France France France France France France France France France Germany Germany Germany Germany Germany Germany Germany Germany Germany Germany Germany Germany Germany Germany Germany Germany Germany Germany Germany Germany Greece Greece Greece Greece Greece Greece Greece Greece Greece Greece Greece Greece Greece Greece Greece Greece Greece Greece Greece Greece Hungary Hungary Hungary Hungary Hungary Hungary Hungary Hungary Hungary Hungary Hungary Hungary Hungary Hungary Hungary Hungary Hungary Hungary Hungary Hungary Ireland Ireland Ireland Ireland Ireland Ireland Ireland Ireland Ireland Ireland Ireland Ireland Ireland Ireland Ireland Ireland Ireland Ireland Ireland Ireland Italy Italy Italy Italy Italy Italy Italy Italy Italy Italy Italy Italy Italy Italy Italy Italy Italy Italy Italy Italy Latvia Latvia Latvia Latvia Latvia Latvia Latvia Latvia Latvia Latvia Latvia Latvia Latvia Latvia Latvia Latvia Latvia Latvia Latvia
LatviaLithuaniaLithuaniaLithuaniaLithuaniaLithuaniaLithuaniaLithuaniaLithuaniaLithuaniaLithuaniaLithuaniaLithuaniaLithuaniaLithuaniaLithuaniaLithuaniaLithuaniaLithuaniaLithuaniaLithuania
Luxembourg Luxembourg Luxembourg Luxembourg Luxembourg Luxembourg Luxembourg Luxembourg Luxembourg Luxembourg Luxembourg Luxembourg Luxembourg Luxembourg Luxembourg Luxembourg Luxembourg Luxembourg Luxembourg Luxembourg Malta Malta Malta Malta Malta Malta Malta Malta Malta Malta Malta Malta Malta Malta Malta Malta Malta Malta Malta Malta Netherlands Netherlands Netherlands Netherlands Netherlands Netherlands Netherlands Netherlands Netherlands Netherlands Netherlands Netherlands Netherlands Netherlands Netherlands Netherlands Netherlands Netherlands Netherlands Netherlands Poland Poland Poland Poland Poland Poland Poland Poland Poland Poland Poland Poland Poland Poland Poland Poland Poland Poland Poland Poland Portugal Portugal Portugal Portugal Portugal Portugal Portugal Portugal Portugal Portugal Portugal Portugal Portugal Portugal Portugal Portugal Portugal Portugal Portugal Portugal Romania Romania Romania Romania Romania Romania Romania Romania Romania Romania Romania Romania Romania Romania Romania Romania Romania Romania Romania Romania Slovakia Slovakia Slovakia Slovakia Slovakia Slovakia Slovakia Slovakia Slovakia Slovakia Slovakia Slovakia Slovakia Slovakia Slovakia Slovakia Slovakia Slovakia Slovakia SlovakiaSloveniaSloveniaSloveniaSloveniaSloveniaSloveniaSloveniaSloveniaSloveniaSloveniaSloveniaSloveniaSloveniaSloveniaSloveniaSloveniaSloveniaSloveniaSloveniaSlovenia Spain Spain Spain Spain Spain Spain Spain Spain Spain Spain Spain Spain Spain Spain Spain Spain Spain Spain Spain Spain Sweden Sweden Sweden Sweden Sweden Sweden Sweden Sweden Sweden Sweden Sweden Sweden Sweden Sweden Sweden Sweden Sweden Sweden Sweden Sweden United Kingdom United Kingdom United Kingdom United Kingdom United Kingdom United Kingdom United Kingdom United Kingdom United Kingdom United Kingdom United Kingdom United Kingdom United Kingdom United Kingdom United Kingdom United Kingdom United Kingdom United Kingdom United Kingdom United Kingdom Croatia Croatia Croatia Croatia Croatia Croatia Croatia Croatia Croatia Croatia Croatia Croatia Croatia Croatia Croatia Croatia Croatia Croatia Croatia Croatia 0 5 1 0 1 5 2 0 a v C O 2 0 2000 4000 6000 8000 avEC n = 740 RMSE = 1.920527 avCO2 = .96464 + .00204 avEC R2 = 79.2%
(c)
(d)
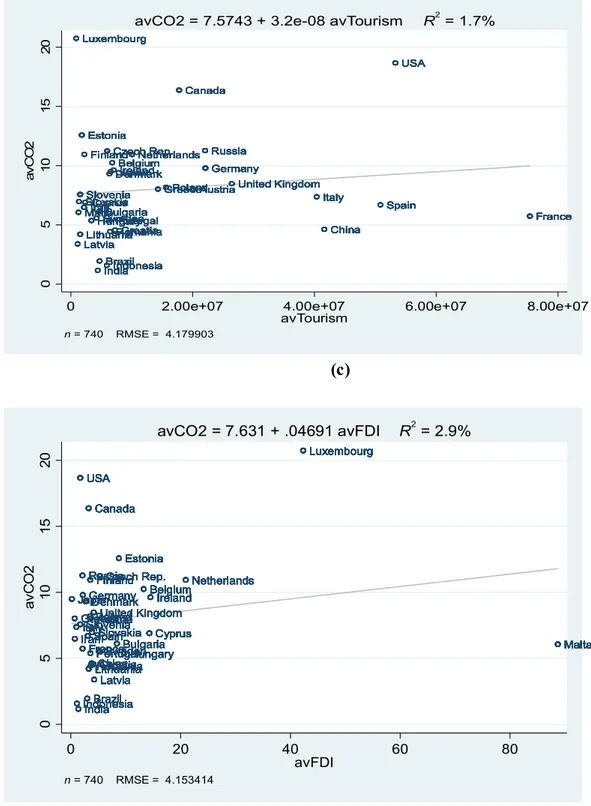
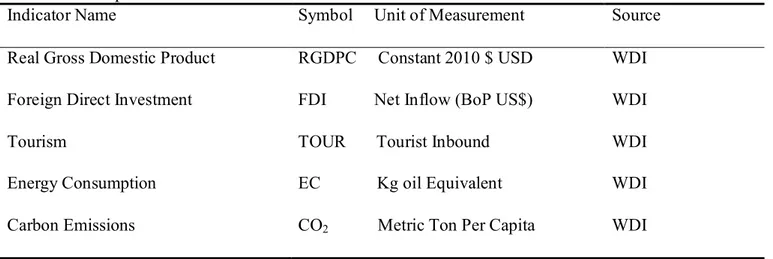
Figure 1: The visual evidence showing the relationship between carbon dioxide (CO2) and RGDP (a: real gross domestic product), EC (b: energy consumption), Tourism (c), and the FDI (a: Foreign direct investment) for each of the panel countries.
China China China China China China China China China China China China China China China China China China China China USA USA USA USA USA USA USA USA USA USA USA USA USA USA USA USA USA USA USA USA India India India India India India India India India India India India India India India India India India India India Russia Russia Russia Russia Russia Russia Russia Russia Russia Russia Russia Russia Russia Russia Russia Russia Russia Russia Russia Russia Japan Japan Japan Japan Japan Japan Japan Japan Japan Japan Japan Japan Japan Japan Japan Japan Japan Japan Japan Japan Brazil Brazil Brazil Brazil Brazil Brazil Brazil Brazil Brazil Brazil Brazil Brazil Brazil Brazil Brazil Brazil Brazil Brazil Brazil BrazilIndonesiaIndonesiaIndonesiaIndonesiaIndonesiaIndonesiaIndonesiaIndonesiaIndonesiaIndonesiaIndonesiaIndonesiaIndonesiaIndonesiaIndonesiaIndonesiaIndonesiaIndonesiaIndonesiaIndonesia
Canada Canada Canada Canada Canada Canada Canada Canada Canada Canada Canada Canada Canada Canada Canada Canada Canada Canada Canada Canada Iran Iran Iran Iran Iran Iran Iran Iran Iran Iran Iran Iran Iran Iran Iran Iran Iran Iran Iran Iran Austria Austria Austria Austria Austria Austria Austria Austria Austria Austria Austria Austria Austria Austria Austria Austria Austria Austria Austria Austria Belgium Belgium Belgium Belgium Belgium Belgium Belgium Belgium Belgium Belgium Belgium Belgium Belgium Belgium Belgium Belgium Belgium Belgium Belgium Belgium Bulgaria Bulgaria Bulgaria Bulgaria Bulgaria Bulgaria Bulgaria Bulgaria Bulgaria Bulgaria Bulgaria Bulgaria Bulgaria Bulgaria Bulgaria Bulgaria Bulgaria Bulgaria Bulgaria Bulgaria Cyprus Cyprus Cyprus Cyprus Cyprus Cyprus Cyprus Cyprus Cyprus Cyprus Cyprus Cyprus Cyprus Cyprus Cyprus Cyprus Cyprus Cyprus Cyprus Cyprus Czech Rep. Czech Rep. Czech Rep. Czech Rep. Czech Rep. Czech Rep. Czech Rep. Czech Rep. Czech Rep. Czech Rep. Czech Rep. Czech Rep. Czech Rep. Czech Rep. Czech Rep. Czech Rep. Czech Rep. Czech Rep. Czech Rep. Czech Rep. Denmark Denmark Denmark Denmark Denmark Denmark Denmark Denmark Denmark Denmark Denmark Denmark Denmark Denmark Denmark Denmark Denmark Denmark Denmark Denmark Estonia Estonia Estonia Estonia Estonia Estonia Estonia Estonia Estonia Estonia Estonia Estonia Estonia Estonia Estonia Estonia Estonia Estonia Estonia Estonia Finland Finland Finland Finland Finland Finland Finland Finland Finland Finland Finland Finland Finland Finland Finland Finland Finland Finland Finland Finland France France France France France France France France France France France France France France France France France France France France Germany Germany Germany Germany Germany Germany Germany Germany Germany Germany Germany Germany Germany Germany Germany Germany Germany Germany Germany Germany Greece Greece Greece Greece Greece Greece Greece Greece Greece Greece Greece Greece Greece Greece Greece Greece Greece Greece Greece Greece Hungary Hungary Hungary Hungary Hungary Hungary Hungary Hungary Hungary Hungary Hungary Hungary Hungary Hungary Hungary Hungary Hungary Hungary Hungary Hungary Ireland Ireland Ireland Ireland Ireland Ireland Ireland Ireland Ireland Ireland Ireland Ireland Ireland Ireland Ireland Ireland Ireland Ireland Ireland Ireland Italy Italy Italy Italy Italy Italy Italy Italy Italy Italy Italy Italy Italy Italy Italy Italy Italy Italy Italy Italy Latvia Latvia Latvia Latvia Latvia Latvia Latvia Latvia Latvia Latvia Latvia Latvia Latvia Latvia Latvia Latvia Latvia Latvia Latvia Latvia Lithuania Lithuania Lithuania Lithuania Lithuania Lithuania Lithuania Lithuania Lithuania Lithuania Lithuania Lithuania Lithuania Lithuania Lithuania Lithuania Lithuania Lithuania Lithuania Lithuania Luxembourg Luxembourg Luxembourg Luxembourg Luxembourg Luxembourg Luxembourg Luxembourg Luxembourg Luxembourg Luxembourg Luxembourg Luxembourg Luxembourg Luxembourg Luxembourg Luxembourg Luxembourg Luxembourg Luxembourg Malta Malta Malta Malta Malta Malta Malta Malta Malta Malta Malta Malta Malta Malta Malta Malta Malta Malta Malta Malta Netherlands Netherlands Netherlands Netherlands Netherlands Netherlands Netherlands Netherlands Netherlands Netherlands Netherlands Netherlands Netherlands Netherlands Netherlands Netherlands Netherlands Netherlands Netherlands Netherlands Poland Poland Poland Poland Poland Poland Poland Poland Poland Poland Poland Poland Poland Poland Poland Poland Poland Poland Poland Poland Portugal Portugal Portugal Portugal Portugal Portugal Portugal Portugal Portugal Portugal Portugal Portugal Portugal Portugal Portugal Portugal Portugal Portugal Portugal Portugal Romania Romania Romania Romania Romania Romania Romania Romania Romania Romania Romania Romania Romania Romania Romania Romania Romania Romania Romania Romania Slovakia Slovakia Slovakia Slovakia Slovakia Slovakia Slovakia Slovakia Slovakia Slovakia Slovakia Slovakia Slovakia Slovakia Slovakia Slovakia Slovakia Slovakia Slovakia
SlovakiaSloveniaSloveniaSloveniaSloveniaSloveniaSloveniaSloveniaSloveniaSloveniaSloveniaSloveniaSloveniaSloveniaSloveniaSloveniaSloveniaSloveniaSloveniaSloveniaSlovenia SpainSpainSpainSpainSpainSpainSpainSpainSpainSpainSpainSpainSpainSpainSpainSpainSpainSpainSpainSpain Sweden Sweden Sweden Sweden Sweden Sweden Sweden Sweden Sweden Sweden Sweden Sweden Sweden Sweden Sweden Sweden Sweden Sweden Sweden Sweden United Kingdom United Kingdom United Kingdom United Kingdom United Kingdom United Kingdom United Kingdom United Kingdom United Kingdom United Kingdom United Kingdom United Kingdom United Kingdom United Kingdom United Kingdom United Kingdom United Kingdom United Kingdom United Kingdom United Kingdom Croatia Croatia Croatia Croatia Croatia Croatia Croatia Croatia Croatia Croatia Croatia Croatia Croatia Croatia Croatia Croatia Croatia Croatia Croatia Croatia 0 5 1 0 1 5 2 0 a v C O 2
0 2.00e+07 4.00e+07 6.00e+07 8.00e+07
avTourism n = 740 RMSE = 4.179903
avCO2 = 7.5743 + 3.2e-08 avTourism R2 = 1.7%
China China China China China China China China China China China China China China China China China China China China USA USA USA USA USA USA USA USA USA USA USA USA USA USA USA USA USA USA USA USA India India India India India India India India India India India India India India India India India India India India Russia Russia Russia Russia Russia Russia Russia Russia Russia Russia Russia Russia Russia Russia Russia Russia Russia Russia Russia Russia Japan Japan Japan Japan Japan Japan Japan Japan Japan Japan Japan Japan Japan Japan Japan Japan Japan Japan Japan Japan Brazil Brazil Brazil Brazil Brazil Brazil Brazil Brazil Brazil Brazil Brazil Brazil Brazil Brazil Brazil Brazil Brazil Brazil Brazil Brazil Indonesia Indonesia Indonesia Indonesia Indonesia Indonesia Indonesia Indonesia Indonesia Indonesia Indonesia Indonesia Indonesia Indonesia Indonesia Indonesia Indonesia Indonesia Indonesia Indonesia Canada Canada Canada Canada Canada Canada Canada Canada Canada Canada Canada Canada Canada Canada Canada Canada Canada Canada Canada Canada Iran Iran Iran Iran Iran Iran Iran Iran Iran Iran Iran Iran Iran Iran Iran Iran Iran Iran Iran Iran Austria Austria Austria Austria Austria Austria Austria Austria Austria Austria Austria Austria Austria Austria Austria Austria Austria Austria Austria Austria Belgium Belgium Belgium Belgium Belgium Belgium Belgium Belgium Belgium Belgium Belgium Belgium Belgium Belgium Belgium Belgium Belgium Belgium Belgium Belgium Bulgaria Bulgaria Bulgaria Bulgaria Bulgaria Bulgaria Bulgaria Bulgaria Bulgaria Bulgaria Bulgaria Bulgaria Bulgaria Bulgaria Bulgaria Bulgaria Bulgaria Bulgaria Bulgaria Bulgaria Cyprus Cyprus Cyprus Cyprus Cyprus Cyprus Cyprus Cyprus Cyprus Cyprus Cyprus Cyprus Cyprus Cyprus Cyprus Cyprus Cyprus Cyprus Cyprus Cyprus Czech Rep. Czech Rep. Czech Rep. Czech Rep. Czech Rep. Czech Rep. Czech Rep. Czech Rep. Czech Rep. Czech Rep. Czech Rep. Czech Rep. Czech Rep. Czech Rep. Czech Rep. Czech Rep. Czech Rep. Czech Rep. Czech Rep. Czech Rep. Denmark Denmark Denmark Denmark Denmark Denmark Denmark Denmark Denmark Denmark Denmark Denmark Denmark Denmark Denmark Denmark Denmark Denmark Denmark Denmark Estonia Estonia Estonia Estonia Estonia Estonia Estonia Estonia Estonia Estonia Estonia Estonia Estonia Estonia Estonia Estonia Estonia Estonia Estonia Estonia Finland Finland Finland Finland Finland Finland Finland Finland Finland Finland Finland Finland Finland Finland Finland Finland Finland Finland Finland Finland France France France France France France France France France France France France France France France France France France France France Germany Germany Germany Germany Germany Germany Germany Germany Germany Germany Germany Germany Germany Germany Germany Germany Germany Germany Germany Germany Greece Greece Greece Greece Greece Greece Greece Greece Greece Greece Greece Greece Greece Greece Greece Greece Greece Greece Greece Greece Hungary Hungary Hungary Hungary Hungary Hungary Hungary Hungary Hungary Hungary Hungary Hungary Hungary Hungary Hungary Hungary Hungary Hungary Hungary Hungary Ireland Ireland Ireland Ireland Ireland Ireland Ireland Ireland Ireland Ireland Ireland Ireland Ireland Ireland Ireland Ireland Ireland Ireland Ireland Ireland Italy Italy Italy Italy Italy Italy Italy Italy Italy Italy Italy Italy Italy Italy Italy Italy Italy Italy Italy Italy Latvia Latvia Latvia Latvia Latvia Latvia Latvia Latvia Latvia Latvia Latvia Latvia Latvia Latvia Latvia Latvia Latvia Latvia Latvia Latvia Lithuania Lithuania Lithuania Lithuania Lithuania Lithuania Lithuania Lithuania Lithuania Lithuania Lithuania Lithuania Lithuania Lithuania Lithuania Lithuania Lithuania Lithuania Lithuania Lithuania Luxembourg Luxembourg Luxembourg Luxembourg Luxembourg Luxembourg Luxembourg Luxembourg Luxembourg Luxembourg Luxembourg Luxembourg Luxembourg Luxembourg Luxembourg Luxembourg Luxembourg Luxembourg Luxembourg Luxembourg Malta Malta Malta Malta Malta Malta Malta Malta Malta Malta Malta Malta Malta Malta Malta Malta Malta Malta Malta Malta Netherlands Netherlands Netherlands Netherlands Netherlands Netherlands Netherlands Netherlands Netherlands Netherlands Netherlands Netherlands Netherlands Netherlands Netherlands Netherlands Netherlands Netherlands Netherlands Netherlands Poland Poland Poland Poland Poland Poland Poland Poland Poland Poland Poland Poland Poland Poland Poland Poland Poland Poland Poland Poland Portugal Portugal Portugal Portugal Portugal Portugal Portugal Portugal Portugal Portugal Portugal Portugal Portugal Portugal Portugal Portugal Portugal Portugal Portugal Portugal Romania Romania Romania Romania Romania Romania Romania Romania Romania Romania Romania Romania Romania Romania Romania Romania Romania Romania Romania Romania Slovakia Slovakia Slovakia Slovakia Slovakia Slovakia Slovakia Slovakia Slovakia Slovakia Slovakia Slovakia Slovakia Slovakia Slovakia Slovakia Slovakia Slovakia Slovakia Slovakia Slovenia Slovenia Slovenia Slovenia Slovenia Slovenia Slovenia Slovenia Slovenia Slovenia Slovenia Slovenia Slovenia Slovenia Slovenia Slovenia Slovenia Slovenia Slovenia Slovenia Spain Spain Spain Spain Spain Spain Spain Spain Spain Spain Spain Spain Spain Spain Spain Spain Spain Spain Spain Spain Sweden Sweden Sweden Sweden Sweden Sweden Sweden Sweden Sweden Sweden Sweden Sweden Sweden Sweden Sweden Sweden Sweden Sweden Sweden Sweden United Kingdom United Kingdom United Kingdom United Kingdom United Kingdom United Kingdom United Kingdom United Kingdom United Kingdom United Kingdom United Kingdom United Kingdom United Kingdom United Kingdom United Kingdom United Kingdom United Kingdom United Kingdom United Kingdom United Kingdom Croatia Croatia Croatia Croatia Croatia Croatia Croatia Croatia Croatia Croatia Croatia Croatia Croatia Croatia Croatia Croatia Croatia Croatia Croatia Croatia 0 5 1 0 1 5 2 0 a v C O 2 0 20 40 60 80 avFDI n = 740 RMSE = 4.153414 avCO2 = 7.631 + .04691 avFDI R2 = 2.9%
Table 1: Description and Data Source
Note: WDI represents world development indicators.
Table 2: Pearson Correlation Correlation Results
Regressors LNCO2 LNEC LNRGDP LNFDI LNTOURI
LNCO2 1.000 t-Statistic --- Probability --- LNEC 0.910*** 1.000 t-Statistic 57.776 --- Probability 0.000 --- LNRGDP -0.024 -0.022 1.000 t-Statistic -0.636 -0.589 --- Probability 0.524 0.556 --- LNFDI 0.120*** 0.105*** -0.284*** 1.000 t-Statistic 3.187 2.779 -7.807 --- Probability 0.001 0.005 0.000 --- LNTOUR 0.187*** 0.176*** -0.020 -0.164*** 1.000 t-Statistic 5.020 4.714 -0.538 -4.378 --- Probability 0.000 0.000 0.590 0.000 ---
Note: Variables are stationary at *** 0.01 and ** 0.05 significance levels. For definition of variables, refer to section 3.
Indicator Name Symbol Unit of Measurement Source
Real Gross Domestic Product RGDPC Constant 2010 $ USD WDI
Foreign Direct Investment FDI Net Inflow (BoP US$) WDI
Tourism TOUR Tourist Inbound WDI
Energy Consumption EC Kg oil Equivalent WDI
Table 3: Panel unit root tests results
Variable LLC IPS Fisher-ADF
Level lnCO2 2.399 5.118 38.950 lnEC 1.750 3.756 47.296 lnRGDP -3.581*** -0.955 84.494 lnTOUR -2.213** 2.548 76.996 lnFDI -9.698*** -9.352 226.754*** First difference lnCO2 -18.485*** -17.068*** 408.054*** lnEC -18.778*** -16.998*** 416.378*** lnRGDP -15.298*** -4.385*** 302.991*** lnTOUR -16.457*** -15.501*** 357.585*** lnFDI -21.656*** -19.375*** 448.089***
Note: Variables are stationary at *** 0.01 and ** 0.05 significance levels. For definition of variables, refer to section 3.
Table 4: Fisher-type Johansen Panel Cointegration test
Regression Model CO2 = ƒ(EC, RGDP, TOUR, FDI)
Number of Cointegrating Equations Trace test Maximum-eigenvalue test
None 781.3*** 542.6***
At most 1 513.0*** 340.0***
At most 2 270.7*** 206.6***
At most 3 131.2*** 113.9***
At most 4 92.72*** 92.72***
Note: The p-value for rejecting the null hypothesis of no cointegration is at *** 0.01 significant level Mackinnon et al. (1999).