1
Renewable energy consumption in Coastline Mediterranean
Countries: Impact of environmnental degradation and housing
policy.
Andrew Adewale Alola
1, 2Faculty of Economics, Administrative and Administrative and Social Sciences, Istanbul Gelisim University, Istanbul, Turkey.
Email: [email protected]
Uju Violet Alola
Faculty of Economics, Administrative and Administrative and Social Sciences, Istanbul Gelisim University, Istanbul, Turkey.
Email: [email protected]
Seyi Saint Akadiri
Faculty of Business and Economics, Department of Economics, Famagusta, Eastern Mediterranean University, North Cyprus, via Mersin 10, Turkey.
Email: [email protected]
Acknowledgement: Author’s gratitude is extended to the editor and anonymous reviewers that will/have spared his/her time to guide toward a successful publication.
Funding: I hereby declare that there is no form of funding received for this study.
Compliance with Ethical Standards: The author wishes to disclose here that there are no potential conflicts of interest at any level of this study
Abstract
The significance of the natural geographical characteristics and ecological formation of the Coastline Mediterranean Countries (CMC) suggest a further examination of the dynamics of the renewable energy
1
Faculty of Economics, Administrative and Administrative and Social Sciences, Istanbul Gelisim University, Istanbul, Turkey.
*Corresponding author email: [email protected]
2 Aviola Consult Ltd, Nigeria.
2
consumption (renewables) within the aforesaid region. As such, the dynamic impact of carbon emissions and the housing construction policy vis-à-vis dwellings, building and residential developments on the renewable energy consumption is investigated among Spain, France, Slovenia, Greece, Turkey, Lebanon and Israel. The Dynamic Autoregressive Distributed Lag methods of Pooled Mean Group, Mean Group and Dynamic Fixed Effects estimators is adopted for the empirical investigation over the periods 1999-2014 with real income and tourism employed as an additional variable. Using the PMG estimators, empirical results show that positive and statistically significant relationship exist among the variables in the long-run. A 1% increase in housing construction policy, real income tourism, and carbon emissions lead to (0.955), (8.622), (0.007) and (6.805) increase in renewable energy growth, while deviations in the short-run significantly adjust to long-run equilibrium under an unforeseen disturbance at a moderate annual speed of about 73% annually. The inference from the short-run estimated coefficients indicates that housing construction policy is not a driver of renewables in Israel. From a policy standpoint, proposed strategic housing development policy and environmental pollution mitigation policy by policymakers should be void of causing a disservice toward the enrichment of renewable energy generation domestically in the panel countries.
Keywords: Renewable energy; environmental degradation; carbon emission; housing construction policy;
Coastline Mediterranean Countries
1. Introduction
The United State Energy Information Administration (EIA) mentioned that renewable energy (RE) is the energy type that regenerates, unlike the fossil fuels that are finite (EIA, 2018). The RES are equally considered as clean sources and technologies (Alola, 2019; Alola et al., 2019).It corroborates that the five types of renewable energy includes biomass (biodiesel, ethanol, landfill gas, solid waste gas and wood waste), hydropower, geothermal, wind and solar.2 Series of climate change and global warming resolutions aiming at tuning down carbon emissions and promoting an alternate energy sources usage, among is the Fifth Assessment Report (AR5) of the United Nation’s Intergovernmental Panel on Climate Change (IPCC) and the Paris agreement of
2
The U.S. Energy Information Administration (EIA) provides an independent statistics and analysis of the energy sector in the United State of America. Information regarding the sources of energy, their outlook and projections of
3
20153. These independent agencies have all constituted driving mechanism for renewable energy usage. Also, since an opportunity is been presented of the dire need to meeting the staggering energy demand projection of 25 per cent by 2040, then an expansion in the renewable energy sector is expected (ExxonMobil-Outlook for Energy, 2017). Yet, it is reported that renewable energy constitutes a relatively small proportion of the total energy mix across countries worldwide (Sadorsky, 2009a, b; Rafindadi & Ozturk, 2017; Zhang et al., 2017). Even before the late 2015 Paris meeting, renewable energy is reported in 2014 to have provided an estimated 19.2 per cent (REN21 2016 page 17) final energy consumption which continued in growth and capacity in 2015. By the same year 2015, an estimated 147 gigawatts (GW), the largest annual increase ever of renewable power capacity is reported to have been added amidst the crashing in the global prices of all fossil fuels (REN21 2016 page 17). Despite these challenges, and the relatively high cost of the renewable energy (Zhang et al., 2017; Kardooni, Yusoff, Kari & Moeenizadeh, 2018), global investment is observed to have subsequently increased, economic and private investor activities across sectors also increased, while employment in renewable energy sector increased to 9.4 million jobs (including large-scale hydropower, direct and indirect jobs) within the same year 2015 (REN21 2016 page 17).
The aforementioned economic impacts contribute to the importance of continued research on renewable energy. In that direction, new evidence opined the advantage(s) of the technological approach of conversion and utilization of CO2 emissions in developing renewable energy source
(Rahman et al., 2017). And, in considering efficient energy consumption, stakeholders and governments tend to consider the specificity of energy performance in the construction and allocation of buildings (Rouleau, Gosselin & Blanchet, 2018; Zhang, Kang & Jin, 2018). This, obviously is not without employing strategy at sustaining equitable access to green spaces which is primary to renewable energy generation.
As such, the goal of this study is built on the specifics of renewable energy consumption among the Coastline Mediterranean Countries (CMCs) in relation to the region’s carbon emissions and the housing construction policy vis-à-vis allocation for dwellings and built housing structures
3 A conference organized by the United Nations Framework Convention on Climate Change (UNFCCC) between 30
November and 12 December 2015 culminates into the Paris climate agreement or Paris climate accord. The legal protocol which was finalized in 2014 was officially activated and became effective on 4 November 2016 and had 195 UNFCCC members signatory to it. https://ec.europa.eu/clima/policies/international/negotiations/paris_en.
4
amidst uncertainty. Advancing the study of Alola & Alola (2018a), the ‘Food-energy-environment trilemma’ conceptual study of Wang, Lim & Ouyang (2017) and Alola & Alola (2019), our study further examine the sustainability of the RES consumption in regard to a region’s environmental uniqueness. This study presents an empirical model that examines the linkages between carbon emissions, tourism, real income and the housing policy amidst uncertainty factors over the period 1999-2015. In view of this, our investigation is designed to reveal:
The potential of the housing allocation policy in predicting the region’s renewable energy consumption (REC) in both the short and long-run term.
A joint impact of the housing policy, tourism, real income and carbon emissions in relation to REC.
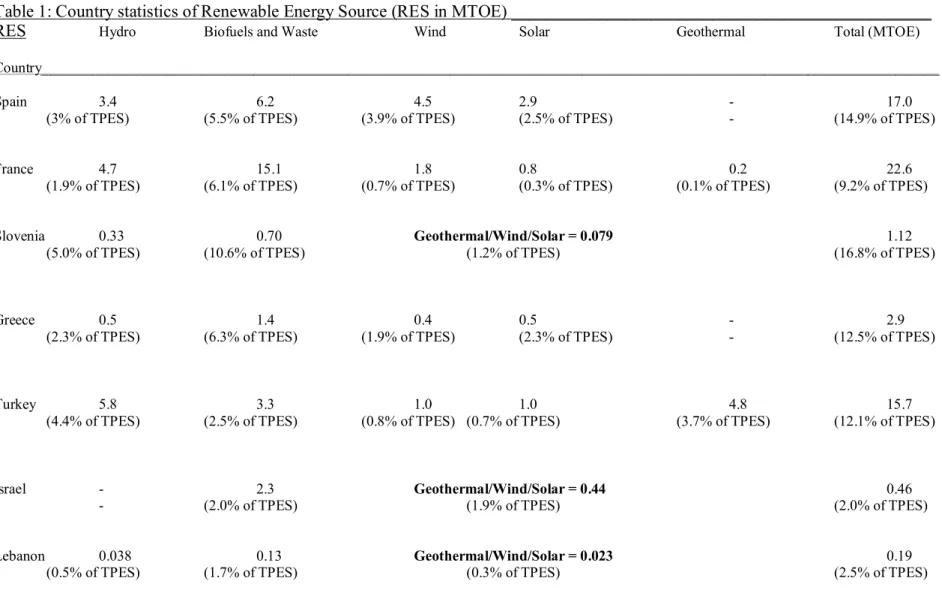
Moreover, the study is aimed at achieving a novel contribution to the extant studies. Firstly, it is novel because it proposed an insight into the sustainability of country’s housing construction policy (the allocation of dwellings, buildings and residential constructions in relation to the energy consumption. The CMCs region is constraint with land availability (Alola & Alola 2018) amidst the dynamics in population of the settlers as also caused by housing allocation policies (Change, 2018). On a second note, the uniqueness of the CMCs region as they share borders with several Middle East (considering the volatility nature and the heavy fossil fuel deposits in the Middle East) is also a motivating perspective of this study. The essence is to further reveal the source of the region’s (or country-by-country) source of renewable energy, i.e. imported or domesticated RES. In doing so, the current investigation provides a reliable information and explanation to the country-wide RES information presented in Table 1.
5
Table 1: Country statistics of Renewable Energy Source (RES in MTOE) ________________________________________________
RES Hydro Biofuels and Waste Wind Solar Geothermal Total (MTOE)
Country___________________________________________________________________________________________________________________________
Spain 3.4 6.2 4.5 2.9 - 17.0
(3% of TPES) (5.5% of TPES) (3.9% of TPES) (2.5% of TPES) - (14.9% of TPES)
France 4.7 15.1 1.8 0.8 0.2 22.6
(1.9% of TPES) (6.1% of TPES) (0.7% of TPES) (0.3% of TPES) (0.1% of TPES) (9.2% of TPES)
Slovenia 0.33 0.70 Geothermal/Wind/Solar = 0.079 1.12
(5.0% of TPES) (10.6% of TPES) (1.2% of TPES) (16.8% of TPES)
Greece 0.5 1.4 0.4 0.5 - 2.9
(2.3% of TPES) (6.3% of TPES) (1.9% of TPES) (2.3% of TPES) - (12.5% of TPES)
Turkey 5.8 3.3 1.0 1.0 4.8 15.7
(4.4% of TPES) (2.5% of TPES) (0.8% of TPES) (0.7% of TPES) (3.7% of TPES) (12.1% of TPES)
Israel - 2.3 Geothermal/Wind/Solar = 0.44 0.46
- (2.0% of TPES) (1.9% of TPES) (2.0% of TPES)
Lebanon 0.038 0.13 Geothermal/Wind/Solar = 0.023 0.19
(0.5% of TPES) (1.7% of TPES) (0.3% of TPES) (2.5% of TPES)
_________________________________________________________________________________________________________________________________ Note: MTOE is Million tonnes of oil equivalent and TPES is Total Primary of Energy Supply excluding electricity trade.
6
The remainder of this study paper is organized as follows. Section two gives a background of renewable energy. The third section describes the data and empirical approaches employed while the succeeding (fourth) section discussed the results. The policy implications of the research are discussed in section 5 the concluding remarks and the highlights for further study.
2. Literature Review
Unlike the drivers of non-renewable energy types (coal, oil, e.t.c.) which have been studied over a period of time (Nyasha, Gwenhure & Odhiambo, 2016; Niu, Chang, Yang, & Wang, 2017; Martinho, 2018; Zhi-Guo, Cheng & Dong-Ming, 2018), the study of renewable energy consumption is quite a relatively new research endeavor. Obviously, the faster development of the renewable energy cannot be easily separated from the association between energy demand and economic growth and other salient determinants as expressed in extant literature. Earlier, in the study of Apergis and Payne (2010 a), the relationship between REC and economic growth for a panel of twenty Organization for Economic Cooperation and Development (OECD) countries was examined for the period of 1985 to 2005. The study captures all the panel of countries but one (they are all OECD countries except Lebanon) of the current study. In the multivariate framework, the cointegration and error correction model adopted for the investigation establishes a positive long-run equilibrium between the REC, the labour force, real GDP, and real gross fixed capital formation. Also, the study indicates a bidirectional Granger-causality between REC and economic growth in the short and long-run observations. Also, in 11 South American countries, Apergis and Payne (2015) revealed that Gross Domestic Product per capita grow along with renewable energy consumption per capita over the period 1980-2010. Again, Sadorsky (2009b) examined the behaviour of REC and income among selected panel of emerging economies. In the investigation, a significantly positive relationship between real per capita income and per capita renewable energy consumption with a unit percentage change in real per capita income causing a 3.5% impact. Also, specifically for Lebanon which is neither OECD nor European country, Houri (2006) and Kinab and Elkhoury (2012) are among other significant contributions to the investigation of renewable energy consumption in Lebanon.
But the continued development and use of the renewable energy source, conceivably because of rising oil prices and climate change debacle has also geared nations toward attaining energy security. As such, in attaining energy security, research emphasis has continued to be built on
7
efforts at identifying the major determinants of the dynamics of an alternative energy sources. In a recent study of renewable energy in the European Union (EU), Duscha and Del Río (2017) examined the interactions between electricity generations from renewable energy source (RES-E), climate and energy policies. Adopting a qualitative method that uses effectiveness and efficiency of RES-E support as assessment criteria, the study (Duscha & del Río, 2017) examined the performances of the Energy Taxation Directive, EU emissions trading system (EU ETS) and the effort sharing directive in the European Union. Over a decade ago, especially in many oil-dependent countries, the coal, oil and natural gas which are major component of fossil fuel were reported to account for 80% of world energy demand (Sadorsky, 2009a). Furthermore, in a recent study, Wang, Wang, Wei & Li (2018) investigate the determinants of China’s renewable energy. The study specifically investigates supply mix, energy security and carbon emissions and as well forecast the relative requirement for the year 2020 and 2030. In their result, energy security is significantly observed to show contribution to renewable energy development (also with new and total renewable energy consumption) and such relationship is observed to be closer compared to other factors. Similarly, and in regard to China, Chen (2018) observed that economic growth, CO2 emissions, foreign trade and urbanization have
heterogeneous effect on renewable energy consumption across the country’s provinces. Additionally, on the evidence of dynamics of renewable energy growth, Aguirre and Ibikunle (2014) summarily opined that significant failures in some energy policies design are common factors in the examined countries. The study identifies uncertainty and likelihood of discontinuity as factors causing failure in institutional frameworks and policies, thus impede renewable energy investments and growth.
2.1 Carbon Emission and REC: An Environmental Insight
According to Stern (2008), the economic impact of global warming and greenhouse emission could respectively reduce global GDP by about 25% and 1%. The countries of the coastline Mediterranean region are obviously not exempted from the global environmental concern. Also, the region’s environmental challenge resulting from its environmental activities is a concern especially to the development of the RES. For instance, Carbon dioxide (CO2) emissions has
been linked to the development in agriculture mechanization and agro-industry (Martinez-Mate et al., 2018; Xu & Lin, 2017 & 2018). Importantly, and for Spain, Martinez-Mate et al. (2018)
8
maintained that renewable energy is capable of mitigating Greenhouse gas (GHG) by 9 per cent in the lettuce production system. And, from wider perspectives, recent studies have continued to show the usefulness of carbon dioxide emissions in the development of renewable energy source for sustainable future. For instance, while acknowledging that CO2 emissions account for about
77% of greenhouse gases (GHGs) emissions, Rahman et al (2017) revealed the potential of incorporating CO2 as a feedstock in a carbon capture sequestration (CCS) technology in
developing renewable energy source. The study attributes the conversion of CO2 to biofuels as
presented in the investigation as a best practice that provides a solution to pollution. Similar studies have linked renewable energy to carbon emissions by using the concept of carbon capture technology (Arnette, 2017; Koytsoumpa, Bergins & Kakaras, 2017). Importantly, Koytsoumpa, Bergins and Kakaras (2017) assessed the potential of Carbon Capture and Utilization (CCU) in the framework of developing renewable energy source from CO2 emissions.
2.2 Housing Development and REC: A Socio-Economic Linkage
Evidence from the global financial crisis of 2008 indicate that the housing or real estate sector is an important segment of most economies of the world (Norris & Byrne, 2018). The fact is that the sector important to the government, non-government agencies, investors, financial institutions, consumers and other stakeholders. The trend of urbanization, implementation of notable reforms in the sector, strategic spatial plans are among factors that account for housing development (Oliveira & Hersperger, 2018). However, the scarcity of land resources, economic constraints, and the danger of potential environmental degradation are some of the key concern associated with the housing construction and allocation. For instance, in Sweden importance is associated with the landownership in the country’s municipalities which in turn influence the housing allocation policy (Caesar & Kopsch, 2018). Similarly, China introduced a well-managed economic system with limited allocated welfare housing that models a commercial housing market since 1998 (Wu, 2015; Alola & Alola, 2018b; Shen, et al., 2018). Beyond indirectly influencing the housing allocation, inadequate proactive planning and improper allocation of land resources are responsible for lack of equitable access to green spaces which is primary to renewable energy generation (Arshad & Routray, 2018). Using ten residential sites in Sheikhupura city of Pakistan, Arshad and Routray (2018) examined that the country’s housing schemes proffers an equitable access to green space as against large amount of farmland being
9
converted for urban construction as reported by Cheng, Liu, Brown & Searle (2018). Arshad and Routray (2018) further expressed that the provision of urban green infrastructure of the housing scheme system utilizes the green spaces and the dwelling unit and per capita share of the green spaces. This justify the reason China’s housing sector exhibits significant impact on global energy consumption (Zhang, Wu & Liu, 2018). Moreover, the land use efficiency (LUE) approach which is an effective housing allocation policy mitigates the profound challenges of urban planning and risk of regional environmental degradation.
Furthermore, effective housing development and allocation policy are primarily determined by the adoption of modern constructional technologies and production of building materials. In turn, the study by Larionov (2018) indicates that the housing policy in the concept of energy saving and energy efficiency is designed to pre-determine the construction of high-rise residential buildings and other housing and utility services. The study identifies the role of such policy in harmonizing economic interests of the key market players. These interests are contradictions that arise from the motives and economic expectations of both the housing suppliers and end users of the facilities. Also, notably because of cost effectiveness, income differential (low and high income) housing policies are being considered in the provision of the supply of housing and the housing facilities. In their study, McCabe, Pojani and van Groenou (2018) implied that the newly evolving housing association for low-income earners equally provides opportunity for renewable energy installations at reduced social and financial costs end users. Also, in Sweden, owners of rental housing adopt a deep housing renovation policy that do not only encourage renewable energy use, but is aimed at reducing carbon emissions from residential housings (Femenías, Mjörnell & Thuvander, 2018). In European countries like the aforementioned case of Sweden, the European energy policies as noted by Femenías, Mjörnell and Thuvander (2018) are importantly responsible for the housing development frameworks.
3. Data and Empirical Approach
3.1 Data and Variables
In studying a panel of seven selected CMCs (Spain, France, Slovenia, Greece, Turkey, Lebanon and Israel), annual datasets spanning from 1999 to 2014 were employed. The restriction to seven countries of the region was due to data unavailability especially for the dwellings, buildings and residential construction data. Renewable energy consumption (rec) which is a dependent variable
10
is the percentage of total energy consumed in kilotons. The Total Dwellings and Residential Buildings by Stage of Construction (drb) which proxy for the housing policy (development) is the number of housing construction per annual. Carbon dioxide (CO2) emissions which proxy for
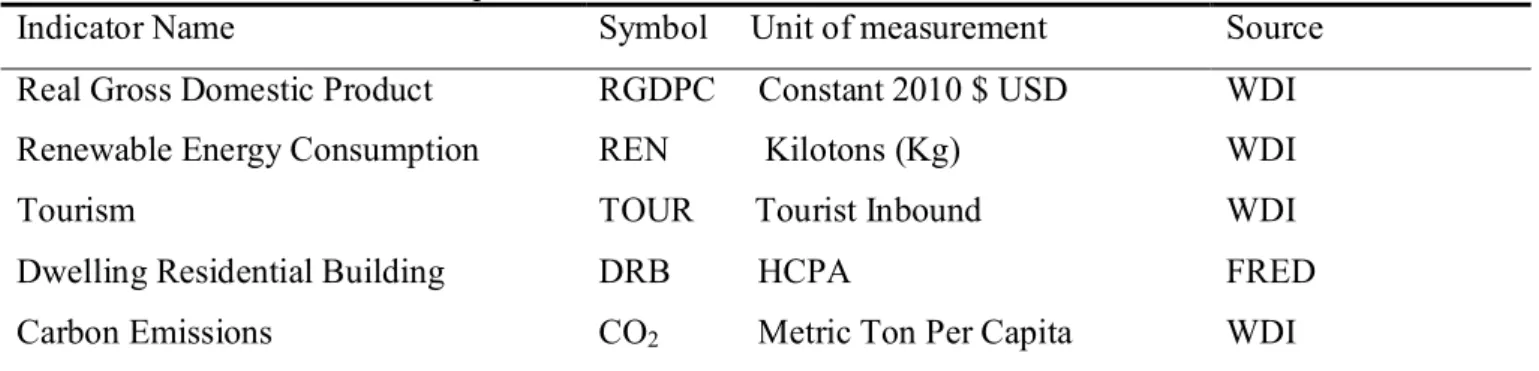
environmental degradation are from the burning of fossil fuels (during consumption of solid, liquid, and gas fuels and gas flaring) and the manufacture of cement which is measured in kilotons. The Real Gross Domestic Product (gdp) in billions of constant 2010 dollars and the International tourism arrival (tour) are employed as a control variable (Reboredo, 2015; Dutta, 2017). Table 2 report the descriptive statistics, while Table 3 carefully describe and present the data source.
Table 2: Descriptive statistics Mean REN 12.201 DRB 7.072 CO2 11.528 GDPC 23501.95 TOUR 16.267 Median 12.045 5.627 11.438 25838.41 16.429 Maximum 23.618 15.171 12.861 41630.09 18.242 Minimum 5.868 2.636 9.458 6539.657 13.666 Std. Dev. 4.232 3.553 1.085 10913.06 1.435 Skewness 0.501 1.391 -0.370 -0.164 -0.166 Kurtosis 2.478 3.659 1.945 1.944 1.684 Jarque-Bera 5.965 38.178 7.748 5.705 8.587 Probability 0.550 0.080 0.120 0.157 0.013 Sum 1366.599 792.144 1291.213 2632219. 1821.992 Sum Sq. Dev. 1988.344 1401.315 130.804 1.320 228.622 Observations 112 112 112 112 112
Table 3: Data Source and Description
Indicator Name Symbol Unit of measurement Source
Real Gross Domestic Product RGDPC Constant 2010 $ USD WDI Renewable Energy Consumption REN Kilotons (Kg) WDI
Tourism TOUR Tourist Inbound WDI
Dwelling Residential Building DRB HCPA FRED
11
Note: WDI represents world development indicators while FRED is the Federal Reserve Bank of St. Louis online
database. HCPA is the housing construction per annual.
Following the studies of Aguirre and Ibikunle (2014) on the determinants of renewable energy growth; a global sample analysis, a study built on Marques (2012) and Sadorsky (2009), the study empirical model is specified as follow;
rec = f (co2, drb, gdp, tour) (1)
Eq. (1) is rewritten in a natural logarithmic form, such that all variables are transformed accordingly as specified in Eq. (2):
reci, t = β0 + β1 lndrbi, t + β2 lnCO2 i, t + β3 lngdpi ,t + β4 lntouri ,t +ε i, t (2)
where β0 is the constant of the estimation and β1, … β4 are the coefficients of the explanatory
variables. For all i = 1, … 7 and t = 1999, …2015 which are the cross sections, ε is the error term which are independent and identically distributed with zero mean and constant variance.
3.2 Empirical Approach
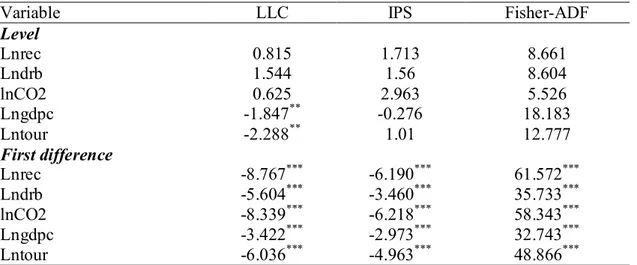
Before proceeding to the estimation, the stationarity properties of the variables under observation is examined. In this study, panel unit root tests as proposed by Maddala and Wu, (1999) Fisher-ADF and Levin, Lin and Chu (2002) henceforth (LLC) and Im, Pesaran and Shin (2003) are carried out and results reported in Table 4. The LLC (2002) panel unit root test take into consideration ADF-model type specified in Eq. (3);
. , 1 1 , , ,
i t i i t j i j i t j i t
z z z
(3)The LLC unit root test is built on the assumption that, the persistence parameters
i are same over the cross-sections, (
i
for alli
). Although, the lag order
i may vary. This process evaluates the null that
i0
for alli
against its alternative hypothesis of
i0
for alli
. Therefore, rejection of the null hypothesis indicates potential panel-based integration framework4. The unit root tests were at first conducted in levels, then the first difference. Result as reported in Table 4 show that all the panel-series become stable at first difference i.e., I(1). Furthermore, we evaluate the existence of a long-run cointegration relationship among the variables on the basis of stationarity consistency of the regressors. The Panel Fisher-type4
12
cointegration test, as proposed by Johansen (1991) serve as a confirmatory test to augment the ARDL adjustment coefficient (from short- to long-run) term results, specified under null hypothesis of no cointegration (see Roudi et al 2018). Results as reported in Table 5 provides at least 4 cointegration vector and thus, confirm the existence of a long-run cointegration relationship among the panel series at a (p < 0.01) significant level.
Table 4: Panel unit root tests results
Variable LLC IPS Fisher-ADF
Level Lnrec 0.815 1.713 8.661 Lndrb 1.544 1.56 8.604 lnCO2 0.625 2.963 5.526 Lngdpc -1.847** -0.276 18.183 Lntour -2.288** 1.01 12.777 First difference Lnrec -8.767*** -6.190*** 61.572*** Lndrb -5.604*** -3.460*** 35.733*** lnCO2 -8.339*** -6.218*** 58.343*** Lngdpc -3.422*** -2.973*** 32.743*** Lntour -6.036*** -4.963*** 48.866***
Note: Variables are stationary at *** 0.01 and ** 0.05 significance levels. For definition of variables, refer to section 3.
Table 5: Fisher-type Johansen Panel Cointegration test
Regression Model ren = ƒ(drb, co2, gdpc, tour)
Number of Cointegrating Equations Trace test Maximum-eigenvalue test
None 9.704 9.704
At most 1 111.9*** 111.9***
At most 2 192.5*** 153.2***
At most 3 69.66*** 57.84***
At most 4 37.49*** 37.49***
Note: The p-value for rejecting the null hypothesis of no cointegration is at *** 0.01 significant level Mackinnon et al. (1999).
3.2.1 Dynamic Autoregressive Distributed Lag Methods
In order to estimate the ARDL models, we rewrite Eq. (2) in form of error correction model (ECM) as shown in Eq. (4)
1 * 1 * , , 1 , 1 , , 0 , , , lnRENi t ilnRENi t i i t p i j i t j q i j i t j i t j j Y REN Y
(4) where,13 , 1 1 p i i j j
, , , 0 0 , 1 1 q q i j i j j j i p i i j j
, *, , 1 q i j i d d j
and *, , 1 p i j i d d j
The first part of the Eq. (4),
( lnREN
i i t, 1
i i tY
,)
is the adjustment coefficient of renewableenergy growth towards deviation from the long-run cointegration path with its determinants, while the second part of the Eq. (4) is the short-run dynamics of the renewable energy growth equation. The parameter vector
is the regressors coefficients of the long-run renewable energy growth, while
i control for the error correcting speed of adjustment term. If the
i0
then, the renewable energy growth model would indicate an existence of a long-run cointegration relationship among the dependent and the independent variables. Furthermore, the higher the value (absolute value) of the speed of adjustment term( )
i , the faster would be the rate of convergence of the model, from the deviation in the short-run towards the long-run cointegration path, conversely. On the other hand, if the
i0
, this indicate the absence of stable long-runcointegration among dependent and the independent variables. Thus, one of the major attractions of the study are the speed of adjustment
( )
i and the long-run parameter estimates( )
iIn employing the ARDL models,pq1is mostly stated. It is mostly used in existing studies that adopt the ARDL frameworks to conduct empirical estimations (see Rafindadi and Yosuf 2013). This study also make use of an ARDL model withpq1 specification. The following equation is extracted by proposing ARDL (1, 1,1,1,1) in Eq. (5) as given below:
, , 1 ,0 , ,1 , 1 ,
lnREN
i t
i
ilnREN
i t
iY
i t
iY
i t
i t (5)We rewrite Eq. (5) as error correction model (ECM) as specified in Eq. (6):
, , 1 0,1 , ,1 . , lnRENi t i lnRENi t i i tY i Yi t i t (6) where,
i
1
i
, i i,0 i,1 i and 0,i i i
In order to estimate Eq. (6), this study make use of the Pooled Mean Group (PMG), the Mean Group (MG), and the Dynamic Fixed-Effect (DFE) approaches. The PMG estimator is built on
14
the assumption that, the long-run coefficients are homogeneous, and also give room for other slope coefficients to vary across sections, while the DFE estimator also assumes homogeneity in the short-run and long-run coefficients across cross-sections, except constant term (intercept). On the other hand, according to Pesaran and Smith (1995), the MG estimator do not impose aforesaid restriction. While the MG estimators are assumed to be consistent, when both Nand T are large, the PMG estimators would be inconsistent, if the heterogeneity proposition of the long-run slope coefficient is established. According to Blackburne and Frank (2007), the PMG estimators are more robust and consistent, relative to the MG estimators, provided the homogeneity assumption holds. It is crucial to note here that; the MG estimators are sensitive to outliers and sample size most especially when ( N ) is considerably large and (T) is small. Lastly, the PMG estimators are robust and more reliable to outliers and lag orders, (Pesaran et al 1999), while the suitable and optimal model between these estimators can be chosen through the use of Hausman specification test (Rafindadi, Muye and Kaita 2018).
4. Empirical Results and Discussion
The examined dataset is characterized by statistical properties which informs the possible normality of the dataset. Given the possibility of the problem of contemporaneous correlation or cross-sectional correlation resulting from cross-section dependence (CSD) in the panel estimate, our study performed a cross-section dependence test. In the current study, there is no concern of estimation bias resulting from long-range and the spatial dependency as observed by Moscone & Tosetti (2010) and the use of macro panels with long series and micro panel with few time-series as observed by Baltagi (2008).
Having established the integration order of the macro panel series, with the existence of a
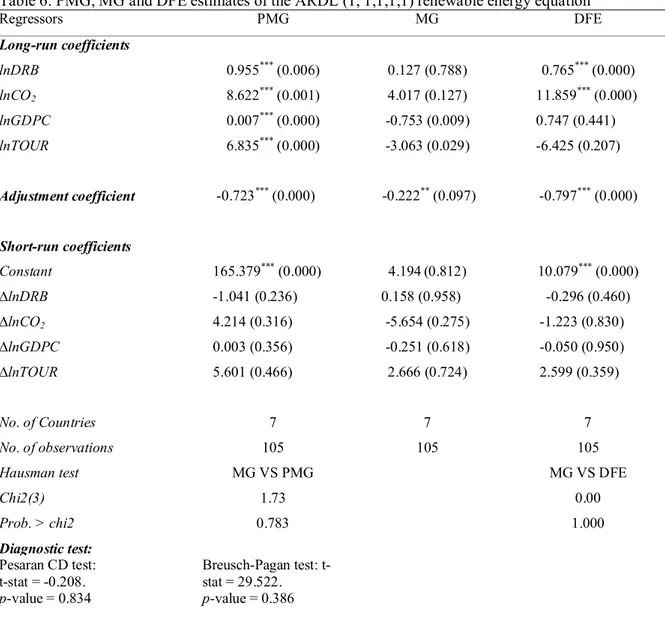
long-run cointegration nexus among the variables at (p < 0.01) significant level in Table 4 and Table 5, we proceed with the empirical estimations. Table 6 presents the PMG, MG and DFE estimators as obtained using Eq. (6) for long-run coefficients, adjustment coefficient, and the short-run coefficients. Table 6, row 1 and 2 shows that the long-run coefficients of and 2 is positive and statistically significant at a (p < 0.01) level under the PMG and DFE methods, while it is statistically insignificant under the MG method. To present appropriately the long-run equilibrium relationship between renewable energy (dependent variable) and its explanatory variables, we conducted pairwise comparison between the MG estimators and PMG estimators
15
and between the MG and DFE estimators, using the Hausman specification test5. This is done to evaluate the additional homogeneity restrictions on the model estimates imposed through the PMG and DFE estimators relative to MG estimator.
The PMG and DFE estimators as mentioned earlier, are more consistent and efficient relative to the MG estimator, with the null hypothesis of homogeneity restrictions. In Table 6, we reported the Hausman specification test statistics. The statistic value of (1.73) with p-value of (0.783) was reported for MG and PMG estimators, and statistic value of (0.00) with p-value of (1.000) for MG and DFE estimators. Based on the Hausman specification test conducted, we have no evidence to reject null hypothesis in both instances. Thus, we conclude that the PMG and DFE estimators are more efficient and most suitable for our empirical analysis than the MG estimators. However, we lay more emphasis on the PMG estimators, since it reported more significant estimated coefficients, than the DFE method.
Table 6 presents the results of the Pooled Mean Group (PMG) of the study’s dynamic heterogeneous panel. For the panel estimate (a), all the explanatory variables are observed to be statistically significant in run and with adjustment parameter of about 73%. While the long-run impacts of lndrb, lnCO2, lngdp, and lntour on lnrec are all positive (0.955, 8.622, 0.007 and
6.835) and statistically significant at a (p < 0.01) level. The lnCO2 emissions exhibit positive
impact on the renewable energy growth. This indicate that, a 1% increase in CO2 emissions
(environmental degradation) will lead to 0.8622% increase in the renewable energy growth in the long-run. This finding is in line with the study of Aguirre and Ibikunle (2014) where they argued that CO2 emissions is crucial determinant of renewable energy growth and categorized CO2
emissions a socio-economic factor that determine renewable energy growth among the nations of the world. In addition, results show that, a 1% increase in the numbers of dwellings, building and residential constructions (drb), real income and tourism will lead to 0.955%, 0.007%, and 6.835% increase in the renewable energy growth (rec) in the case of the sampled panel countries in the long-run. Although, Sørensen (2008) fell short of a wider coverage of the study of an interaction between renewable energy and construction demand, however, the investigation is quite similar to the current study.
5
This finding is consistent with the reported in appendix 1 for panel static model. The H-test reject the null hypothesis of random effects. Thus, we confirm the existence of slope homogeneity in the model.
16
Having noticed that the variables exhibit statistically insignificant impact on renewable energy consumption for the combine panel PMG estimations at all significance levels, we carried out individual short-run estimate for to substantiate whether the explanatory variables have significant impact when individual countries are considered. This is another advantage of using the PMG framework of the dynamic Autoregressive Distributed Lag approach. Short-run coefficients for individual sampled countries is reported in Table 7.
Table 6: PMG, MG and DFE estimates of the ARDL (1, 1,1,1,1) renewable energy equation
Regressors PMG MG DFE Long-run coefficients lnDRB 0.955*** (0.006) 0.127 (0.788) 0.765*** (0.000) lnCO2 8.622*** (0.001) 4.017 (0.127) 11.859*** (0.000) lnGDPC lnTOUR 0.007*** (0.000) 6.835*** (0.000) -0.753 (0.009) -3.063 (0.029) 0.747 (0.441) -6.425 (0.207) Adjustment coefficient -0.723*** (0.000) -0.222** (0.097) -0.797*** (0.000) Short-run coefficients Constant 165.379*** (0.000) 4.194(0.812) 10.079*** (0.000) ∆lnDRB -1.041 (0.236) 0.158 (0.958) -0.296 (0.460) ∆lnCO2 ∆lnGDPC ∆lnTOUR 4.214 (0.316) 0.003 (0.356) 5.601 (0.466) -5.654 (0.275) -0.251 (0.618) 2.666 (0.724) -1.223 (0.830) -0.050 (0.950) 2.599 (0.359) No. of Countries 7 7 7 No. of observations 105 105 105
Hausman test MG VS PMG MG VS DFE
Chi2(3) 1.73 0.00 Prob. > chi2 Diagnostic test: Pesaran CD test: t-stat = -0.208. p-value = 0.834 0.783 Breusch-Pagan test: t-stat = 29.522. p-value = 0.386 1.000
Note: The number of observations drops from 119 to 105 since the first order lag of the dependent variable is included in the right-hand side of the renewable energy equation specified in equation (4). P-values are in (). Variables are significant at *** (p < 0.01) and ** (p < 0.05) levels respectively.
17
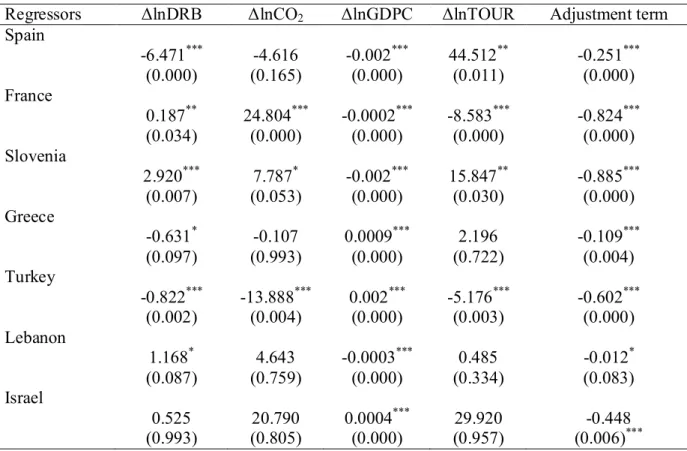
Considering the short-run PMG estimators across cross-sections, the lndrb exhibit positive and significant impact on lnrec in France (0.187), Slovenia (2.921), and Lebanon (1.169), and negative and significant impact on lnrec in the remaining panel countries (i.e. Spain, Greece and Turkey) except in Israel. Interestingly, the RES information presented in Table 1 indicates that Spain, Greece and Turkey are among countries with the largest share of REC per Total Primary of Energy Supply (TPES). Thus, it could then be argued that the renewable energy source in these countries are land (arable land) intensive. In addition, for CO2 emissions in the short-run,
the impact is not significant in Spain, Greece, Lebanon and Israel, but the impact is found to be positive and statistically significant in France, Slovenia, and Turkey. Additionally, in the short-run, the lngdp negative and significant impact on lnrec in all the panel countries except for Greece, Turkey and Israel. Similarly, the short-run impact of lntour on lnrec in the all the panel countries is found negative and significant except for Spain, Slovenia, Lebanon, and Israel respectively.
Table 7: PMG Short-term coefficient across cross-sections
Regressors ΔlnDRB ΔlnCO2 ΔlnGDPC ΔlnTOUR Adjustment term
Spain -6.471*** (0.000) -4.616 (0.165) -0.002*** (0.000) 44.512** (0.011) -0.251*** (0.000) France 0.187** (0.034) 24.804*** (0.000) -0.0002*** (0.000) -8.583*** (0.000) -0.824*** (0.000) Slovenia 2.920*** (0.007) 7.787* (0.053) -0.002*** (0.000) 15.847** (0.030) -0.885*** (0.000) Greece -0.631* (0.097) -0.107 (0.993) 0.0009*** (0.000) 2.196 (0.722) -0.109*** (0.004) Turkey -0.822*** (0.002) -13.888*** (0.004) 0.002*** (0.000) -5.176*** (0.003) -0.602*** (0.000) Lebanon 1.168* (0.087) 4.643 (0.759) -0.0003*** (0.000) 0.485 (0.334) -0.012* (0.083) Israel 0.525 (0.993) 20.790 (0.805) 0.0004*** (0.000) 29.920 (0.957) -0.448 (0.006)***
18
4.1 The Diagnostic Test
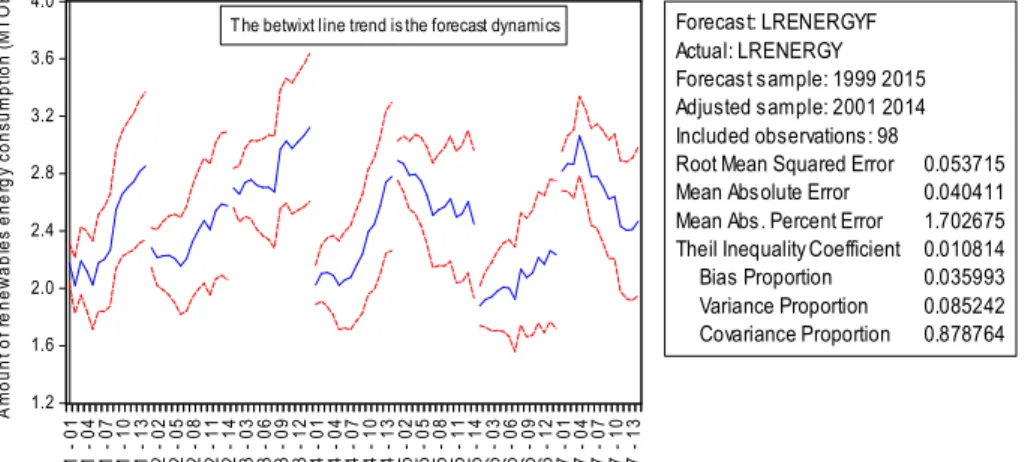
Foremost, from the lower part of Table 6, the cross-sectional dependence is tested. The result indicates that there is no empirical evidence of cross-sectional dependence. Also, the residual test presents the normality of the estimated model. Additionally, the forecasting ability of the model (a) from the equation 1 is investigated with the result presented as Figures 1 and 2. In both the dynamic and static forecasting as respectively presented in Figure 1 and 2, the Root Mean Square Error (RMSE), the Theil Inequality Coefficient and Bias proportion (known as systemic error) presents a statistically valid information.
1.2 1.6 2.0 2.4 2.8 3.2 3.6 4.0 1 0 1 1 0 4 1 0 7 1 1 0 1 1 3 2 0 2 2 0 5 2 0 8 2 1 1 2 1 4 3 0 3 3 0 6 3 0 9 3 1 2 4 0 1 4 0 4 4 0 7 4 1 0 4 1 3 5 0 2 5 0 5 5 0 8 5 1 1 5 1 4 6 0 3 6 0 6 6 0 9 6 1 2 7 0 1 7 0 4 7 0 7 7 1 0 7 1 3 LRENERGYF ± 2 S.E. Forecast: LRENERGYF Actual: LRENERGY Forecast sample: 1999 2015 Adjusted sample: 2001 2014 Included observations: 98
Root Mean Squared Error 0.053715 Mean Absolute Error 0.040411 Mean Abs. Percent Error 1.702675 Theil Inequality Coefficient 0.010814 Bias Proportion 0.035993 Variance Proportion 0.085242 Covariance Proportion 0.878764
Forcasted years for Countries:1-Spain, 2-France, 3-Slovenia, 4-Greece, 5-Turkey, 6-Lebanon, 7-Israel
A m o u n t o f re n e w a b le s e n e rg y c o n s u m p ti o n ( M T O E )
T he betwixt line trend is the forecast dynamics
Figure 1: A dynamic forecasting of rec model.
-2 -1 0 1 2 3 4 5 6 7 1 0 1 1 0 4 1 0 7 1 1 0 1 1 3 2 0 2 2 0 5 2 0 8 2 1 1 2 1 4 3 0 3 3 0 6 3 0 9 3 1 2 4 0 1 4 0 4 4 0 7 4 1 0 4 1 3 5 0 2 5 0 5 5 0 8 5 1 1 5 1 4 6 0 3 6 0 6 6 0 9 6 1 2 7 0 1 7 0 4 7 0 7 7 1 0 7 1 3 LRENERGYF ± 2 S.E. Forecast: LRENERGYF Actual: LRENERGY Forecast sample: 1999 2015 Adjusted sample: 2001 2014 Included observations: 98
Root Mean Squared Error 0.047174 Mean Absolute Error 0.034784 Mean Abs. Percent Error 1.420379 Theil Inequality Coefficient 0.009513 Bias Proportion 0.000000 Variance Proportion 0.003318 Covariance Proportion 0.996682
The betwixt line trend is the forecast dynamics
Forecast year for countries: 1-Spain, 2-France, 3-Slovenia, 4-Greece, 5-Turkey, 6-Lebanon, 7-Israel
A m o u n t o f re n e w a b le e n e rg y c o n s u m p ti o n ( M T O E )
19
5 Conclusion Remarks and Policy Implications
The current study investigates the long-run and short-run dynamic nexus of renewable energy consumption with carbon emission (CO2), housing construction policy (drb), and with gdp per
capita and international tourism arrivals as considered as additional variables. With the PMG approach employed, the positive impacts of the main explanatory variables (carbon dioxide and dwellings and residential constructions) and that of gdp per capita and tourism arrivals on the renewable energy consumption were examined in a panel of seven CMCs (Spain, France, Slovenia, Greece, Turkey, Lebanon and Israel) over the period 1999-2014 in the long-run. The equilibrium adjustment parameter of the model from short-run is approximately 73%. One interesting observation from this juxtaposition is that the consumption of renewable energy and the housing allocation policy is less prominent in most of the North African countries of the CMCs. This indicates that housing allocation policy and consumption of the RES among the North African countries of the CMCs is lower compared to the Middle East and European countries of the CMCs. Also, supporting the above illustration, our observation from Table 1 indicates that the generation of RES decreases along the coastline of the Mediterranean. The order is specifically from the European coastline to the Middle East and lowest in the North African region of the coast, suggesting the REC varies across countries as suggested by Aguirre and Ibikunle (2014). However, evidence from the study indicates that CMCs region is potentially important for RES, considering its natural geography and environmental remoteness. Obviously, this assertion is robust given that the total resource rents posit similar long-run result as modelling with res.
Furthermore, the inference from the interaction between housing allocation and renewable energy in the panel countries examined suggests an interesting challenge to policymakers. In recent times, especially since early 2000, an appreciable percent of RES (millions tonnes of oil equivalent, MTOE) is increasingly being utilized in the countries examined. Evidently from the Tabel 1, biofuels and waste is observed to have the highest component of the RES in all the countries examined. Also, in the countries examined, tens or hundreds(s) of thousand(s) of dwellings, building and residential structures are allocated for construction annually as a policy. Applying the basic economic theory, more dwellings and building allocation should translate to
20
increase in REC. Expectedly, the long-run estimate of the panel suggests a similar outlook; it posits a positive long-run relationship between the peculiar housing policy and RES (Zhang, Wu & Liu, 2018). The implication of this is that continuous expansion and housing construction in the panel of countries in the long-run would potentially increase the demand for renewable energy, thus increasing the REC (Femenías, Mjörnell & Thuvander, 2018; Nezhnikova, Papelniuk & Dudin, 2019). However, in Spain, Greece, and Turkey, the construction and allocation of buildings is observed to have negative short-run impact on REC. The result justifies the empirical evidence that RES in this panel of countries is largely developed domestically in the panel countries and mostly depend on the resources from the environment (these are land, agricultural source, water, and others) (see Alola, A. & Alola, U., 2018). Also, for the positive short-run and cross-section relationship (see France, Slovenia, Lebanon and Israel in Table 7), it could be adjudged that the growth rate of RES as a share of TPES is not land intensive (land being the main component of housing). As such, the source of RE could rather be from wind and solar powers at least for a short period of time (US EIA, 2017).
Moreover, as also noted in Sadorsky (2009a), the implication of having an increased CO2
emission causing higher REC is that energy stakeholders will be more concerned about the issue of global warming. Therefore, the increased awareness of climate change will expectedly be geared toward discouraging the fossil fuel consumption and thus increasing REC (Marques & Fuinhas, 2012). It implies that regular oil investors are likely to shift their investments to renewable energy and thereby causing expansion and profitability of the renewable energy market. The current study also suggest the significant and positive evidence of income-renewable energy consumption hypothesis (Nguyen & Kakinaka, 2019; Ozcan & Ozturk, 2019). As proposed by Dalton, Lockington & Baldock (2008), the current study similarly implies that tourism positively impact the consumption of renewable energy consumption positively.
The policy implication of the aforesaid results suggest that the stakeholders in the tourism, energy, environmental sectors, and in conjunctions with the private and public sectors are expected to work toward a unanimous strategies of efficient energy and economies of the examined countries. Also, the short-run evidence of the relationship between renewable energy consumption and housing policy especially for Spain, Greece and Turkey suggests a proactive policy essentials. As an urgent measure, the respective countries should avoid a mismatch policy
21
that could potentially hinder their energy and sustainable environmental targets. In the future study, the coverage of study could be expanded to accommodate more CMCs in a similar empirical analysis. The peculiarity of the region (CMCs) in the study of renewable energy is strongly associated with the geographical and resource spread along the coast. As such, incorporating at least sizeable number of countries in any further investigation is desirable. Lastly, further study could consider similar study by attempting to investigate potential non linearity evidence in the same case study.
References
Aguirre, M., & Ibikunle, G. (2014). Determinants of renewable energy growth: A global sample analysis. Energy Policy, 69, 374-384.
Alola, A. A., & Alola, U. V. (2018a). Agricultural land usage and tourism impact on renewable energy consumption among Coastline Mediterranean Countries. Energy & Environment, 0958305X18779577.
Alola, A. A., & Alola, U. V. (2018b). The Dynamics of Tourism—Refugeeism on House Prices in Cyprus and Malta. Journal of International Migration and Integration, 1-16.
Alola, A. A., & Alola, U. V. (2019). The dynamic nexus of crop production and population growth: housing market sustainability pathway. Environmental Science and Pollution Research, 1-9.
Alola, A. A. (2019). Carbon emissions and the trilemma of trade policy, migration policy and health care in the US. Carbon Management, 1-10.
Alola, A. A., Yalçiner, K., Alola, U. V., & Saint Akadiri, S. (2019). The role of renewable energy, immigration and real income in environmental sustainability target. Evidence from Europe largest states. Science of The Total Environment.
Arnette, A. N. (2017). Renewable energy and carbon capture and sequestration for a reduced carbon energy plan: An optimization model. Renewable and Sustainable Energy Reviews, 70, 254-265.
Arshad, H. S. H., & Routray, J. K. (2018). From socioeconomic disparity to environmental injustice: the relationship between housing unit density and community green space in a medium city in Pakistan. Local Environment, 23(5), 536-548.
22
Apergis, N., & Payne, J. E. (2009a). Energy consumption and economic growth in Central America: evidence from a panel cointegration and error correction model. Energy Economics, 31(2), 211-216.
Apergis, N., & Payne, J. E. (2009b). Energy consumption and economic growth: evidence from the Commonwealth of Independent States. Energy Economics, 31(5), 641-647.
Apergis, N., & Payne, J. E. (2010a). Renewable energy consumption and economic growth: evidence from a panel of OECD countries. Energy policy, 38(1), 656-660.
Apergis, N., & Payne, J. E. (2015). Renewable energy, output, carbon dioxide emissions, and oil prices: evidence from South America. Energy Sources, Part B: Economics, Planning, and Policy, 10(3), 281-287.
Blackburne, E. F., & Frank, M. W. (2007). Estimation of non-stationary heterogeneous panels. Stata Journal. 7(2), 197.
Baltagi, B. (2008). Econometric analysis of panel data. John Wiley & Sons.
Caesar, C., & Kopsch, F. (2018). Municipal land allocations: a key for understanding tenure and social mix patterns in Stockholm. European Planning Studies, 1-19.
Change, E. (2018). Who Is to Blame for the Decline of Large Housing Estates? Housing Estates in Europe: Poverty, Ethnic Segregation and Policy Challenges, 57.
Chen, Y. (2018). Factors influencing renewable energy consumption in China: An empirical analysis based on provincial panel data. Journal of Cleaner Production, 174, 605-615. Cheng, L., Liu, Y., Brown, G., & Searle, G. (2018). Factors affecting farmers' satisfaction with
contemporary China's land allocation policy–The Link Policy: Based on the empirical research of Ezhou. Habitat International, 75, 38-49.
Dalton, G. J., Lockington, D. A., & Baldock, T. E. (2008). A survey of tourist attitudes to renewable energy supply in Australian hotel accommodation. Renewable energy, 33(10), 2174-2185.
Dumitrescu, E. I., & Hurlin, C. (2012). Testing for Granger non-causality in heterogeneous panels. Economic Modelling, 29(4), 1450-1460.
Duscha, V., & del Río, P. (2017). An economic analysis of the interactions between renewable support and other climate and energy policies. Energy & Environment, 28(1-2), 11-33. Dutta, A. (2017). Oil price uncertainty and clean energy stock returns. New evidence from crude
23
Federal Reserve Bank of St. Louis (2018). https://fred.stlouisfed.org/. (Accessed: 25 June 2018). Femenías, P., Mjörnell, K., & Thuvander, L. (2018). Rethinking deep renovation: The
perspective of rental housing in Sweden. Journal of Cleaner Production.
Gram-Hanssen, K., & Georg, S. (2018). Energy performance gaps: Promises, people, practices. Gram-Hanssen, K., Georg, S., Christiansen, E., & Heiselberg, P. (2018). What next for
energy-related building regulations? the occupancy phase. Building Research & Information, 1-14.
Houri, A. (2006). Solar water heating in Lebanon: current status and future prospects. Renewable energy, 31(5), 663-675.
Im, K. S., Pesaran, M. H., & Shin, Y. (2003). Testing for unit roots in heterogeneous panels. Journal of Econometrics, 115(1), 53-74.
Johansen, S. (1991). Estimation and hypothesis testing of cointegration vectors in Gaussian vector autoregressive models. Econometrica: Journal of the Econometric Society. 1551-1580.
Kardooni, R., Yusoff, S. B., Kari, F. B., & Moeenizadeh, L. (2018). Public opinion on renewable energy technologies and climate change in Peninsular Malaysia. Renewable energy, 116, 659-668.
Kinab, E., & Elkhoury, M. (2012). Renewable energy use in Lebanon: barriers and solutions. Renewable and Sustainable Energy Reviews, 16(7), 4422-4431.
Koytsoumpa, E. I., Bergins, C., & Kakaras, E. (2017). The CO2 economy: Review of CO2 capture and reuse technologies. The Journal of Supercritical Fluids.
Larionov, A. (2018). Organizational and technical support of compliance of the energy performance class with the performance standards for construction of high-rise residential buildings. In MATEC Web of Conferences (Vol. 170, p. 01103). EDP Sciences.
Levin, A., Lin, C. F., & Chu, C. S. J. (2002). Unit root tests in panel data: asymptotic and finite-sample properties. Journal of econometrics, 108(1), 1-24.
Lin, B., & Xu, B. (2018). Factors affecting CO 2 emissions in China's agriculture sector: A quantile regression. Renewable and Sustainable Energy Reviews, 94, 15-27.
Marques, A. C., & Fuinhas, J. A. (2012). Are public policies towards renewables successful? Evidence from European countries. Renewable Energy, 44, 109-118.
24
Maddala, G. S., & Wu, S. (1999). A comparative study of unit root tests with panel data and a new simple test. Oxford Bulletin of Economics and statistics, 61(S1), 631-652.
Martinho, V. J. (2018). A transversal perspective on global energy production and consumption: An approach based on convergence theory. Energy & Environment, 0958305X18754379. Martinez-Mate, M. A., Martin-Gorriz, B., Martínez-Alvarez, V., Soto-García, M., & Maestre-Valero, J. F. (2018). Hydroponic system and desalinated seawater as an alternative farm-productive proposal in water scarcity areas: Energy and greenhouse gas emissions analysis of lettuce production in southeast Spain. Journal of Cleaner Production, 172, 1298-1310.
McCabe, A., Pojani, D., & van Groenou, A. B. (2018). The application of renewable energy to social housing: A systematic review. Energy Policy, 114, 549-557.
Moscone, F., & Tosetti, E. (2010). Testing for error cross section independence with an application to US health expenditure. Regional Science and Urban Economics, 40(5), 283-291.
Nezhnikova, E., Papelniuk, O., & Dudin, M. (2019). Developing Renewable and Alternative Energy Sources to Improve the Efficiency of Housing Construction and Management. International Journal of Energy Economics and Policy, 9(3), 172-178. Nguyen, K. H., & Kakinaka, M. (2019). Renewable energy consumption, carbon emissions, and
development stages: Some evidence from panel cointegration analysis. Renewable Energy, 132, 1049-1057.
Nyasha, S., Gwenhure, Y., & Odhiambo, N. M. (2016). Energy consumption and economic growth in Ethiopia: A dynamic causal linkage. Energy & Environment, 0958305X18779574.
Niu, J., Chang, C. P., Yang, X. Y., & Wang, J. S. (2017). The long-run relationships between energy efficiency and environmental performance: Global evidence. Energy & Environment, 28(7), 706-724.
Norris, M., & Byrne, M. (2018). Housing market (in) stability and social rented housing: comparing Austria and Ireland during the global financial crisis. Journal of Housing and the Built Environment, 33(2), 227-245.
25
Oliveira, E., & Hersperger, A. M. (2018). Governance arrangements, funding mechanisms and power configurations in current practices of strategic spatial plan implementation. Land Use Policy.
Ozcan, B., & Ozturk, I. (2019). Renewable energy consumption-economic growth nexus in emerging countries: A bootstrap panel causality test. Renewable and Sustainable Energy Reviews, 104, 30-37.
Pesaran MH (2004). “General Diagnostic Tests for Cross Section Dependence in Panels,” CESifo Working Paper 1229; IZA Discussion Paper 2004a; 1240(970).
Pesaran, M. H., & Smith, R. (1995). Estimating long-run relationships from dynamic heterogeneous panels. Journal of Econometrics. 68(1), 79-113.
Pesaran, M. H., Shin, Y., & Smith, R. P. (1999). Pooled mean group estimation of dynamic heterogeneous panels. Journal of the American Statistical Association. 94(446), 621-634. Rahman, F. A., Aziz, M. M. A., Saidur, R., Bakar, W. A. W. A., Hainin, M. R., Putrajaya, R., &
Hassan, N. A. (2017). Pollution to the solution: Capture and sequestration of carbon dioxide (CO2) and its utilization as a renewable energy source for a sustainable future. Renewable and Sustainable Energy Reviews, 71, 112-126.
Rafindadi, A. A., & Ozturk, I. (2017). Impacts of renewable energy consumption on the German economic growth: Evidence from combined cointegration test. Renewable and Sustainable Energy Reviews, 75, 1130-1141.
Roudi, S., Arasli, H., & Akadiri, S. S. (2018). New insights into an old issue–examining the influence of tourism on economic growth: evidence from selected small island developing states. Current Issues in Tourism, 1-21.
Rafindadi, A.A., Muye, I.M. and Kaita, R.A., 2018. The effects of FDI and energy consumption on environmental pollution in predominantly resource-based economies of the GCC. Sustainable Energy Technologies and Assessments, 25, pp.126-137.
Rafindadi, A.A. and Yosuf, Z., 2013. An Application of Panel ARDL in Analysing the Dynamics of Financial Development and Economic Growth in 38 Sub-Saharan African Continents. In Proceedings-Kuala Lumpur International Business, Economics and Law Conference.
26
REN21, 2016. Renewables 2016 Global Status Report, Paris, REN21 Secretariat and Washington, DC. Worldwatch Institute. http://www.ren21.net/about-ren21/annual-reports/.
(Accessed: 25 June 2018).
Reboredo, J. C. (2015). Is there dependence and systemic risk between oil and renewable energy stock prices? Energy Economics, 48, 32-45.
Rouleau, J., Gosselin, L., & Blanchet, P. (2018). Understanding energy consumption in high-performance social housing buildings: A case study from Canada. Energy, 145, 677-690. Sadorsky, P. (2009a). Renewable energy consumption, CO 2 emissions and oil prices in the G7
countries. Energy Economics, 31(3), 456-462.
Sadorsky, P. (2009b). Renewable energy consumption and income in emerging economies. Energy policy, 37(10), 4021-4028.
Sørensen, B. (2008). A sustainable energy future: Construction of demand and renewable energy supply scenarios. International Journal of Energy Research, 32(5), 436-470
Stern, N. (2008). The economics of climate change. American Economic Review, 98(2), 1-37. Shen, X., Huang, X., Li, H., Li, Y., & Zhao, X. (2018). Exploring the relationship between urban
land supply and housing stock: Evidence from 35 cities in China. Habitat International.
United States Energy Information Administration
(EIA), https://www.eia.gov/energyexplained/index.cfm?page=biomass_home. (Accessed: 25 June 2018).
Wang, X., Lim, M. K., & Ouyang, Y. (2017). Food-energy-environment trilemma: Policy impacts on farmland use and biofuel industry development. Energy Economics, 67, 35-48.
Wang, B., Wang, Q., Wei, Y. M., & Li, Z. P. (2018). Role of renewable energy in China’s energy security and climate change mitigation: An index decomposition analysis. Renewable and Sustainable Energy Reviews, 90, 187-194.
World Energy Resource 2016. World Energy Council. https://www.worldenergy.org/wp-content/uploads/2016/10/World-Energy-Resources-Full-report-2016.10.03.pdf.
(Accessed: 20 June 2018).
World Economic Forum, (2017). https://www.weforum.org/agenda/2017/04/who-s-the-best-in-europe-when-it-comes-to-renewable-energy/. (Accessed: 25 June 2018).
27
World Bank (WDI, 2018). World Development Bank. https://data.worldbank.org/products/wdi. (Accessed: 25 June 2018).
Wu, F. (2015). Commodification and housing market cycles in Chinese cities. International Journal of Housing Policy, 15(1), 6-26.
Xu, B., & Lin, B. (2017). Factors affecting CO2 emissions in China’s agriculture sector: Evidence from the geographically weighted regression model. Energy Policy, 104, 404-414.
Zhang, D., Wang, J., Lin, Y., Si, Y., Huang, C., Yang, J., & Li, W. (2017). Present situation and future prospect of renewable energy in China. Renewable and Sustainable Energy Reviews, 76, 865-871.
Zhang, L., Wu, J., & Liu, H. (2018). Policies to enhance the drivers of green housing development in China. Energy Policy, 121, 225-235.
Zhang, Y., Kang, J., & Jin, H. (2018). A Review of Green Building Development in China from the Perspective of Energy Saving. Energies, 11(2), 334.
Zhi-Guo, L., Cheng, H., & Dong-Ming, W. (2018). Empirical research on the relationship between natural gas consumption and economic growth in Northeast Asia. Energy & Environment, 29(2), 216-231.
28 Appendix 1: Panel Static Models
Fixed Effects Random Effects
Variables lndrb 2.307*** (0.000) 1.612*** (0.000) lnCO2 11.531*** (0.000) 8.959*** (0.000) lngdpc 0.0003*** (0.004) 2.720 (0.773) lntour 0.717 (0.392) 2.127*** (0.005) Constant 141.688*** (0.000) 91.654*** (0.000) R2 0.866 0.528 R2-Adjusted 0.853 0.51 F-stat 65.613*** (0.000) 29.937*** (0.000) No of Countries 7 7 Observation 119 119 H-Test 50.796*** (0.000)