ч . %. ··»·*■.« я- -ip ^.ja;4i^wih*¿· ;iii-., jv r:: ·;■..:^λ»;·Π7€/! f ' - ' i i . J t '
· Äoä“^i»l»'Vÿ·'^^ “W î “íM>'1?” ··(»***·# f.V|A»iÂf -«¡Х '·' «·
SORPTION BEHAVIOR OF RADIOIODINE ON
o r
C
t
A
n ic
r ic h
s o il
,
a l u m in a
a n d
c l a y
MINERALS
A THESIS
SUBMITTED TO THE DEPARTMENT OF CHEMISTRY AND THE INSTITUTE OF ENGINEERING AND SCIENCES
OF BILKENT UNIVERSITY
IN PARTIAL FULFILLMENT OF THE REQUIREMENTS FOR THE DEGREE OF
MASTER OF SCIENCE
By
SHOELEH ASSEMI
June 1992
ß i ' J / J y i ^ s u > ■ ñ S >
I certify that 1 have read tliis thesis and that in iny opinion it is fully adequate, in sco|)c a.n<.l in (luaJity, a.s a. tliesis lor the degixi<; of Ma,st(u· of Science.
Prol. Dr. Hasan N. lirten(Principal Advisor)
I certify that I have read this thesis and that in my opinion it is fully adequate, in scope and in quality, as a thesis for the degree of Master of Science.
Assoc. Prof. Dr. Helle Göktürk
I certify that I have read tlds tlicsis and that in my oi:>inion it is fully adequate^, in scope and in quality, as a thesis for the degree of Master of Science.
Prof. Dr. Zeki I^ruoğlu
Approved for the Institute of liiigineering and Sciences:
Prof. Dr. Mehinet 3aray
ABSTRACT
SORPTION BEHAVIOR OF RADIOIODINE ON ORGANIC
RICH SOIL, ALUMINA AND CLAY MINERALS
SHOELEH ASSEMI
M.S. in Chemistry
Supervisor: Prof. Dr. Hasan N. Erten
June 1992
Sorption behavior of radioiodine on organic rich soil, alumina, chlorite- illite clay mixture, kaolinite and bentonite have bc;en studied using the batch
method. was used as tracer.
Characterization of samples were done by FTIR, X-ray diffraction spec trometry and particle size distribution by Andreason pipette method.
The grain size of the samples used were all below 38/xm and the exper iments were performed at room temperature. The aqxreos phase used in all experiments were synthetic ground water with a composition similar to the underground waters of the regions where the samples were obtained.
Stock solutions containing tracer, were prepared using synthetic ground-
water. Initial concentration of inactive iodide ion in the solutions ranged from 10~®to 10“^ mmole/ml.
The influence of contact time, solution/solid ratio, pH of synthetic ground- water, biomass of soil and I~ ion concentration on the sorption of radioiodine on the organic rich soil were investigated. The effect of I~ ion concentration
IV
and complexing agents on the sorption behavior of radioiodine on alumina and clay minerals were also studied.
A rather slow kinetics was observed for tlie adsor])tion of radioiodine on the organic rich soil, tending saturation within 14 da.ys. It was observed that distribution ratio increased with increasing ratio of the volume of solution to the mass of soil(V/m ratio) and reached a platee.u after V/m =50. Distribution ratio did not change very much by changing the pH of the solution. Com parison of Eh-pH behavior of the solutions with the standard Eh-pH graph of iodine-water system indicated that in the whole pH rcinge, iodine is mostly preseirt in I~ form. To observe the effect of soil biomass soil samples were
sterilized by heat and gamma-ray source and the results were found to
be much lower than the control sample.
Increasing the concentration of iodide ion in the .solution, caused a decrease in Rd. values. Desorption Wcvs ol)served only for low initial iodine concentrations < 1 X I0~^7nmol/ml), for organic rich soil which suggests that at least
two sites and/or mechanisms are involved in the sorption.
The sorption data were fitted to Freundlich and Dubinin-Radushkevich isotherms. The slope of Freundlich isotherm was found to be less than 1 which indicates the non-linearity of the isotherm. The mean free energy of adsorption was calculated from the slope of Dubinin-Radushkevich isotherm and was found as about 11 k.J/mol. The distribution of sites on organic rich soil was calculated using the Freundlich and Dubinin-Radushkevich constants, considering Cl~ as the competing ion with I~ in the solution. The affinities of sites were found to be about three times higher for Cl~ than I~.
Among the clay minerals, the highest Rd value was found for chlorite-illite cla}^ mixture but tlie Rd values found for alumina and the other sanrples were well below those found for the organic rich soil. The sorption data were fitted to Freundlich and Dubinin-Radushkevich isotherms. All the Freundlich isotherms were non-linear (slope<l), except for alumina (slope=0.98), since the alumina sample used was 99% AI2O3.
range of 9-11 kJ/ntol. The .site disiribulion curvois were also obtained for tl samples and the affinities of sites were found to be at least three times higher for Cl~ than I~.
Clay samples were ])retreated with comjilexing agents EDTA (Ethelene Di amine Tetra Acetic acid) cuid TPAI (Trimethyl Phenyl Ammonium Iodide). Very low or zero Rii values were found for treated samples.
Keywords: Sorption, Desorption, R.adioiodine, Organic rich soil. Alumina, Clay minerals. Batch method, Isothenns, Sorption energy. Site distribution. Competing ion. Soil biomass, Coini)lexing agents.
ÖZET
r a d y o a k t i f
İYOD’UN ORGANİK TOPRAK, ALUMINA
VE KİL MİNERALLERİNDE TUTULMASI
SHOELEH ASSEMI
Kimya Bölümü Yüksek Lisans
Tez Yöneticisi: Prof. Dr. Haşan N. Erten
Haziran 1992
Bu çalışmada radyoaktif iyodun organik kı.smı yük.sek(%70) olan toprakta, alumina, klorit-illit kil karışımı, bentonit ve kaolinit de tutulması araştırılmıştır.
Örneklerin yapısal karektei'izasyonu, FTIR, X-işını kırınımı spektrometresi ve Andreason pipet metodu ile tanecik büyüklüğü dağılımı deneyleri ile yapılmıştır.
Baç yöntemi ile yapıları deneylerde, örnekler tanecik büyüklüğüne göre ayrıldıktan sonra tanecik büyüklüğü, 0-38/xm arası olanlardan belirli ağırlıklar alınmış ve polipropilen tüplerde değişik zaman aralıklarında, bilinen hacim ve
1“ iyonu derişiminde, izleyici içeren çözeltilerle çalkalanmış, sıvı ve katı fa
zlar santrifüj yolu ile ayrılmış ve sıvı fazdaki aktivite değişikliği izlenmiştir.
Deneyler boyunca sulu faz olarak örneklerin elde edildiği bölgelerdeki yer altı sularına uygun olarak hazırlanmış sentetik yeraltı suyu kullanılmıştır.
içeren çözeltilerde, aktif olmayan I~ iyonu , 10“® —10“‘^?7irno//m/ arası derişimlerle
kullanılmıştır.
Topraktaki tutulmanın zaman, hacim/kütle oranı, solü.syonun pH değeri, topraktaki mikroorganizmalar ve solüsyondaki / “ iyonu derişimi ile bağımlılığı.
incelenmiştir. Alumina ve killerde ise I iyonu derişimi ve kompleks yapan maddelerin tutulm a üzerindeki etkisi saptanmıştır.
Toprakla yapılan kinetik deneyde, tutulmanın çok yavaş ilerlediği ve doy- .gunluk değerine en az 14 gün sürede ulaşıldığı görülmüştür. Hacım/kütle oranı(V/m ), arttıkça, dağılım katsayısının yükseldiği ve V /m =50 den sonra sabit kaldığı görülmüştür. Dağılım katsayısı ,/?,/, sentetik yeraltı suyunun pH değişimi ile fazla değişiklik göstermemiştir. Bu solüsyonlardaki Eh değerleri, iyot-su sistemi Eh-pH diyagramı ile karşılaştırınca, turn pH aralıklarında, iyo dun çoğunlukla 1~ iyon şeklinde olduğu belirlemiştir. Topraktaki biokütlenin tutulm a üzerindeki etkisini görmek için, toprak numuneleri ısı ve ^'^(70 ka3maği ile sterilize edmiş ve dağılım katsayılarının sterilize olmayan topraktan çok daha düşük olduğu gözlenmiştir.
Sıvıdaki aktif olmayan iyodun derişimindeki artış, dağılım katsayısındaki düşüşe neden olmuş ve salıverilme (desorpsiyon), sadece düşük iyot derişimlerinde ([^~]? ^ 1 X 10”®mmo//m/ ) görülmüştür. Bu davranış, iyodun toprakta en az iki mekanizma veya tutulm a bölgelerince meydana geldiğini göstermektedir.
Tutulma izotermleri Freıındlich ve Dubinin-Radııslıkevich izoterm model lerine uygulanmıştır. Bu uygulamadan ise, tutulm a enerjisi yaklaşık 11 k.J/mol bulunmuştur. Ayrıca Cl~ iyonunu, / ” iyonuna rakip iyon olarak kabul ederek, tutulm a bölgelerinin çözeltideki I~ ve Cl~ iyonlarının tercih etmelerine göre, tutulm a bölgelerin da.ğibmı bulunmuştur. Tutulma bölgeleinin C'/“ ’u / ~ ’daüç. kat daha fazla tercih ettikleri hesaplanmıştır.
Killerde, en fazla tutulm a katsayısı, Klorit-Illit kil karışımı için bulundu. Alumina ve diğer kil örneklerdeki tutulm a katsayıları organik toprağa göre çok daha düşük buluıımuşLıır. izotermler Freıındlich ve Dubiuin-Radushkevich izoterm modellerine uygulanmış ve tutulm a enerjisi alumina ve killer için 8- 12 kJ/m ol arasında hesaplanmıştır. Freıındlich izotermlerin eğrileri killer için l ’den az bulunmştur. Alumina için ise,Freundlich sabiti 0.98 olarak bulunmuştur.
Bu değer ahıminanm saf (%99) AI2O3 olduğundan kaynaklanıyor.
T u t u l m a enerjileri a lu m in a ve killer için 8.5-11 k.J/mol olarak h esa p la n m ış tır. B u ö rn ek ler için t u t u l m a bölgelerin dağılım eğrileri elde edilm iştir. Bu ö rn ek le rd e
VI
de tutulm a bölgelerinin Cl iyonunu / iyonuna en az üç defa daha fazla tercih ettikleri belirlenmiştir.
Alumina ve kil örnekleri, EDTA (Etilen Diarnin Tetra Asetik asit) ve TPAİ (Trimetil Fenil Amonyum iyodür) ile denge haline getirilmiştir. Bu örnekler için çok düşük veya sıfır Rd değerleri elde edilmiştir.
Anahtar Kelimeler: Tutulma, Salıverilme, Radyoaktif iyot. Organik toprak, Alumina, Kil, Baç yöntemi, izotermler. Tutulma enerjisi. Bölge dağılımı. Rakip iyon. Topraktaki canlı kütle. Kompleks yapan madde.
ACKNOWLEDGEMENT
I would like to express my gratitude towards Prof. Dr. Hasan Erten, for his unceasing contribution, guidance and encouragement throughout the develop ment of this thesis.
I debt special thanks to Mr. Eray A§ansu, Yelda Sargm, Ay§m Solak and Nihan Nugay for their valuable helps in different steps of this work.
All my friends in Bilkent and Middle East Technical Universities are grate fully acknowledged for their continuous interest, help and morale support.
My last but not least thanks goes to Soheyl and my family who never left me alone and supported me by every means.
C o n ten ts
IN T R O D U C T IO N 1
1.0.1 Radioactive Waste M anagem ent... ... 1
1.0.2 I o d i n e ... ... 7
1.0.3 Clay M in e ra ls... ... 11
1.0.4 S o i l s ... ... 19
1.0.5 Soil Organic. M atter(S O M )... ... 21
1.0.6 The Sorption P ro c ess... 22
1.0.7 The Rrf C oncept... ... 24
1.0.8 Isotherm Models 25 1.0.9 Previous Work ... ... 27
E xperim ental 31 2.0.10 Size Fractionation 31 2.0.11 Synthetic G roundw ater... ... 33
2.0.12 Tracer Containing Stock Solutions... ... 34
2.0.13 Sorption-Desorption E x p e rim e n ts... ... 35
R esu lts and D iscussion 38 3.1 Characterization of S a m p le s ... ... 38
CONTENTS vii
3.2 Bolu-Yenigag S o i l ... 45
3.2.1 Kinetic E x p erim en t... 45
3.2.2 Variation of Di.stribution Ratio with the Ratio of Volume of the Solution to Mass of the S o lid ... 48
3.2.3 The ElTect of pH on the Adsorption of Iodine 49 3.2.4 Loading E x p erim en ts... 52
3.2.5 Adsorption Isotherm s... 56
3.2.6 Site Distribution 59 3.2.7 Effect of S terilizatio n ... 61
3.3 Clay M in e ra ls ... 63
3.3.1 Sorption Experim ents... 63
3.3.2 Adsorption Isotherm s... 66
3.3.3 Site Distribution 73 3.3.4 Effect of Complexing A g e n ts... 76
L ist o f F igu res
1.1 The Radioactivity of Heavy Nuclides in Spent Nucleiir Fuel . . . 6
1.2 The Migration Pathway of Radioiodine from an Underground
Repo.sitory to the Environment 8
1.3 Doses to Nearby Residents for Scenario A of Swedish Program . 10 1.4 Diagrammatic Sketch showing (a) A Single Octahedral Unit and
(b) The Sheet Structure of the Octahedral Units. 11
1.5 Diagrammatic Sketcli showing (a) A Single Silica Tetrahedron and (b) Tlie Sheet Structure of the Tetrahedrons Arranged in a
Hexagonal Network. 12
1.6 Schematic Representation of The Atom Arrangement in Unit cells of (a) A 2:1 La3^er Mineral (b) A 1:1 Layer M ineral... 13
1.7 Diagrammatic sketch of the structure of the kaolinite layer . . . 14
1.8 Schematic Representation of The Structure of Montmorillonite . 16 1.9 The Diagrammatic Sketch of The Structure of C hlorites... 17 1.10 Schematic Representation of The Structure of illite s ... 18
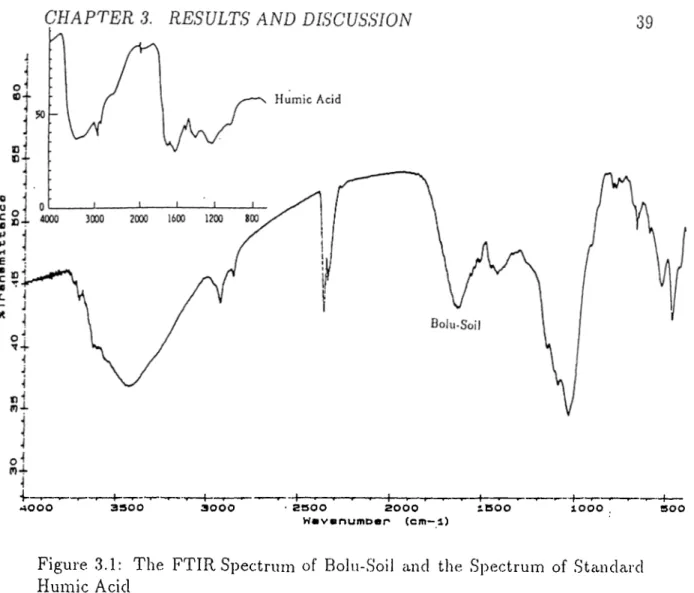
3.1 The FTIR spectrum of Bolu-Soil and the Spectrum of Standard
Humic A c i d ... 39 3.2 The FTIR Spectrum of Chlorite-Illite Clay mixture and the
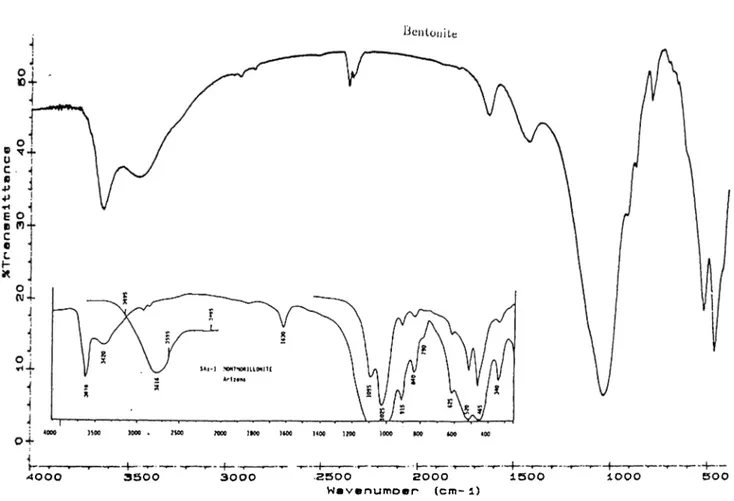
Spectrum of Standard Chlorite and I l l i t e ... 39 3.3 The FTIR Spectrum of Bentonite Clay and the Spectrum of
Standard M o n tm o rillo n ite... 40
LIST OF FIGURES IX
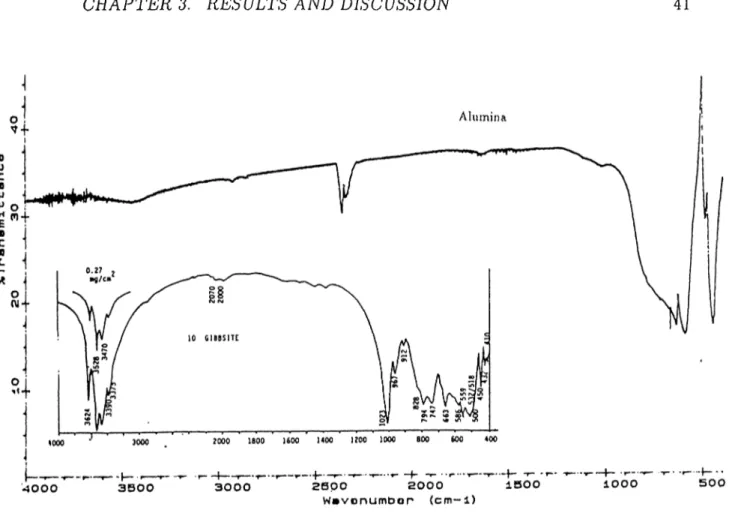
3.4 The FTIR Spectrum of Kaolinite Clay and the Spectrum of Standard K a o lin ite ... 40 3.5 The FTIR Spectrum of Alumina cind the Spectrum Gibbsite . . 41 3.6 The X-Ray Diffraction Pattern of Bolu S o il... 41 3.7 The X-Ray Diffraction Pattern of CHlorite-Illite Clay Mixture . 42 3.8 The X-Ray Diffraction Pattern of B e n to n ite ... 42 3.9 The X-Ray Diffraction Pattern of K aolinite... 43 3.10 The X-Ray Diffraction Pattern of A lu m in a ... 43 3.11 Particle Size Distribution Below 38/xm of Bolu-Soil and Minerals 44 3.12 The Change of Distribution Ratio with Time for Bolu-Yeniç Soil 46 3.13 Plot of Remaining Activity in the Solution versus Time for the
Adsorption of Radioiodine on Bolu-Yeniçağ S o i l ... 47 3.14 Change of Rj, with V/m Ratio for Bolu-Yeniçağ S o il... 49 3.15 The Change of Distribution Ratio with pH of the Solution for
Bolu-Yeniçağ S o i l ... 50 3.16 Eh-pH Diagram for Iodine-Water S y s te m ... 51 3.17 The Change of Distribution Ratio with the Iodine Loading for
Pretreated and untreated Bolu-Yeniçağ Soil 52
3.18 Loading curve for Exchange of Radioiodine on Bolu-Yeniçağ soil 54 3.19 Freundlich Isotherms for Adsorption of Radioiodine on Bolu-
Yeniçağ Soil.Initial Iodine Concentration 1 x I0~'^mmol/ml <
[ /“ ]° < 1 X I0~^mmollrnl 56
3.20 The Dubinin-Radushkevich Isotherm for Adsorption of Radioio dine on Bolu-Yeniçağ Soil. Initial Iodine Concentration 1 x
I0~^mmolfml < [ /“]° < 1 x 10~^mrnol/ml 57 3.21 The Site Di.stribution on Bolu-Yeniçağ Soil, Considering Cl~ as
3.22 Loading Curves for sorption of radioiodine on Chlorite-Illite Chiy
Mixture 64
3.23 Loading Curves for sorption of radioiodine on B entonite... 65
3.24 Loading Curves for sorption of radioiodine on Kaolinite 65
3.25 Loading Curves for sorption of radioiodine on A lu m in a ... 66 3.26 Freundlich Isotherms for Sorption of Radioiodine on
Chlorite-Illite Clay Mixture 67
3.27 Freundlich Isotherms for Sorption of Radioiodine on Bentonite 67
3.28 Freundlich Isotherms for Sorption of Radioiodine on Kaolinite . 68
3.29 Freundlich Isotherms for Sorption of Radioiodine on Alumina . . 68
3.30 Dubinin-Radushkevich Isotherms for sorption of Radioiodine on
Chlorite-Illite Clay Mixture 69
3.31 Dubinin-Radushkevich Isotherms for soiption of Radioiodine on
Bentonite 69
3.32 Dubinin-Raduslikevicli isotherms for sorption of Radio iodine on Kciolinite... 70 3.33 Dubinin-Radushkevich Isotherms for sorption of Radio iodine
on A lu m in a ... 70
LIST OF FIGURES x
3.34 The Site Distribution on Chlorite-Illite, for the adsorption of
iodine, Considering Cl~ as Competing Ion 73
3.35 The Site Distribution on Bentonite, for the adsorption of iodine.
Considering Cl~ as Competing Ion 74
3.36 The Site Distribution on Kaolinite, for the adsorption of iodine.
Considering Cl~ as Competing Ion 74
3.37 The Site Distribution on Alumina for the adsorption of iodine.
L ist o f T ables
1.1 Some Methods Used For The Disposal of Radioactive Waste 2
1.2 Radioactive Waste C a te g o rie s ... 3 1.3 The Chemical Forms of Radioiodine in Trench, Well and Spring
Waters Around a Low-Level Waste Disposal 9
1.4 Risk of Cancer Mortality for Some Radionuclides in Radioactive W a s te s ... 10 1.5 Alumina T y p e s ... 19 1.6 Climate Classification of S o i l s ... 20
1.7 Categories of Adsorption Proce.ss 23
1.3 Experimental Results in Literature for Adsorption of Radioio
dine on Soil S a m p le s ... 29 1.9 Experimental Results in Literature for Adsorption of Radioio
dine on Chlorite, Illite, Chlorite-Illite mixture, Bentonite and A lu m in a ... 30 1.10 Experimental Results in Literature for Adsorption of Radioio
dine on Soil and Bentonite Pretreated with Inorganic Complex- ing Agents (HETMA·*·.· Hexadecyl Trimethyl Amonium ion,
HDPY+:Hexadecyl Pyridinium ion, BE+:Benzethonium ion.) . . 30
2.1 Composition of the Synthetic Groundwater Used 33
2.2 Composition of the Stock Solutions Used 33
3.1 Results of Chemical Analysis of Bolu-Yeniçağ Soil 44
LIST OF TABLES XU 3.2 3.3 3.4 3.5 3.6
Concentration of some trace elements in Bolu-Yeniçag Soil 45
The Results of Kinetic Experiment for Bolu-Yeniçag Soil 46
The Experimental Results Showing the Change of Distribution
Ratio with V/m for Bolu-Yeniçag Soil 48
The Experimental Results Showing the Effect of pH on Distri bution R,atio for the sorption of radioiodine on Bolu-Yeniçag Soil 51 Sorption, Desorption and Exchange Distribution Ratios and per centages of Adsorption(%/4), Desorption (%D), Reversibility
{%R) and Exchange (%E'),for adsorption of radioiodine on Bolu-
Yeniçag Soil 55
3.7
3.8
The Constants Found from Fitting the Sorption and Exchange Data to Freundlich cind Dubinin-Radushkevich Isotherms for the Adsorption of Iodine on Bolu-Yeniçağ Soil
The The Theoretical Ru values Obtained From The Isotherm Constants, for Bolu-Yeniçağ soil. Rd,(cxp.)· Experimental Rd,
Rd,{D-R.)'· obtained from Dubinin-Radushkevich Isotherm,
Rd,(Fru.y· Rd obtained from Freundlich I s o th e r m ...
57
59 3.9 Effect of Sterilization on Sorption of Iodine on Bolu-Yeniçag Soil 62 3.10 Experimental and Theoretical Rd Values for the Adsorption of
Radioiodine on Clay Minerals. Rd,{exp.)· Experimentally ob tained Rd values, Rd,(D-R)'· Rd Calculated from Dubinin-Radushkevich
Isotherm, Rd,{Fru.)· Rd Calculated from Freundlich Isotherm 71
3.11 The Constants Found From Fitting the Sorption Data to Isotherm
Models for Clay Minerals 72
3.12 Adsorption Energies Calculated from the Dubinin-Radushkevich
Isotherm Constant К {E = for the Minerals 72
3.13 The Parameters Used to Calculate tlie Site Distribution Func tions of Minerals and the Affinities Found from These Parame ters for the Adsorption of Iodine on Clay M inerals... 75 3.14 Rd Values for the Sorption of Radioiodine on Clay Mineral Sam
LIST OF TABLES Xlll
4.1 Comparison of Distribution Ratios witli the Number of OIT
C h ap ter 1
IN T R O D U C T IO N
1.0.1
R a d io a c tiv e W a ste M a n a g em en t
Usage of radionuclides in nuclear power plants, reprocessing of spent fuel, medical applications and research fields in ever increasing quantity , leads to the problem of riidioactive waste which is potentially hannful to man and to the environment. Tliey rcinge in activity from near natural background as those used in radio-medicine, to very high activity from nuclea.r reactor fuel wastes[l].
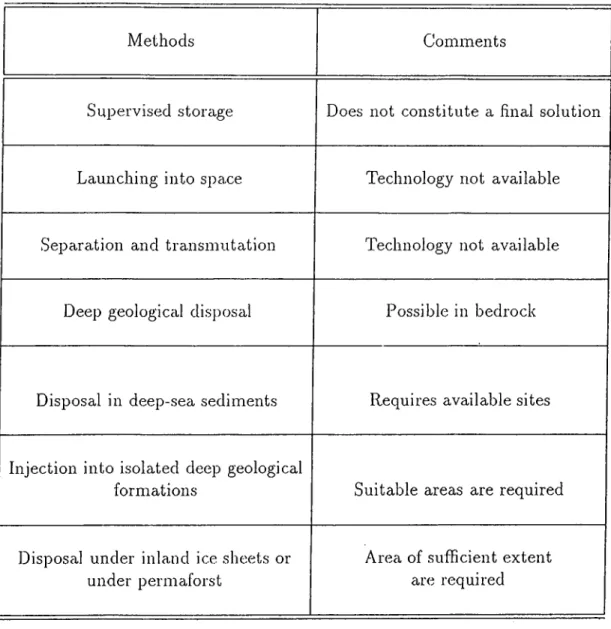
Internationally different conceptual methods for the dis])osal of radioactive wastes has been pro])osed . Some of these methods with comments on their feasibility are givoni in Table-1.1 [2].
Underground disposal seems to be the most prorferred way of mcinagement of the radioactive wastes, because of both economical and technological points of view. The most important consideration is the safety of the environment. In this sense nuclear wastes are charachtai'ized into five categories by International Atomic Energy Agency (Table-1.2) [3].
The high-level wastes (spent fuel and high-level liquid wastes)may be stored for a suitable period to allow shorter lived radioactivity to decay . Then they can be encapsulated in nretals or ceramic.The liquid wciste must be immobilized by conversion to solid. The adequate heat dissipation must also be considered to prevent unacce]-)tably high tenqu'ratnres.
CHAPTER 1. INTRODUCTION
Methods Comments
Supervised storage Does not constitute a final solution
Launching into space Technology not available
Separation and transmutation Technology not available
Deep geological disposal Possible in bedrock
Disposal in deep-sea sediments Requires available sites
Injection into isolated deep geological
formations Suitable areas are required
Disposal under inland ice sheets or under permaforst
Area of sufficient extent are required
CHAPTER 1. INTRODUCTION
Waste Category Imp 0rtan t Features
High-level Long-lived
High beta/gam m a S igni fi Ccuit al i^h a High radio toxicity High heat output Intermediate-level
Long-lived
Intermediate l)eta/gamma Significant alpha
Intermediate radiotoxicity Low heat output
Low-level Long-lived
Low beta/gam m a Significant al]:)ha
Low/Intermediate radiotoxicity IiLsignihcant heat output
Low-level Short-lived
Low Ireta/gamma Insignificant alpha
In termed! ate radiotoxi ci ty Low heat out])ut
Low-level Short-lived
Lo w 1) e t a/gam m a In sign! fi can t a.l j) h a Low radiotoxicity Insignificant heat output
CHAPTER I. INTRODUCTION
The intermediate level, long-lived radioactive wastes result from spent fuel elements, the cladding hulls, the associaXed hardware and the insoluble dis solver residues. For their disposal the undissolved fuel, the associated fis sion product and the actinide radioactivity sources must be removed from the cladding halls. The meclumical compaction of spent fuel, incorporation in ce ment or metal or placement in cement ca.nnisters must also be done.Concrete, polymers and bitumen are also used lor immobilization of this type of waste.
The gaseous wastes are also included in this category. The most important ones are: ®®Kr, and ^"‘C. ^®Kr sliould l)e compressed in metal gas bottles or incorporated in a numl.)er of metals and other solid materials. It can also be removed and concentrated, then isolated for about 100 years, to decay to acceptable levels before releasing to the enviroument. The wa.ys of immobiliza
tion of over a long period is being studied. A detailed review of the works
done and the importance of radioiodine is given in the next section. For ^'*C marine dilution is an alternative. Ways of iinmol)ilization of this radionuclide is also being studied. Contaminated soil also ap])ecirs in this category. For their disposal, incorpora,tion in cement or bitumen or ])la.stic resins or sealing with a.n adherent coating must be done.
The gaseous wastes and contaminated soil appear also in short-lived low and intermediate level wastes. Tlieir trea,tm(uit is the same a.s ex])lained above.
The low level liquid wastes and the alpha, contaminated wastes with low beta/gam m a radioactivity level ai’e in the category of low-level, long-lived wastes. For low level lic[uid ^vastes, treatments such as precipitation, ion- exchange, distillation, soi|)tion, solvent extraction and liltraXion a,re used lor immobilization. The residues are immobilized and the fluids are discharged to the environment. The combustible wastes contained in alpha contaminated wastes with low beta/gam m a radioactivity level group, are oxidized to reduce volume and flammability . The resulting a.sli ma.y l)e leached to remove ¡pluto nium and residues may be conditioned and |)re|.)ared foi' disposal. These wastes
can also be added to the wiistes of previous categories (the high and interme diate, long-lived wastes). The noncombustible wastes must be decontaminated as far as possible to enable their disposal with short-lived radioactive wastes.
CHAPTER L INTRODUCTION 5
The tritium contaminated wastes are in the intermediate-level, short-lived wastes category.For a Urrge volume of waste with low concentration of tritium, the treatm ent ways consist of: dilution and direct discharge into aqueous en vironment including oceans, deep well injection a.nd hydraulic fracturing. For the more concentrated wastes with lower volume of tritium, immobilization in a packaged solid(with or without im])regnation by j.x)lymer resins, silica gel, activated alumina, hydrated Ccdcium sulphate, molecular sieves, organic
hydrogenoues compounds,metal h3'drides) and l.')urial are suggested. Another
way is their disposal in a packaged and solidified form on the ocean floor.
In summary IAEA (International Atomic Energy Agency) considers five major options for underground disposal of radioactive wastes as followings[4]:
1) Disposal in .shallow ground 2) Disposal in rock cavities
3) Disposal in deep geological formations 4) Disposal by liquid injection
5) Disposal by hydraulic fracturing
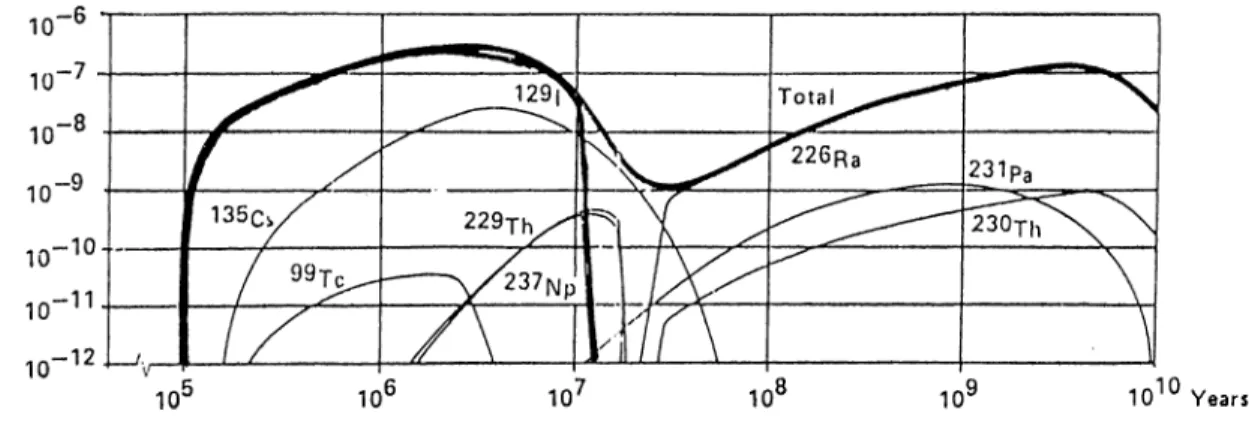
The underground dis])osal must be done in such a way that during a long period of time, the radioactive waste will remain isolated ancjxfram the envi ronment. From a long period we mean about at least 10' years which is the time for reducing the toted activity in spent fuel from 10^® bq/tonne uranium to 10^^ bq/tonne . For a better illustration, the radioactivity of heavy nuclides in spent fuel is shown in Fig. 1.1 [2].
CHAPTER 1. INTROD UCTION
Time after discharoe from reactor, years
Figure 1.1; The Radioactivity of Heavy Nuclide.s in Spent Nuclear Fuel
Although the acce.ss of water to the emplaced waste and transport from a repository are not likely in most cases, a long term safety program should model conceivable scenarios in which this access and transport of water could nevertheless occur. In this sense the following parameters are important in transport of radionuclides by ground water and/or sorption or desorption of them by backfills, clays or soils: •
• Aerobic/anaerobic conditions • Variation of Eh and pH • Grain size of clay or soil • Formation of colloids • Radionuclide concentration • The contact time
• Solubility of the elements • Temperature
• Soil organics
CHAPTER 1. INTRODUCTION
1.0.2
Io d in e
Iodine is an electronegative element with a large ionic radius of 0.22 nm. It,s oxidation states in aqueous medium are -1, 0, +1, +3, -f 5 and +7. Its most
iibundant states in the environment are -1, 0 and +5. The common forms of
iodine are 1~, ¡0^ , l O H , I O ~ , I2 and Generally iodine is present in
aqueous systems as iodide or iodate. In acidic solution, /2 and the polyiodide
ion may also become important. /2 can be stabilized in solution to some
extent by combining with I~ to form .species[7]. This anion form stable
salts with large cations such as C's"'‘[8]. Iodide can interact with solid material by complex formation.
Iodine has two important isotopes with respect to radioactive wastes. ’^^I with a half-life of ( t]/2 = I.57xl0^y ) and with a half-life of (ti/2=8.04 d). The long half-life of '■^^I and the high specific activity of pure (1.23 x 10'* ci/g), make them important contaminants of environment in the long and short terms respectively. They are produced during the operation of nuclear power plants, the reprocessing of nuclear fuel and testing of nuclear weapons[9]. *^®I is also a naturally occurring isotope of ‘^^I. The terrestrial equilibrium ratio of *^^I to *^^I is in the range of 2.2 — 3.3 x 10“ ’®[10].Iodine can transfer easily in the environment because of its volatility and concentrates in thyroid gland and tissues in human being. The biological hidf-life of iodine in the adult thy roid is about 140 days and the quantity of iodine in human thyroid is about 7 milligrams [11].
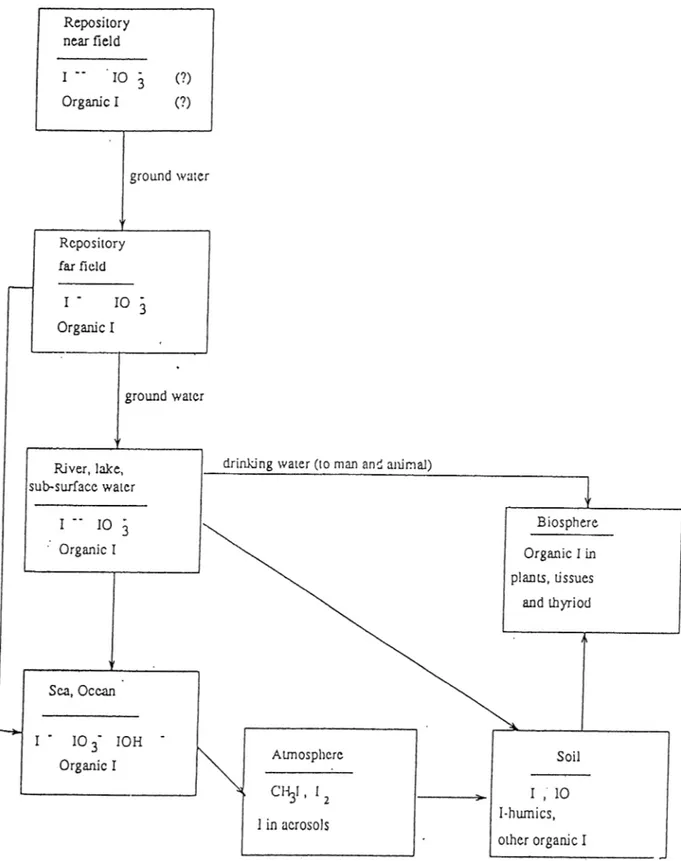
The major pathways of released *^**I migrating from a geological waste dis posal site to the biosphere has been derived, based on the migration behavior of iodine in nature and the global circulation model[lIj.This pathway is illus trated in Fig. 1.2.
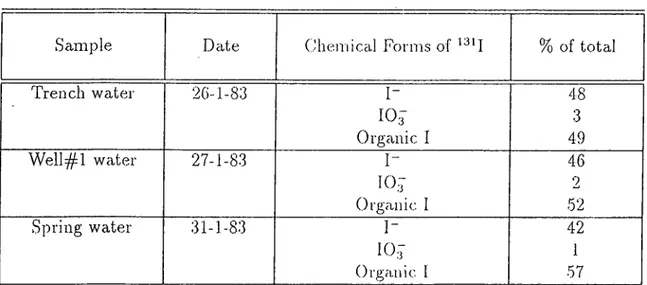
The chemical spéciation of radioiodine in trench, well and spring waters around the low-level waste disjjosal site at Battelle, have been determined by Robertson et al.[12]. The results are summarized in Table-1.3.
CHAPTER 1. INTRODUCTION
Figure 1.2: The Migration Pathway of Radioiodine from an Underground
CHAPTER 1. INTRODUCTION
Sample Dcite Ghemical Forms of % of total
Trench water 2G-1-83 I- 48 10,F 3 Organic I 49 Well^^l water 27-1-83 I- 46 10:7 2 Organic 1 52 Spring water 31-1-83 I- 42 107 1 Organic I 57
Table 1.3; The Chemical Forms of Radioiodine in Trench, Well and Spring Waters Around a Low-Level Waste Disi
Weber et al [13] and von Cunten[14] have measured the radionuclides re sulting from fallout from Chernobyl accident in the river Glatt at Switzerland and in the adjacent shallow groundwater stream. Their results show that more
than 95% of the activity is found in solution, either as soluble iodide or
possibly bound to very small colloids of diameter less than 0.05 /rm. 90% of
the is present as iodide and only 10% could be precipitated as lead iodate.
hcis a very low specific activity due to its long half-life, so it is much less toxic compared to other radioactive waste nuclides. But it survives over a long time, migrates easily in the environment and concentrates in a critical
organ.The total dose contributed by to the global population per unit of
electricity generated from a nuclear power plant is 0.005 inan-Gy per Mw per year(=0.5 rad/M w.y). This should be compared with the total dose to the global population from radionuclide release, which is 0.025 man-Gy per Mw per year(=2.5 rad/Mw.y)[15j.
The risk of cancer mortality' for children Indow 10 years ol age, upon in gestion of soluble radionuclides is assessed by Staley et al.[17j. The potential
hazard of is demonstrated in these numl)ers when compared to the other
.^The cancer risk is calculated by a = D"/C, where cr is the cancer coefRcient, D is the close to each person and C is the cancer deaths from dose D [16]
CHAPTER 1. INTRODUCTION
raclionuclides(Table-1.4).
10
Radionuclide Risk of cancer mortality
(risk//.ic.i I'cidionuclide) 2x10-'' 23sp^; 2 . 3 9 p u lxl0-<5 ■^'‘^Pu 2x10-'*
Table 1.4. R.i.sk of Cancer Mortality foi' Sonre R,aclionuclide.s in Radioactive Wa.stes
T.lie cement of the technical barrier u.sed in an underground repository is assumed to be decomposed to compacted sand after about lO** years. The radionuclides are conservatively .assumed to pass without delay from the solid phase into pore water and migrate into the geosphere. Due to the long half-life
of it will be a major contaminant alter this period. This is illusti'ated in
Fig. 1.3, which shows the doses to nearby residents in a period of 10“^ years, from a scenario A oi Swedish program lor underground disposal of radioactive waste.[18]
Years
CHAPTER 1. ¡NTROrjUCTION 11
1.0.3
C lay M in erals
Clay minei'cUs are described as aluminum or magnesium silicates with stacked layer structure. Unit layers consist of sandwiches of octahedral and tetrahedral sheets.
Octahedral sheets consist of two layers of oxygen atoms (or hydroxyl group), in a hexagonal close packed arrangement with aluminum, iron or magnesium atoms at the octahedral sites, so that they are equidistant from from six oxy gens or hydroxyls (Fig. 1.4). When aluminum is present, only two thirds of the possible positions are filled to balance the structure, which is the gibbsiie structure and has the formula Al2(OH)6. When mcignesium is present, all the positions are are filled to bakuice the structure, which is the brucite structure
and has the formula Mg3(0H)6. The normal O-to-0 distance is 2.QÀ and a
common OH-to-OH distance is .about 3/1, but in this structural unit the OH- to-OH distance is 2.94/4 and the space available for the ion in the octahedral coordination is about 0.6lA. The theoretical thickness of the distorted unit is i 5.O5A in clay mineral structures.
and = Hydroxyls Aluminums, magnesiums, etc.
Figure 1.4: Diagrammatic Sketch showing (a) A Single Octahedral Unit and (b) The Sheet Structure of the Octahedral Units.
In tetrahedral or silicate sheets, silicon atoms are surrounded by four oxygen atoms in tetrahedral arrangement. In each tetrahedron a silicon atom is
CHAPTER 1. INTRODUCTION 12
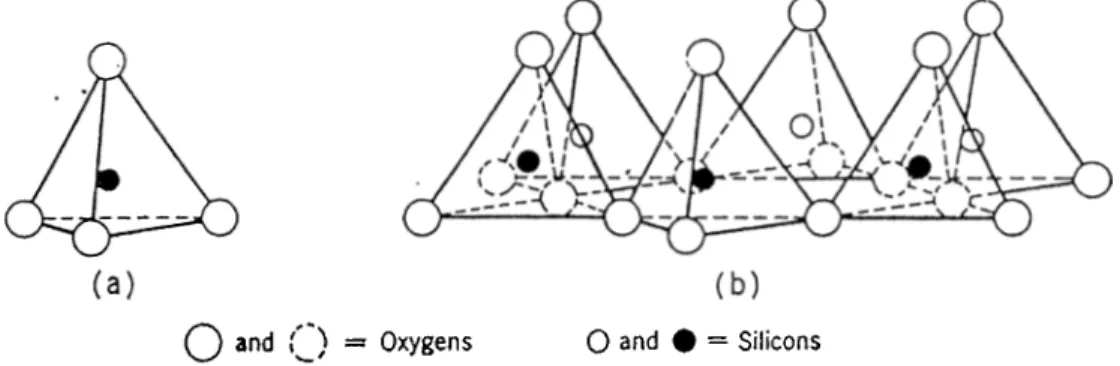
equidistant from four oxygens, or hydroxyls if needed to balance the structure, arranged in the form of a tetrahedron with a silicon atom at the center. The silica tetrahedral gi-oups are arranged to form a hexagonal network which is repeated indefmetly to form a sheet of composition Si,iOc(OH),i(Fig. 1.5).The tetrahedrons are arranged in a way that all tips of them point to the same di rection and their bases are all in the same jdane.The open hexiigonal network can be considered as composed of three strings of oxygen atoms intersecting at angles of 120*^. The 0 - 0 distance in the silica tetrahedral sheet is 2.55Aand the space available for the ion in the tetrahedral coordination is about 0.55A. The thickness of the undistorted unit is 4-.65A in clay mineral structures. Each of these units presents a center-to-center height of about 2.lA.[19]
Q and {[_) == Oxygens O and # = Silicons
Figure 1.5: Diagrammatic Sketch showing (a) A Single Silica Tetrahedron and (b) The Sheet Structure of the Tetrahedrons Arranged in a Hexagonal Network.
The analogous symmetry and the cilmost identical dimensions in the tetra hedral and the octahedral sheets , allow the sharing of oxygen atoms between these sheets. The fourth oxygen atom protruding from the tetrahedral sheet is shared by the octahedral sheet. This sharing of atoms may occur between one silica and one aluminum sheet, as in the case|0f so called 1:1 layer minerals. In the 2:1 laj'er minerals, one alumina sheet shares oxygen atoms with two silica sheets, one on each side. The combination of an octahedra.1 sheet and one or two tetrahedral sheets is called a layer. K4ost clay minerals are consisted ol such layers which are stacked parallel to each other.
There exists a certain unit in each layer which repeats itself in a lateral direction and referred to as unit ce.ll. The total assembly of a layer plus
inter-CH A PTER 1. INTROD UCTION 13
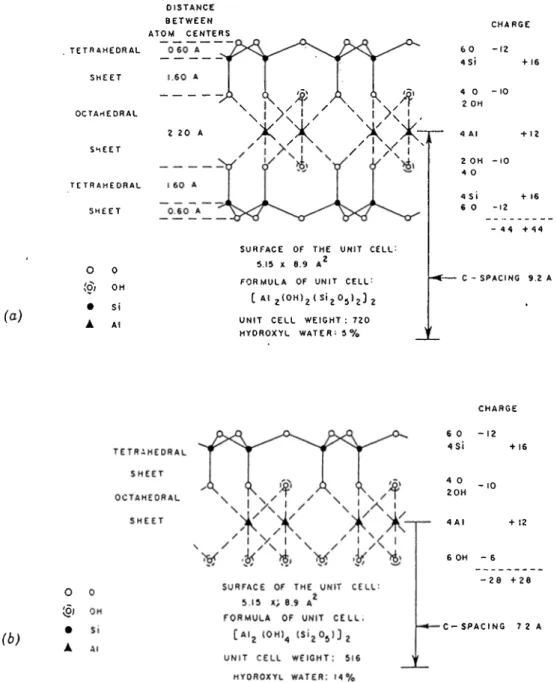
layer material is also referred to as a xinit strxicture . An schematic represen tation of the atom arrangement in a unit cell for 1:1 (T -0) and 1:2 (T-O-T) layers are shown in Fig. 1.6.
(a) DISTANCE BETWEEN ATOM CENTERS TETRAHEDRAL SHEET OCTAHEDRAL SHEET TETRAHEDRAL SHEET O 0 i â i OH • si À Al
-A^ \
A.
2 2 0 AX i X I
\ i X 1 .
A A A AI X I
SURFACE OF THE UNIT CELL: 5.15 X 8.9 A^
FORMULA OF UNIT CELL: [ Al 2 < 0 ^ )e^ ^ ‘ 2 ^ 5 * 2 ^ 2 UNIT CELL WEIGHT : 72 0
HYDROXYL w a t e r: 5 %
J
l CHARGE GO -12 4S i + 1 6 4 0 - 10 2 OH 2 OH - 10 4 0 4 S I + 1 6 6 0 -12 - 4 4 + 4 4 C - SPACING 9.2 A (b) ▲ CHARGE 60 - 12 4 S i + 16 4 0 2 0 H 6 OH - 6 - 2 0 + 2 0 - C - SP ACING 7 2 AFigure 19. Alom arrangemcnl in ihc unit cell of a 1:1 layer mineral (schematic).
Figure 1.6: Schematic Representation of The Atom Arrangement in Unit cells of (a) A 2:1 Layer Mineral (1)) A 1:1 Layer Mineral
CHAPTER 1. INTRODUCTION 14
The interlayer consists of layers of water and/or interlayers or surface of cations (to compensate the negative charge ). These cations may be exchange able and interlayer water may be absorbed by a dry clay causing it to swell.
Two main clay groups are kaolinite and montmorillonite groups which have 1:1
and 1:2 layer structures. Their structure s will be discussed in the following parts.
Kaolinite:
Kaolinite has a two layer structure with one gibbsite and one silica sheet. The conventional formula for kaolinite AUSi.\0\o{0H)^ is clearly a condensa tion of the layer arrangement described. In the layer common to the octahedral and tetrahedral groups , two-thirds of the atoms are shared by the silicon and aluminum and then they become 0 instead of OH. Only two-thirds of the possi ble positions for aluminum in the octahedral sheet are filled and there are three possible plans of regular population of the octahedral layer with aluminums. The aluminum atoms are considered to be so jdaced that two aluminums are separated by an OH above and below, thus making a hexagonal distribution in a single plane in the center of the octahedral sheet. The OH groujxs are placed so that each OH is directly below the perforation of the hexagonal net of oxygens in the tetrahedral sheet (Fig. 1.7).
CHAPTER 1. INTRODUCTION 15
The main clifFerence between various species is in layer stacking geometry. Members of the kaolinite group are kaolinite, dickite, nacrite and halloysite. In water these minera.ls are not ex|)a.ndable. d'lie cohesive energy in kaolinites is primarily electrostatic, augmente(.l l:)y van der VVa.als attraction and a certain degree of hydrogen bonding between the hydro.xyl groups of one layer and the oxygen atoms of the adjoining layer.
B c n l o n i U :
Bentonite is a rock term and the clay mineral montmorillonite is the dom inant mineral which determines the i)ro].>erties of a bentonite. Therefore it is necessciry to understand the com|)osition and structure of montmorillonite. Montmorillonite is a fine particle size hydrous aluminum silicate and is one of the three layer minerals. The three layers are as followings:
1) A silicate tetrahedral layer with each silica tetrahedron composed of a
silicon atom surrounded by foui· oxygen atoms.
2) An aluminum (iron, nia.gnesium,etc.) octahedral layer made up of
octahedrons that has an aluminum (iron, mci,gnesium,etc.) surrounded by six hydroxyl atoms.
3) The same as laju^r 1.
Aluminum can replace silicon in tetrahedron and magnesium , iron, zinc and other ions can replace the aluminum in the octahedral units. Wlien ions replace Si'^^ ions in the tetr-ahedron, this is the substitution of a trivalant for a c[uadrivalent ion and leaves a. charge deficiency in the tetraliedral layer.
To satisfy this tetra.hedral charge deficiency, cations such as N cC,
and//·*· are commonly held in the interlayer ].)osition.(Fig. 1.8).
Substitution of divalent ions for trivalant aluminum in the octahedral layer results in a weaker surface charge Irccause of the increased distance from the charge center to the surface. Idieieforc although the cations are held in the interlayer positions, the attrciction is much weakei'.
Som e b e n to n ite s swell m any tim es th e ir original dry volum e w hen placed in w ater. S odium b e n to n ite s swell 10 to 20 tim es w hereas calcium b e n to n ite s
CHAPTER 1. INTRODUCTION 16 9·0-2 ^ 4 A c - Axis nH, 0
A
^ PA A A'
/ \ I \ / \ N/ ' V * y' V · ✓ \ ! / ' ^ I .'T'^ y i \ / 1 s / I '' / I /\ ' 4 0—
o A x y O D X r
4 SI 6 0 b -Axis-Figure 1.8: Schematic Representation of The Structure of Montmorillonite
swell only 2 to 5 times their origin<il volume. This is related to the location of charge (tetrahedral or octahedral ) and to the type of cation in the interlayer position. Bentonites have a relatively high surface area (50 to 80 nr^/g) when compared to most of other natural materials. Sodium bentonites generally have a higher surface area than calcium bentonites[20]. The formula of bentonite is : N ao,Q7{Ali/xiMgo,Q7)lS'i&02o{0li)^]. I t’s density has been reported as 2.5
g/cm^ and for natural bentonites as 2.7-2.8 g/cm^.
C h l o r i t e s :
Chlorites are clay minerals which cire structurally related to 2:1 layer clays. In these minerals the charge compensating cations between montmorillonite type clays are replaced by an octahedral mcagnesium hydroxide sheet, formally
called brucite sheet. Owing to some re])lacement of by AH'^ in the
hydroxide sheet , this sheet carries a net positive charge. Since the cation ex- 'change capacities of chlorites are very low, the imsitive charge, of the hydroxide,
CHAPTER 1. INTRODUCTION 17
Krauskopf rel’ei's chlorites and illites as mixed-layer cla.3's. The chlorite min eral is considered as reguku· alternation of mica and brucite layers and illite as
a repetition of mica and montmorillonite [21]. In chlorites the mica and brucite
layers are continuous in a and b dimensions and are stacked in c direction with basal cleavage between the layers. The mica· like layers are trioctahedral with general composition of { O A l ) s { M g , Fe)a02o· 2'he brucite like layer has the general composition of (fl'/y, Al)i]{OH)\2. The mica layer is unbalanced by
substitution of AD^ for and this deficiency of charge is balanced by an
excess charge in the brucite sheet as a conseciuence of substitution AD^ for The diagrammatic sketch of the structure of chlorites is illustrated in Fig. 1.9. The formula of chlorites is: {Mg, Fe)6{S'i, Al)s02o{OH)4
Figure 1.9: The Diagrammatic Sketch of The Structure of Chlorites
Illites:
Clays which have a deficiency of positive charge due largely to substitu tion in the tetrahedral sheets,(hence close to’ the surkice of the layers) held 'the K'^ especially tightly , so that only ])art of it is replaceable by other ions.
These clays with successive layers held together by ions , have properties
CHAPTER 1. INTRODUCTION 18
hydromica). The illite structure is similar to muscovite , in which the amount
of is greater and bears a constant relation to the amounts of Si and Al.
The difference in structure between montmorillonite, illite. and muscovite , may be symbolized by the ideal formulas:
montmorillonite illite Muscovite A U S is CM O H ), K0-2AU (Sio-^A Io-'2)02o{0 H), K^AU{Sto,Ah)02o{OH),
The basal spacing of illites is about lOAwhich is the same as that of mont- morillonites with ])otassium ions as exchange ions in the dry state. The total net negative layer charge which results from the substitution and therefore the amount of compensating /\'+ ions is usually larger than for most montmo- rillonites.Since only the external cations of illite clays are exchangeable, the cation exchange capacity of illites is smaller than that of montmorillonites de spite the higher degree of isomorphous lattice .substitution in the illites(Fig.
1.10). 10-0 A c-Axis yK 6 o 4-y Si -yAi s I j ^ I / \ / s I y 1 z'' X X . AU.Fe,.Mg,.Mg, V I I II ^ \ / 1 ^ X j
c»’Y) t)" o' Y; 2(
oh)+4
o b-Axis ■ yKCHAPTER 1. INTROD UCTION 19
Alumina:
Alumina is not ci clay mineral but it is a constituent of clay minerals. It occurs in crystalline foi'in as corundum a.ml the less ])ure emery. It also occurs hydrated as bauxite , diaspore and gibbsite. Alumina itself has two forms a
and 7-Alumina. cr-Alumina has a trigonal crystalline form. It is strictly the
high tem perature form but does not change to 7-Alumina at low temperatures.
7-Alumina is produced by controlled low temperci.ture dehydration of hydrates
at temperatures up to Soot'd. On strong heating it is converted reversibly to o- form at 1150-1200'^'0. Its c.rysta.lline fonii is hexaguna.1. /f-Alumina is sodium aluminate with a composition of Adi-iO. 11.4/2O3 or N a2 0. l2Al203. Alumina
types are listed in Table-1.5[22].
Formula AI2O3 AI2O3.H2O AI2O3.H2O AI2O3.SPI2O N ame Cor u n d u m (cv- A1 u mi n a) Bohemite Diaspore Gibbsite
Table 1.5: Alumina Types
1.0.4
S oils
Classification of soils is rather diflicult since they differ in so many wa.ys such as: grain size, composition, plasticity, mechanical strength, color, fertility, permiability, pareirt material and nature of profde. An easy classification based
primarily on the climate factors of soil development is considered here[21]. The
soils can be divided to humid and arid region soils. The humid region soils are characterized by a concentrcition of iron oxide and aluminum silicates in B- horizon and these soils are accordingly often referred to as pedalfer soils. Soils of arid regions show concentration of calcium salts and are designated as pe-
docal soils. Zonal humid or pedalfcr soils are further subdivided according to
temperature and the zonal aridic soils due to degree of aridity. The classifica tion is shown in Table-1.6.
CHAPTER 1. INTRODUCTION 20
Average R,aiiifall incli/3^ear
Soil Type Classification
Over 25 Pedalfer Laterite(tropics)
Podzol (temperature Zone) Tujidra (arctic Zone)
Less than 25 12-25 10-15 less thcin 10 Pedocal Chernozem Chestnut-Brown Desert and Saline
Table 1.6: Climate Ckissilication of Soils
The most widespread of the zonal humid soils cire p o d z o l s and their rel
atives, soils typical of the humid parts of the temperature zones. The word
p o d z o l v e i e v s to forest soils in the northern part of the temperature zone. Abun
dant vegetation makes the soil WcTer acid , pH values rea.ching 4 to 4.5 in the clayey part of the soil cind 3.5 in the humus. The clay in p o d z o l s is typically
kaolinite as would be expected from the acid environment and the depletion of lime and magnesia. The color of A horizon of p o d z o l is gray-white.
L a t e r i t e is a very different kind of soil formed in humid tropics. The chief
characteristics are a red color, enrichment of iron oxide and aluminum oxide through the profile , a depletion in silica, and removal of most of the alkaline and alkaline eartli ions. L a l c r U c . has a. red color.
North of forested area of p o d z o l are the tree-less plains of Arctic,the t u n d r a
which gives its name to the typical cold humid soils. Such soils have a great abundance of orga.nic m atter Irecause tlie cold climate slows decay. The clay mineral content of t u n d r a soils is frecpiently rather low.
Zonal aridic soils are cliaracterized Iry concentration of calcium salts in the profile. C h e r n o z e m or black earth is a soil colored lilack by an abundance of
organic m atter and having an ill-defined zone of lime enrichment at depth. It is the best of all agriculturcd soils because of its content of organic m atter and
CHAPTER 1. INTRODUCTION 21
unleached cations. With increasing dryness, tlie soil liecomes thinner and light colored. Varieties are often designated b}' color terms such as chestnut and
red-brown. When dryness is extreme, the soil irray retain very soluble salts
.such as sodium chloride and is accordingly descrilnid as a saline soil.
1.0.5
S oil O rganic M at te r (SO M )
Soil organic m atter is defined l.)y Ma.yes and Swift as following: “ The complete soil organic fraction is made up of live organisms and their undecom posed, partly decomposed and completely transformed remains ”. SOM is the term u.sed to refer more s])ecifically to the non-living components which are a heterogenoues mixture comjrosed la.rgely of products resulting from micro bial and chemical transformations of organic debries. These transformations known collectively cis the humification process, give rise to humus, a mixture of substances which have a degree of resistance to further microbial attack [23].
SOM is usually subdivided into non-humic a.nd humic substances. Non- humic substances include those with still recognizable chemical characteristics such as: carbohydrates, proteins, peptides, pyridimines, fatty acids , waxes, resins , pigments and other low molecular weight orgiinic substances. In gen eral all these compounds are relatively easily degraded in soils and have short life spans.
Humic substances are amorphous, dark-colored, partly aromatic, mainly hydrophilic, chemically complex, polyelectrolyte-like materials which range in molecular weight from a few hundred to several thousands and are more resis tant to biological degradation[24, 25].
Humic substances are defined operationally by their .solubilities. Fulvic acids are the fraction which are soluble at all pH values and humic acids are soluble above a pH range of approximately 3.5 and humin is the fraction insol uble at all iHi values [26].
CHAPTER 1. INTRODUCTION 22
1.0.6
T h e S o rp tio n P ro c ess
Sorption reactions are referred to interactions among all phases present in a subsurface system and at the interfaces between these phases. Solutes which undergo sorption are commonly termed sórbales, the sorbing phase, the sorbent and the primary phase from which the sorption occurs, the solution or solvent.
Sorption results from a variety of different types of attractive forces between solute, solvent and sorbent molecules. Such forces usually act together, but one type or another is more significant than others in any particular situation.
There are two broad categories of sorjrtion, adsorption and absorption. They can be differentiated by the degree to whicli the sórbate molecule interacts with and is free to migrate between the sorbent phase. In adsorption solute accu mulation is generally restricted to a surface or interface between the solution and adsorbent. In contrast absorption is a process in which solute is trans ferred from one phase to another, interpenetrates the sorbent phase by at least several nanometers.
Adsorption processes .such as dissolvition of a relatively immiscible phase into an aqueous phase or accumulation of a lipoi:)hilic substance in an organic phase, involve exchange of molecular environments. So the energy of an indi vidual molecule is altered bj^ its interactions with solvent and sorbent phases. Its distribution between phases results from its relative affinity for each phase, which in turn relates to the nature of the foix.es which exist between molecules of the sórbate and those of solvent and sorbent phases. So these forces are rather similar to those which arise in chemical reactions. Adsorption also involves intermolecular forces but in this case it is for the molecules at the surface of the sorbent rather than bulk phase molecules. Adsorption can be categorized into three classes according to tlie class of attraction force which predominates. Some features of these classifications cire summarized in Table-7.
CHAPTER 1. INTRODUCTION 23
Category Forces Involved Characteristics Example
P h y s i c a l non-specific attraction -pH Dependant sorption of tri and a d s o r p t i o n forces involving the -rapid tetravalent actinide
entire electron shells -reversible complexes on metal
of radioelement and -temperature independent oxide surfaces near
adsorbing substrate -independent of composition
of the sorbent -independent of ionic
strength and composition of the solution -influenced by complexing agents -characteristic energy 4.2-8.4 kJ/mol natural pH
E l e c t r o s t a t i c coiilombic forces -raj) id -ion exchange a d s o r p t i o n of attraction between -largely reversible -adsorption of Cs+
charged solute species and the adsorbing substrate
-temperature dependant -strongly dependant on
the composition of the sorbent
-strongly dependant on ionic strength
-strongly dependant on the composition of the solution
-characteristic energy 8-16 kJ/mol
on clays
C h e m i c a l Specific chemical forces -slow Interaction of Am s u b s t i t u t i o n involving chemical -partly reversible with surfaces of
bonding -highly solute selective
-temperature dependant -highly dependant on
composition of the sorbent -highly dependant on the
concentration of solute -characteristic energy
100-500 kJ/mol
phosphate minerals
СНАР Т Е Я 1. INTROD UCTION 24
1.0.7
T h e Rf/ C on cep t
The disti'ibuiioo coefficient is a ma.ci'oscopic expression of the various pro cesses involved simultaneously in the distribution of elements between solid and liquid phases. It represents the ratio of the concentration in the solid phase over the concentration in the liquid phase for a given element C:
Я,/ = (1.1)
The unit of Rd is ml/g since the units of [6’]^ and [6’]/ are g/g solid and
g/ml of solution respectively.
Since the physico-chemical properties of the elements will not change for all isotopes of an element (stable or radioactive), in a discussion of sorption behavior, R^i can be expressed for any specific isotope of an element or even simply for that element. It can be determined experimentally and can be used to calculate the retardation in trans])ort processes. It must be noticed that measured sorption characteristics for a trace elemejit are related to a large number of chemical and physical ])arameters such as composition of the solid and liquid phases , temperature, contact time, colloid formation and presence of organic macromolecules. Composition of the liquid phase is referred to the radionuclide concentration, concentration of other anions and cations, pH and redox potential. I'Vom composition of the solid pliase we mean the chemistry and mineralogy of the solid phase, its surface properties , crystallinity, surface to volume ratio, etc.
Generally the distribution ratio increases with the contact time since new surfaces become available for sorption in the solid phase as the dissolved com ponents penetrate into pores and microfissures. Distribution ratios determined experimentally constitute the sum of all contributions from different sorption processes and therefore not element s])ecific quantities. However laboratory
experiments under simulated natura.1 conditions , have, given acceptable agree
CHAPTER 1. INTRODUCTION 25
available.
1.0.8
Iso th e r m M o d els
Models for characterizing the equilibrium distribution of a solute among the phases and interfaces of an environmental sj'stem, typicall}' relate the amount of solute, sorbed per unit of soi ljing phase or interface to the amount of solute remained in the solvent phase. An ex]:)ression of this tyjje, evaluated at a fixed system tempera.ture is termed as a soiyiion isotherm. To obtain an isotherm, usually all the conditions are kept constant and the only changing parame ter is the aqueous concentration of the trace element of interest. The most frequently used isotherm relationships are Langmuir., Fruendlich and Dubinin-
Radushkevich models.
1) Langmuir Isotherm
This model was developed originally for the adsorption of gas molecules onto the surface of homogenoues solids and systems which leads to deposition of a single hiyer of solute molecules on the surface of a sorbent. This model is predicted on the assumptions that the energy of sor])tion for each molecule is the same and independent of surface covei'cige and that the sorption occurs only on localized sites and involves no interactions between .sorbed molecules. The Langmuir equation can be written as :
A" = bX,nC
1 + bC (1.2)
Where:
X : Amount of solute adsorbed per unit mass of solid (g/g)
Maximum amount of solute which can be sorbed by the solid (g/g) Eqnililu'iiim solutes roiKU'ntral.ion of sorbaXe (g/ml)
Constant related to the energy of adsorption (ml/g)
C b
This relationship l^ecomes linear at very low sórbate concentrations. The equation can be written also as;
CHAPTER 1. INTRODUCTI.ON 26
Y - V - 1 X y \ -- 7;i X
c
(1.3)Then by plotting X vensus X / C , b can be found from the .slope as 1/6 and X,n from the intercept. R,i (defined as X / C , can lie computed for any C value over the range in which the relationship holds;
6.Y,
1 + hC (1.4)
Langmuir isotherm is not good in describing the cictual adsorption on heteroge- noues soils and sediments. Nevertheless there are some cases that it successfully
descril)es such as trace adsorption naturcil substrates[27]. ·
2)Fruendlich Isotherm
The Fruendlich model is perhaps the most widely used non-linear sorption equilibrium model. The model hcis the genercil form of:
A" = KCiN (1.5)
Where:
X rAmount of solute adsorbed per unit mass of solid (g/g)
C : Equilibrium solute concentration of sórbate (g/ml)
K, N : Positive valued empirical parameters with 0 < < 1
The parameter K is related to sorption capacity and N to the sorption intensity. The logarithmic form of this equation is generally used to determine these coefficients:
CHAPTER 1. INTROD UCTION 27
S ) D u b i n i n - R a d u s h k e v i c h i s o t h e r m
Dubinin-Radushkevich isotlierm was deveioj^ed to model cidsor])tion of trace aqueous constituents and it is more general than Langmuir model since it does not require homogeiioues adsorption sites or constant adsorption potential. The Dubinin-Radushkevich equation is given as following:
X = AL„e-KE'^
(1.7)
Where:
X :Amount of solute absorbed per unit weight of solid (mmol/g)
Xm :Sorption capacity of adsorbent per unit weight(mmol/g)
E :Polanyi potential= R T l n { \ -f 1/C ) (.J/mol)
C :Equilibrium solute solution concentration (mmol/ml)
R :Gas constant (.J/K.mol)
T :Temperature (K)
K rConstant related to the sorption energy (mol^/KJ^)
The linearized Dul.unin-R.adushkevich equation is:
I n X = l n X , n - K E ' ^ (1.8)
A plot of I n X versus allows the estimation of InXm «ns the intercept
and —K as the slope.
Assuming a very snuill subregion of sorption surface to be uniform in struc ture and energetically homogenoues and by applying the Langmuir isotherm as a local isotherm, the mean energy of sorption can be calculated from Dubinin- Radushkevich parameters. The mecui energy of sorption is the free energy change when one mole of ion is transferred to the surface of the solid from the infinity in the solution. The magnitude of E can indicate the type of sorption
occurring. It can be calculated from the following relation[28]:
CH A PTER 1. INTROD UCTION 28
1.0.9
P r e v io u s W ork
Many investigations have been previously clone experiments on the sorption behavior of radioiodine on different matrixes.
Using colorimetric methods, VVhitliead have found that soil organic m at
ter are the major sorbents of iodide above pH=6 and below that pH, fer
ric and aluminum oxides are the most effective compounds in the sorption process. He has also related the sorption capacity of soil to the dryness of the soil, the equilibrium time, pH of the soil and tem perature.[29] He has re ported that iodine could not be cidsorbed by kaolinite, montmorillonite, chalk or limestone[30j.According to Torstenfelt, who has used bentonite in diffusion experiments, iodine diffuses in bentonite by two different mechanisms and has related this phenomena to diiferent species of iodine in the form of 1“ and HIO or IO3 and the porc-sixe eirects in the da.y[31]. .Shc|)pard and Thilbault [32] have stated that the orgcuiic soils had higher K,; values for iodine adsorption than the mineral soils. They also emphasized on the effect of soil/solution ratio and the concentration of pore water as well as the presence and concentration of cations.
Rançon has used four methods (batch and column methods as laboratory processes, lysimetry and direct field experiments), to study the behavior of radioiodine in soils and he concluded that the sorption pi'operties of the alu minum silicates are not sufficient to ensure iodine containmennt. From batch and column experiments he has found that some lead and copper minerals could inhibit iodine migration. He cilso concludes that the iodine behaviour in the soil is very different whether it is ])resent in trace amounts or in higher concentrations. [33]
Beherens found that in fj-esh surface waters most of the organic radioiodine compounds are soluble, while in soils most of the radioiodine is associated with insoluble organic substances. He suggested that tlie organic complexation reactions occuring, involve exteracellular oxidation of iodine with subsequent incorporation of elemental iodine into organic compounds.Christiansen and
CHAPTER 1. INTRODUCTION 29
Carlsen have studied the enzynuitically coiitiolled iodiiiation reactions in the terresterial environment and in the presence of enzynies of peroxidase group and hydrogen peroxide, they were able to iodinate humic acids with either iodide or elemental iodine [34].The effect of soil organics and biomass and some ■inorganic complexing agents has been also studied by Bors and he showed that these species have a high effect in the adsoi-ption of radioiodine. He observed an increase in the distribution ratio by adding glucose directly to soil. Addition
of some complexiug agents such as hexadec3dpyridinium ion (HDBY"*·) and
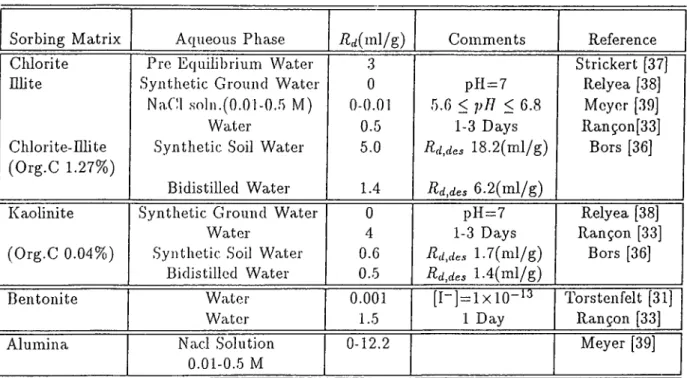
benzethoniom ion (BE"^), increased the R.,/ value several orders of ma.gnitude than those in clays[31,43-45]. The results of sojne experiments for the sorption of iodine in the literature is summarized in Tables 1.8-1.10.
Sorbing Matrix Aqueous Phase Ärf,ac/(ml/g) Comments Reference
Surface Soil 0.01 M CaCl2 0.8-53 Tracer Wildling [35]
22 types collected in Minnesota, Oregon and Washington pli 3.6-8.9
Solution
Cadarache Soil Water 1.3 After 1 Day Rançon [33]
(Eq. pH 7.6) 1.3 After 2 Days
Grain Size<0.1 min (Tracer )
Chernozem Synthetic Soil Water 250 Tracer Bors [36]
(Clay Silt Soil) Grain Size < 2mm pH 7.5
Bidistilled Water 135
Podzol Syntlieti.c soil Water 80 Tracer Bors [36]
(Humus Sandy Soil)
Grain Size<2mm Bidistilled Water 47
pH 6.5
Table 1.8: Experimental Results in Literature for Adsorption of Radioiodine on Soil Scunples