DOI: 10.17233/se.14138 Date Submitted: 05.10.2014
2015, Vol. 23(24), 143-162
Which Group of Individuals are subjected to Get Long-Term
Unemployed During and After a Recession? Evidence from
Turkey
1Hacı Mehmet TAŞÇI, Department of Economics, Faculty of Economics and Administrative Sciences, Erciyes
University, Turkey; e-mail: [email protected]
Ali Rıza ÖZDEMİR, Department of Public Finance, Faculty of Economics and Administrative Sciences, Gazi
University, Turkey; e-mail: [email protected]
Burak DARICI, Department of Economics, Faculty of Economics and Administrative Sciences, Balikesir
University, Turkey; e-mail: [email protected]
Bir Resesyon Süreci ve Sonrasında Uzun Dönem İşsizliğe Maruz Kalan
Gruplar Hangileridir? Türkiye Örneği
2Abstract
This study tests the effects of individual characteristics on the incidence of being long-term unemployed in Turkey using data from Turkey’s Household Labor Force Surveys of 2010 and 2011 which are the first two following years of Global Economic Recession. The results indicate that females are more likely to be long-term unemployed than males and this result hinders for “gender discrimination” against women. The results also indicate that increases in education as well as age increases the probability of being long-term unemployed and this indicates inadequacy of education and experience in Turkish labor market.
Keywords : Long-term Unemployment, Sample Selection, Gender, Turkey.
JEL Classification Codes : J41, J64.
Öz
Bu çalışma bireylerin kişisel özelliklerinin uzun dönem işsizlikleri üzerine etkilerini küresel ekonomik durgunluk sonrası iki yıllık TUİK hane halkı işgücü anket verilerini kullanarak test etmektedir. Sonuçlar, erkeklere kıyasla bayanların uzun dönem işsiz kalma olasılığının daha yüksek olduğunu ve bu sonucunda bayanlara karşı bir ayrımcılık olabileceğine işaret etmektedir. Ayrıca, eğitim düzeyi ve yaştaki ilerlemelerin de uzun dönem işsiz kalma olasılığını artırdığını ve bu nedenle Türkiye işgücü piyasasında eğitim ve tecrübenin uzun dönemli işsizlikten korunmak için yeterli olmadığını göstermektedir.
Anahtar Sözcükler : Uzun-dönem İşsizlik, Örneklem Seçimi, Cinsiyet, Türkiye.
1 An earlier version of this paper was presented at the Anadolu International Conference in Economics (ECON-Anadolu 2013) organized by (ECON-Anadolu University, June 19-21 2013 in Eskişehir.
2 Bu çalışmanın ilk düzenlemesi Anadolu Üniversitesi tarafından 19-21 Haziran 2013 tarihleri arasında Eskişehir’de düzenlenen Uluslararası Anadolu İktisat Konferansı’nda (ECON-Anadolu 2013) sunulmuştur.
144
1. Introduction
Long-term unemployment (LTU) is one deep scar presented by Great Recession of 2007-2009 for the world economy. People who were out of work for more than a year have reached to a total of 15 million and has exceeded 45 percent of total unemployed in 2011 in the United States and EU Member States only (see ILO, 2014). LTU, came with a lag of the recent global recession has greater impact on peoples’ lives than at any point since the Great Depression (Acs, 2013). Nichols et al (2013) provides some examples for the impacts from the U.S. recession and its’ afterwards. In 2011, long-term unemployed workers in the U.S. were almost twice as likely to be poor as those unemployed less than six months, and almost 4 times as likely to be poor as those never unemployed. About half of the unemployed workers reported a poor financial situation in 2010 and a tenth had filled for bankruptcy (Godofsky, von Horn & Zukin, 2010). Long-term unemployed borrowed money from friends, spent down savings, missed mortgage or rent payments (Borie-Holtz, Von Horn, Zukin, 2010). Among long-term unemployed 63 percent skipped dental visits, 56 percent put off need health care, and 40 percent not filled a prescription (Geewax, 2011). Interview rates cut nearly in half among the long-term unemployed relative to the newly unemployed (Kroft, Lange & Notowidigdo, 2012). Laid off workers were reemployed with about 15 percent lower wages than continuously employed workers (Barnette & Michoud, 2012). Consequences of being long-term unemployed extend far beyond the personal level, families are impacted and in turn, communities are affected (Fagan and Freeman, 1999 and Jhonson & Feng, 2013).
Nearly four years after the end of the Great Recession, long-term unemployment
still remains at record high levels. This unprecedented rise3 and persistence in long-term
unemployment has become a hallmark of the recent recession and became more worrisome among policymakers (Klobuchar, 2013). For instance, in January 2014, President Obama issued a three-part call to action – to employers, to communities across the country, and to federal agencies – to help Americans who are ready to work find jobs, and to help more of the long-term unemployed get back to work (White House, 2014). Tackling long-term joblessness and directing policies towards a job recovery process is a policy priority for the EU too (ICF GHK, 2012). These actions and more are needed (Krugman, 2015) because long-term unemployed are an unlucky subset of the unemployed and are not effective competitors in the labor market (Layard, Nickell & Jackman 1991; Jackman & Layard, 1991; Machin & Manning, 1999; Krueger, Cramer & Cho, 2014). The U.S. data also show that over the past year, one-quarter of newly unemployed workers found work versus fewer than
3 Machin and Manning (1998) argue that during the recession inflow rate of unemployment is higher than outflow rate of unemployment. Therefore, over the recession cycle, LTU follows anti-clockwise loops. Starting from the peak of the cycle as unemployment rises, the share of long-term unemployment actually falls at first but then rises.
145 one in ten of those who were unemployed for over a year (Klobuchar, 2013). In addition, active labor market policies in Scandinavian Countries contribute to achieve low levels of incidence of long-term unemployment (Chilosi, 2013).
The studies show that the individual risk of long-term unemployment is not same for all people, but rather varies depending on social-economic and structural factors like gender, education, sector of occupation, age category, marital status, region of residence etc.
(Folmer & Van Dijk, 1988). Therefore, tailoring effective policy devices4 towards workers
with less advantageous characteristics is necessary to combat against the consequences of
job loss (Brown & Sessions, 2010). This study5 aims to provide a preliminary guidance to
predict which group of individuals newly registered as unemployed will become long-term unemployed and thus must be priory focus of policymakers. For this aim, we have focused on data from Turkey’s labor market that provides unique characteristics in comparison with both developed and developing countries. One distinct characteristic of Turkey’s labor market for instance, is related its’ dual structure. On one side, there are individuals who work under permanent contracts and enjoy having secured jobs. On the other side, there are certain group of individuals, mostly women and youth who are more vulnerable than anywhere else because they are most likely to be LTU or non-participants and have less opportunity for regular employment in the formal sector (World Bank, 2006: 106). To best of our
knowledge, only few studies6 done on the persistency problem of long-term unemployment
in Turkey. Taşçı & Özdemir (2005) studied long-term determinants long-term unemployment using the data coincided with the following years of Turkish Financial market crisis of 2001. This study placed in a space where we analyze the effects of current world financial crisis on economies including Turkey.
The first part of the study provides a descriptive analysis of long-term unemployment and its’ determinants in Turkey for the last two decades. The second part of the study presents the econometric model and variables used in the estimations with their expected impacts on the long-term unemployment. Third part of the study presents the estimation results and calculated odd ratios. Finally, the last part contains some concluding remarks and some policy implications.
4 See for instance some policy actions for unemployed women (ILO, 2012) and structural reforms on unemployment in times of crises (OECD, 2012).
5 Micro economic approach followed by this study is found the most appropriate method in order to analyse the variation on the LTU (see for instance, Lancester & Nickell, 1979; Narendranathan & Nickell, 1985; Folmer & Van Dijk, 1988).
6 Biçerli & Gündoğan (2001) introduced a descriptive study on long-term unemployment situation in Turkey at the first place. Erol & Özdemir (2011) listed and discussed employment policy tools implemented in Turkey during last Global Economic recession. In addition, Bildirici et al (2012) studied unemployment generating effects of crisis in Turkey for the period of 1980-2010.
146
2. Long-Term Unemployment in Turkey
Turkey has been a country always with a high unemployment problem in her modern economic history. Figure 1 shows that starting with 2002, the unemployment does not decline significantly, with the highest value being observed in 2009 as a result of The Global Financial Crisis. Figure 1 also shows a dramatic fall in GDP and productivity growth during the period of 2008-2009. One of the serious consequences of this fall in production due to global recession was unemployment in any terms.
Figure: 1
GDP Growth and Unemployment Rates in Turkey, 1988-2012
-15 -10 -5 0 5 10 15 20 1988 1990 1992 1994 1996 1998 2000 2002 2004 2006 2008 2010 2012
Labor Productivity GDP Unemployment
In Figure 2, shows the trends in unemployment by considering age and gender difference for the period of 1988-2012. The most pronouncing observation from the Figure 2 is that the values, regardless of gender, for youth (i.e. 15-24) are always larger than for prime-aged (i.e. 25-54). Another observation is that the unemployment rates for females, regardless of age group, are larger than for males after the Global Financial Crisis. Further, the unemployment rates of prime-aged, regardless of gender, are very close to each other, mostly stable and move together throughout the period, except a few years. This means that not all the people affected from the crisis same.
147 Figure: 2
Unemployment Rates by Gender and Broad-Age Group in Turkey, 1988-2012
0.00 5.00 10.00 15.00 20.00 25.00 30.00 1988 1990 1992 1994 1996 1998 2000 2002 2004 2006 2008 2010 2012
Male 15-24 Female 15-24 Male 25-54 Female 25-54 Total
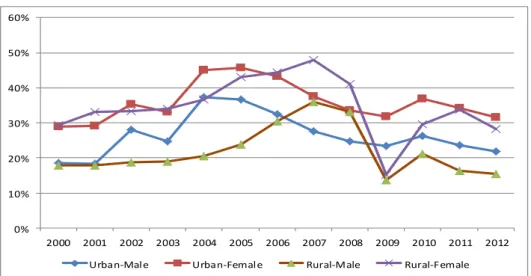
Trends of the share of long-term unemployed among the unemployed by considering gender and residence factor, for the period of 2000-2012, is provided in Figure 3. We observe that, regardless of residence, the proportion of long-term unemployed is larger
for females than males throughout the period7. For the urban residents, the difference
between females and males is largest (lowest) in 2001(2004) with the difference of 10.9% (7.6%). However, for the rural ones, the difference is largest (lowest) in 2005(2009) with the difference of 19.3% (1.5%). One can also observe from the Figure that LTU proportions seem to have similar tendencies among genders in urban areas. The same is also true for the
rural residing ones. Further, we can also say that there is a declining trend8 in LTU, after
2005, in the urban areas for both males and females. Even though, the rate of unemployment in 2009 has a sharp increase (see Figure 2), the incidence of LTU makes a dip in the same year (see Figure 3).
7 Before the period given in Figure 3 the situation summarized in Bildirici et al (2012). In 1990, 45 % of total unemployed men and 51.5% of total unemployed women were long-term unemployed. The gender gap increased from 6 percentage points (in 1990) to 16 percentage points with 1994 economic crisis and came back to 6 percentage points by 2000 in Turkey (Bildirici et al., 2012).
8 The share of long-term unemployed in total unemployed was approximately 45% with a volatile track for first 6 years of 1990s and decreased remarkably after that the rate in 2000 was about 20% (Bildirici et al., 2012).
148
Figure: 3
Trends in Incidence of LTU by Residence; Turkey, 2000-2012
0% 10% 20% 30% 40% 50% 60% 2000 2001 2002 2003 2004 2005 2006 2007 2008 2009 2010 2011 2012 Urban-Male Urban-Female Rural-Male Rural-Female
Figure 4 illustrates the recent trends in LTU by considering educational attainment and gender, only for the year of 2012. For each category of education groups, we observe that if females become unemployed, they may be at greater risk of long-term unemployment than males. The differential between females and males are at the minimum for the non-graduates, while at the maximum for the Primary School graduates. Further, regardless of being male or female, the lowest LTU is seen among the non-graduates, while the highest is seen among the University graduates. For both males and females, High School, Vocational High School and University graduates have higher LTU than the country average.
149 Figure: 4
Incidence of LTU by Education and Gender; Turkey-2012
3. Data, Econometric Model and Estimated Variables
The analysis in this paper has been carried out using pooled cross-section annual data from the Household Labor Force Surveys (HLFS) of Turkish Statistical Institute (TURKSTAT) for the years 2010 and 2011. The data cover all geographical regions of Turkey and, are statistically representative of the Turkish population and, comprising about 145.000 households and 510.000 individuals. The individuals, 15 years of age and over, had actively looked for full-time or part-time work during the last three-months (i.e. used at least one of the job search methods), and were available for work in the reference period but were not employed during the reference period are counted as unemployed (TURKSTAT, 2013). Among all the unemployed the ones who have been searching for a job twelve months or
over are counted as long-term unemployed (LTU)9.
9 This is the “Narrow Definition” of LTU used in Tasci and Özdemir (2005). Another definition used in the literature is the “Broad Definition” which covers the individuals who have been searching for a job six months or over. 15,6% 16,8% 19,2% 24, 4% 25, 0% 30,7% 20,9% 20,5% 26 ,9% 25,7% 32,6% 33,6% 36,7% 31,3% 0% 5% 10% 15% 20% 25% 30% 35% 40% Male Female
150
The dependent variable used in the estimations is binary; taking on only two values, one (if the individual is long-term unemployed) and zero (otherwise). The most appropriate models in this type of work are the binary choice models (Verbeek, 2004; Wooldridge, 2010; Greene, 2012). In these models, we focus on the response probability
and its determinants, that is formulated as:
(
1 |
)
(
,
)
i i i
P y
x
G x
, whereG(.) is a function takes on values strictly in the interval [0,1] for all real numbers, say z (Verbeek, 2004: 191). This equation basically explains that the probability of observing
1
i
y
depends on the vector of explanatory variables denoted byi
x
. The logit andprobit models are only two models that are able to handle binary response variables. In the logit model G(.) is assumed to be logistically distributed function and in the probit model G(.) is assumed to be normally distributed.
In order to determine what factors influence the likelihood of being long-term
unemployed, we estimated probit (and logit10) models, where observations were weighted
by an HLFS sampling weight designed to make the HLFS sample representative of the Turkish population. It is known from the definitions of LTU however, that one must be unemployed to be counted as long-term unemployed. The fact that long-term unemployment is observed only for those who are unemployed leads to sample selection bias. To get rid of biased estimation results due to sample selection bias, one can employ Heckman’s approach, i.e. selectivity corrected probit (or logit) model with two step procedure (Heckman , 1979;
Lee, 2001; Greene, 2012). In this procedure, in short11, we, initially, estimate the selection
into unemployment equation using maximum likelihood estimation method12 where we
obtain the inverse Mills-ratios (IMR) for each observation. In the second step, we estimate the selectivity corrected probit model by regressing LTU variable on vector of explanatory variables.
The explanatory variables for the estimation are included based on similar studies in the literature and available data. First, literature indicates urban-rural difference as one of the relevant factors determining LTU. Individuals in urban settlements are in fact, more likely to be long-term unemployed compared to rural ones. This is because competition among the unemployed people for the available job positions is high in the urban areas compared to rural areas (Folmer & Van Dijk, 2001). In addition, even though the urban areas are more job rich areas in terms of quantity and variety, these jobs mostly come from service
10 Estimation results under the logit specification are available from the authors upon request.
11 For the detailed explanations on the estimation method, see Cameron and Trivedi (2005),Wooldridge (2010) andGreene (2012). This procedure is also used in Dolton et al. (1989), Palme and Wright (1998), Konseiga (2006).
151 and manufacturing-oriented sectors that require highly productive and skilled employees. In rural areas however, agriculture can be considered as the foremost source of income and employment and agriculture-oriented jobs, such as farming, do not generally require extra qualifications. Therefore, the variable “urban” has been included in the estimations with positive expected sign of parameter.
Literature indicates gender differential as another critical determinant of LTU. That is, females compared males have higher risk of being long-term unemployed. The first reason for this is that females are conventionally responsible and spend more time for unpaid
housework and other home production activities13 and therefore they have a high reservation
wage (Taşçı & Özdemir, 2005). This may result in both, for females, lower labor force participation and higher likelihood of being long-term unemployed. The second reason for this is that females compared to males have lower education level and marketable skills at least in some countries. The final explanation can be related cultural barriers or discrimination, which makes females disadvantageous in the labor market and reduces the likelihood of getting a job offer and increases the long-term unemployment possibility for females (Biçerli & Gündoğan, 2001).Thus, the variable “female” has been included in the estimations with positive expected sign of parameter.
The existing literature indicates two counteracting forces of marital status of unemployed workers affecting incidence of being LTU (Nickell, 1979; Payne and Payne, 2013). On the one hand, employers prefer family heads and to a lesser extent, spouses to singles, because they have family membership as an indicator of reliability and stability (Nickell, 1979; Lancester & Nickell, 1980). Therefore, married people are likely to have shorter spells of unemployment than singles. On the other hand, singles and other family members are more flexible to apply for jobs in the secondary labor market, and therefore these groups are more likely to have shorter spells of unemployment and high re-entry probabilities. Although marital status of unemployed represented with the variable “married” seen as an important factor for regressions and expected to be significant, the direction of the sign of the coefficients predicted as ambiguous. Besides marital status, including the variable represented with “head” to test the effect of household status in the estimations. The literature indicates that head of households are being regarded as, traditionally, the main bread-winners of the family and, therefore, have a stronger attachment to the labor force than anyone else. As a consequence, head of households, they became unemployed, search intensively and effectively for a work, so, they are expected to have a lower duration of unemployment as well as to have lower likelihood of being long-term unemployed (Nickell, 1979). On the other hand, due to their responsibilities, they have high
13 In Turkey, in fact, 51 percent of total women population on a questionnaire indicate household work as a reason for not search for a job (Bildirici et al, 2012: 30).
152
reservation wages and that keeps them away from low paid jobs and in ceases the duration of unemployment. As a result the sign of the variable “head” is expected to be ambiguous.
Inadequate level of education and human capital are among the main focused factors in the literature for the long-term unemployment (Nickell, 1979; Mincer, 1991; Machin & Manning, 1998; Payne & Payne, 2013). Sometimes however, not lower qualifications but requirements of new jobs created in the economy while they are unemployed creates mismatch (Evans, 1993). In addition, Ljunggvist and Sargent (1998) indicate the instantaneous loss of human capital or skills at layoffs is the primary cause of LTU in turbulent times. From another perspective, the individuals with some educational degrees, compared to non-graduates, are more selective and are waiting for a good job that is subject to queuing process in most of the times. Nevertheless, individuals with lower qualifications and education were more likely to experience longer length of unemployment (Nickell, 1979; Mincer, 1991) and therefore, the sign of “education” variable is expected to
be negative at any level of education14 compared to non-educated.
The existing literature indicates that the probability of finding a job is expected to decline with age and thus LTU is more likely among older man (Machin & Manning, 1998; Payne & Payne, 2013). One possible reason is that older unemployed have often being rejected in employers screening procedure because of their relatively high labor cost, albeit their productivity sufficient to accommodate the wage being paid (Nickell, 1979; Skirbekk, 2004; Van Ours & Stoeldraijer, 2010). The other reason is that older individuals, compared to younger counterparts, are likely to be less able to integrate into the actual needs of today’s jobs, as they are less mobile geographically and outdated with regard to knowledge, technical and educational skills (Brown & Sessions, 2010; Machin & Manning, 1999). Another reason is that older workers have higher reservation wages and are more selective in the job-search process (Blanco & la Rica, 2002). As a result, the variable named as “age” is expected to positively relate to LTU.
The last factor affecting the probability of being long-term unemployed is related to the work of a sector. The literature indicate for instance that former manufacturing workers tend to be over represented among LTU because they accumulate significant amount of skills only through work experience, they lose those skills when they get unemployed and more prone to end up being unemployed (Ljungqvist & Sargent, 1998). Therefore, as compared to workers in agricultural sector or any other sectors, workers in manufacturing are expected to be over represented among long-term unemployed.
14 Nickell (1979) finds that each year of schooling up to 12 years reduces the expected duration of unemployment by over 4%.
153 4. Estimation Results
Table 1 shows the estimation results obtained using Heckman’s selectivity corrected probit specification. The results indicate the class of residence, gender, household status, education, age, geographical region, and occupation as relevant factors in determining long-term unemployment. In terms of residence, represented by the variable of “Urban”, odds ratio of 1.35 in Table 1 column 1 indicates that individuals who live in the urban areas have 1.35 times higher risk of becoming long-term unemployed as compared to rural residing ones. Hence, one can say that individuals in urban settlements are more likely to be
long-term unemployed compared to their counterparts in rural settlements15. Table 1 column
2 and 3 shows that the odds ratio higher for men (1.39) than for women (1.28).
In terms of gender differential, the coefficient of the variable “female” is tested as statistically significant with the odds-ratio greater than one as 1.21 points (see Table 1 column 1). That means being female as compared to being male have 1.21 times higher risk of becoming long-term unemployed. The effects of household status on being long-term unemployed have been tested using three separate dummy variables, namely, “married”, “Fem*Mar” and “Head”. The variable of “married” is statistically significant and the odds ratios of this variable are less than one with 0.48. That means married workers as compared to non-marrieds have 50 percent lower risk of being long-term unemployed. Table 1 column 2 and 3 shows that significance of this results is larger for males. However, the interaction dummy of “Fem*Mar” was tested as statistically not significant. Another observation related to household status is related to the variable.
154
Table: 1 Estimation Results
Full-Data Female Male
Urban 1.351 1.281 1.385 [0.067]*** [0.122]** [0.082]*** Fe male 1.206 [0.023]*** Fe m*M ar 0.904 [0.073] M arrie d 0.481 0.422 0.479 [0.172]*** [0.423]** [0.208]*** He ad 0.542 0.607 0.499 [0.119]*** [0.214]** [0.147]*** Bas e: Non-Graduates Primary 1.406 1.369 1.415 [0.132]** [0.239] [0.162]** M iddle 1.399 1.413 1.395 [0.088]*** [0.159]** [0.107]*** High 1.446 1.532 1.391 [0.073]*** [0.131]*** [0.090]*** Voc.High 1.312 1.384 1.282 [0.054]*** [0.096]*** [0.066]*** Unive rs ity 1.149 1.207 1.067 [0.044]*** [0.076]** [0.058] Bas e: Age 15-19 Age 20-24 2.144 2.709 1.974 [0.219]*** [0.399]** [0.266]** Age 25-34 2.545 3.188 2.367 [0.128]*** [0.232]*** [0.156]*** Age 35-44 3.014 3.498 2.992 Age 45-54 [0.122]*** [0.220]*** [0.150]*** 4.801 4.459 5.123 Age 55+l [0.170]*** [0.308]*** [0.209]*** 5.684 4.293 5.931 [0.124]*** [0.244]*** [0.151]*** Bas e: Legis t Profe s 17.448 20.926 19.394 [1.043]*** [1.900] [1.272]** Te chn 17.877 24.018 18.124 [1.056]*** [1.925]* [1.287]** Cle rk 28.524 35.343 31.85 [1.179]*** [2.150]* [1.436]** Se rvSale 18.101 22.867 19.464 [1.078]*** [1.967] [1.314]** Agr-Fis h 1.2 1.195 1.188 [0.202] [0.460] [0.240] Craft 13.713 23.965 13.696 [1.048]** [1.910]* [1.277]** Plant 14.995 18.667 15.509 [1.017]*** [1.854] [1.239]** Ele me ntary 13.505 18.582 13.854 [1.054]** [1.919] [1.284]** Re gion of Re s ide nce Significant Significant Significant
Cons tant 7.27 2.001 7.278 [2.220]*** [4.056]* [2.703]*** IM R 6.656 7.403 6.978 [0.676]*** [1.241] [0.821]** LR chi2 2,720.27 746.49 1,679.49 Prob 0 0 0 Ps e udo R2 0.0735 0.0543 0.0739 Log-Like lihood -3060448.19 -1122514.70 -1920816.37 df 50 48 48 N 37,414 12,390 25,024
155 “Head” of household and the odds ratio for this variable is 0.54. That means, head of households have about 50 percent less probability of being long-term unemployed than other workers. The results also show that this is more appealing for male head of households.
Table 1 also shows expectedly significant results for the variables education, age and occupation. In general, all the education level dummies have odds-ratios greater than one. This implies that all different education categories are more likely to be long-term unemployed compared to non-graduates. Further observation is that odds-ratios initially increase with the education level, then decrease and the highest odds-ratio with 1.45 is being seen for the High-School graduates. However, estimations with separate genders show varying results. Insignificant parameter for females on column 2 in Table 1 shows that the probability of being long-term unemployed does not statistically differ between non-graduates and elementary school non-graduates for females only. This result can be interpreted as that females started to think not to take every job offer after when they get to finish high school. The similar insignificant difference is true for university graduated males compared to non-graduates. That means the university graduated males have similar level of probability of being long-term unemployed with non-graduated males (See Table 1 Column 3). In other words, the probability of being long-term unemployed increase among men as gets more educated except university education.
The estimation results concerning age, where age 15-19 is the base category, show that the odds-ratios are all greater than one and increasing with the increase in age. This implies that workers after getting unemployed loose chances of being re-employed as they get older and older. For instance, the odds ratio of 5.68, belongs to age group, 55 and older means that workers with an age of 55 and older have 5.68 times higher probability of long-term unemployed than workers with an age group of base category. Table 1 also shows that except workers in agriculture and fishing, workers in all other sectors have higher probability of being long-term unemployed as compared to legislators.
One remarkable gender difference between separate estimation results given on column 2 and 3 in Table 1 is related to sector of occupation. The probability of being long-term unemployed is larger only among males in all other occupations compared to legislators. In contrast, there is no significant difference between being legislator, professional, salesperson, plant worker, elementary worker and agricultural worker in term of LTU for females. However, form females being a clerk, craft person or technician rather than legislators increases the probability of being long-term unemployed with a lower significance.
Figure 5 and Figure 6 show calculations of predicted probabilities of being long-term unemployed depending on variables used in specified models. In these calculations regional and occupational variations in the likelihood of being long-term unemployed for
156
each gender; men and women are separated. The values presented in Figure 5 clearly show that for both females and males, the likelihood of LTU was observed as the highest in Black Sea regions and the lowest in West-Marmara and Mediterranean regions. Nearly one in two women and one in three men are under the threat of being long-term unemployed in Black Sea and North East Anatolia of Turkey. In addition, for females compared males the probability of being long-term unemployed is higher in all regions of Turkey. That means there exists a clear gender gap in the probability of being long-term unemployed. The gender gap in probability of being long-term unemployed varies between 6.21% and 24.5%. In other words, it is the largest in North-East Anatolia (24.5%) and then in Central-East Anatolia (21.7%) and the lowest in Istanbul (6.21%) and then in East-Black Sea regions (24.5%).
Figure: 5
Predicted Probabilities of LTU by Gender & Geographical Region16
3 2 .3 4 % 2 9 .2 0 % 37.3 5 % 3 5 .9 2 % 3 6 .8 5 % 3 1 .2 5 % 41 .3 4 % 49.1 2 % 4 9 .4 0 % 4 8 .4 2 % 3 9 .5 4 % 3 2 .3 3 % 2 6 .1 2 % 1 7 .9 1 % 27 .7 6 % 2 3 .7 8 % 2 5 .0 1 % 1 9 .1 5 % 1 9 .6 3 % 3 3 .3 3 % 41.1 4 % 2 3 .8 9 % 1 9 .1 6 % 2 1 .7 1 % 0% 10% 20% 30% 40% 50% 60% Female Male
16 The predicted probabilities under the Broad Definition of LTU can also be obtained from the authors upon request.
157 Figure 6 shows the effect of occupation on the predicted LTU probability under gender difference. One can see that the largest LTU probability is being observed for the Legislators, senior officials and managers. In other words, two out of five legislators, senior officials and managers are under the tread of being long-term unemployed. More or less the same is true for professionals and clerks. Also, as expected, the lowest value of LTU probability is being observed for females among the “skilled agricultural and fishery workers”, while, for males, among the “elementary occupations” and “craft and related trade workers”. One also see that the gender gap is another concern here. In all occupation groups, in fact, the values of prediction for females are larger than the values for males. Unsurprisingly, the gender gap between females and males is lowest for the “skilled agricultural and fishery workers” and then for the “clerks”, while it is highest for the “Craft and related trade workers”.
Figure: 6
Predicted Probabilities of LTU by Gender & Occupation Group17
4 3 .5 % 4 0 .0 % 3 9 .3 % 4 1 .3 % 3 3 .2 % 2 5 .6 % 3 7 .4 % 3 0 .6 % 2 8 .5 % 3 6 .6 % 3 3 .4 % 2 9 .0 % 36 .0 % 2 5 .9 % 2 3 .6 % 1 8 .7 % 26 .5 % 1 8 .7 % 0% 10% 20% 30% 40% 50% Female Male
17 See Footnote 14.
158
5. Concluding Remarks
This article has examined the individual based determinants of long-term unemployment in Turkey using the raw data obtained from HLFSs for 2010 and 2011 the years just after the Global Financial Crises. In the empirical analysis, we employed Heckman (1979)’s two-step sample selection model with probit specification. We find that not all the people got affected from the crisis equally. The risk level of being long-term unemployment under the crises was greatly affected by workers’ personal attributes such as gender, age group, education, residence and occupation.
There is a “gender gap” between male and female in relation to the risk of long-term unemployment in all the occupations and all the regions of Turkey. This finding is consistent with ILO report (2014) stating that Turkey has the largest gender gap in employment in the region – 38.7 percentage points in 2012 (the male employment rate was 65 per cent while the female rate was only 26.3 per cent) – and this gap is closing only very slowly. This finding also reminds literature’s famous calling “gender discrimination” against women and is very similar to the results of the studies for South Asian, West Balkan, Middle East and North African Countries. The most common factor among all these countries is the people’s choice of religion, Islam, the lifestyle and instability. Conditions in Turkish labor market in terms of these aspects are very much similar to conditions in countries where Muslims live most and not similar to developed or less developed countries of non-Islamic world. Not only lower probability for reemployment, quality of employment and opportunities for better jobs continue to be unequally distributed between men and women in these countries. When women work they tend to earn less, to work in less productive jobs, and are over-represented in unpaid family work (ILO, 2013; Bildirici et al, 2012: 28).
The long-term unemployment incidence increases with an age in Turkey just like other countries. Although youth unemployment in Turkey remains as one the highest in the World and twice as high as the global average, LTU hits the older aged people more. This result is also consistent with ageism that was identified as an externally imposed barrier to employment and often been discussed in the relevant literature.
The results18 also indicate that school graduates in Turkey are more prone to
long-term unemployment no matter which education level they attained. This finding is opposite to the most findings in studies done especially for developed World, but supports the report by ILO(2013) stating that educational systems in Middle Eastern and North African Countries and Turkey struggle to deliver graduates with the necessary skills for finding
18 The results in this study are drawn using non-longitudinal HLFS data which covers wage-earnings, but not the other types of income nor does the total family income. Therefore, having a data with better coverage would increase the quality of the future studies.
159 productive jobs. This implies that Turkey needs to develop a better education and training system (NEETS) towards labor market (ILO, 2014).
The results over all show that during and after the economic recessions, probability of staying as long-term unemployed is not same for every group but unequally distributed among various groups in the societies with considerable differences depending on the various personal attributes such as lived location, age, education, gender and occupation.
References
Acs, G. (2013), Responding to Long-Term Unemployment, Washington, DC: The Urban Institute, <http://www.urban.org/research/publication/responding-long-term-unemployment>, 16.01.2015.
Barnette, J. & A. Michaud (2012), “Wage Scars from Job Loss”, Working Paper, University of Akron, <http://www.uakron.edu/dotAsset/2264615.pdf>, 16.4.2015.
Blanco, A. & S. de la Rica (2002), Unemployed Older Workers Versus Prime Age Workers
Differences in Their Re-Employment Determinants in Spain,
<http://www.ehu.eus/SaradelaRica/docs/rea1.PDF>, 16.04.2015.
Biçerli, M.K. & N. Gündoğan (2001), “Profiling and Identification of Long-Term Unemployment in Turkey”, Ekonomik Yaklaşım, 12(41), 51-76.
Bildirici M. & Ö.Ö. Ersin & C. Türkmen & Y. Yalçınkaya (2012), “The Persistence Effect of Unemployment in Turkey: An Analysis of 1980-2010 Period”, Journal of Business
Economics and Finance, 1(3).
Borie-Holtz, D. & C. Van Horn & C. Zukin (2010), No End in Sight: The Agony of Prolonged
Unemployment, New Brunswick, NJ: John J. Heldrich Center for Workforce
Development, Rutgers University.
Brown, S. & J.G. Sessions (1997), “A Profile of UK Unemployment: Regional Versus Demographic Influences”, Regional Studies, 31(4), 351–366.
Cameron, A.C. & P. Trivedi, (2005), Microeconometrics: Methods and Applications, Cambridge University Press.
Chilosi A. (2013), “Long-term Unemployment in the Varieties of Capitalism”, MPRA Paper No:
58553, posted at 14 September 2014, <http://mpra.ub.uni.muenchen.de/58553/>,
16.4.2015.
Erol H. & A. Özdemir (2012), “The Effectiveness of the Employment Policies Implemented in Turkey in the Times of Economic Crisis”, TODAIE’s Review of Public Administration, 6(2), 71-104.
Evans G.W. (1993), “Sectoral Imbalance and Unemployment in the United Kingdom: 1963-84”,
Oxford Economic Papers, 45, 440-456.
Fagan, J. & R.B. Freeman (1999), “Crime and Work”, in: M. Tonry (Ed.), Crime and Justice: A
160
Folmer H. & J. Van Dijk (1988), “Differences of Unemployment Duration: A Regional or a Personal Problem?”, Applied Economics, 20, 1233-1251.
Geewax, M. (2011), “The Impacts of Long-Term Unemployment”, Part of an NPR special series, Still No Job: Over a Year without Enough Work,
<http://www.npr.org/2011/12/09/143438731/the-impacts-of-long-termunemployment>. Godofsky, J, & C. van Horn & C. Zukin (2010), American Workers Assess an Economic Disaster,
New Brunswick, NJ: John J. Heldrich Center for Workforce Development, Rutgers University.
Greene, W.H. (2012), Econometric Analysis, Seventh Edition, Prentice-Hall, New Jersey, USA. Heckman, J.J. (1979), “Sample Selection Bias as a Specification Error”, Econometrica, 47(l),
53-161.
Hornstein, A. & T.A. Lubik (2010), “The Rise in Long-Term Unemployment Potential Causes and Implications”, 2010 Annual Report, The Federal Reserve Bank of Richmond.
ICF GHK (2012), “Tackling Long-Term Unemployment– Effective Strategies and Tools to Address Long-Term Unemployment”, Seminar Report, Brussels,
<http://ec.europa.eu/social/main.jsp?catId=327>.
ILO (2014), Global Employment Trends: Risk of a Jobless Recovery?, International Labour Offıce, Geneva.
ILO (2013), Global Employment Trends for Women, International Labour Office, Geneva.
Jackman, R. & R. Layard (1991), “Does Long-Term Unemployment Reduce a Person’s Chance of a Job? A Time-series Test”, Economica, 58, 107–121.
Johnson, R.W. & A. Feng (2013), Financial Consequences of Long-Term Unemployment during the
Great Recession and Recovery, Washington, DC: The Urban Institute.
<http://www.urban.org/publications/412800.html>.
Klobuchar, A. (2013), Long-term Unemployment in the United States, Joint Economic Committee, United States Congress.
Kroft, K. & L. Fabian & M.J. Notowidigdo (2012), “Duration Dependence and Labor Market Conditions: Theory and Evidence from a Field Experiment”, Working Paper, Nr. 18387, Cambridge, MA: National Bureau of Economic Research,
<http://papers.nber.org/papers/w18387>.
Krueger, A. & C. Cramer & D. Cho (2014), “Are the Long-Term Unemployed on the Margins of the Labor Market?”, Brookings Papers on Economic Activity.
Krugman, Paul, (2015), Targeting Two: Long-term Unemployed Struggle as Economy Improves, <http://economistsview.typepad.com/economistsview/2014/09/long-term-unemployed-struggle-as-economy-improves.html>.
Lancaster, T. & S. Nickell (1980), “The Analysis of Re-Employment Probabilities for the Unemployed”, Journal of the Royal Statistical Society, 143, 141-165.
Layard R. & S. Nickell & R. Jackman (1991), “Unemployment: Macroeconomic Performance and the Labour Market”, Journal of Economic Literature, 45(2), 410-418.
Lee, Lung-fei (2001), “Self-Selection”, in: Baltagi, B. (ed), A Companion to Theoretical
Econometrics, Blackwell Publishers, Oxford, UK.
Ljungqvist, L. & T.J. Sargent (1998), “The European Unemployment Dilemma”, Journal of Political
161
Machin, S. & A. Manning (1999), “The Causes and Consequences of Long-term Unemployment in Europe”, in: Handbook of Labor Economics 3, edited by Orley Ashenfelter and David Card, 3085–3139, Amsterdam: Elsevier.
Mincer, J. (1991), “Education and Unemployment”, NBER Working Paper, No. 3838. Narendranathan, W. & S. Nickell (1985), “Modelling the Process of Job Search”, Journal of
Econometrics, 28(1) 29-49.
Nichols A. & J. Mitchell & S. Lindner (2013), Consequences of Long-Term Unemployment, Washington, DC: The Urban Institute.
Nickell, S.J. (1979), “Estimating the Probability of Leaving Unemployment”, Econometrica, 47(5), 1249-1266.
OECD (2012), “Structural Policy Reforms in Times of Crises”, Chapter 1 in Economic Policy
Reforms, Going for Growth.
Payne C. & J. Payne (2000), “Early Identification of the Long-Term Unemployed”, PSI Research
Discussion Paper 4,
<http://www.psi.org.uk/publications/Research%20Discussion_Paper_4.pdf>. Skirbekk, V. (2004), “Age and Individual Productivity: A Literature Survey”, Vienna Yearbook of
Population Research, 133–153.
Tansel, A. & H.M. Taşçı (2010), “Hazard Analysis of Unemployment Duration by Gender in a Developing Country: The Case of Turkey”, Labour, 24(4), 501–530.
Taşçı, H.M. & A.R. Özdemir (2005), “Trends in Long-Term Unemployment and Determinants of Incidence of Long-Term Unemployment in Turkey”, Journal of Economic and Social
Research, 7(2), 1-33.
TURKSTAT (Turkish Statistical Institute) (2013), <http://www.tuik.gov.tr>, September 15, 2013. Van Ours, J.C. & L. Stoeldraijer (2010), “Age, Wage and Productivity”, Center Discussion Paper,
No. 12, Tilburg University.
Verbeek, M. (2004), A Guide to Modern Econometrics, 2nd Edition, Erasmus University Rotterdam. White House Press Office (2014), “Getting Long-Term Unemployed Americans Back to Work”,
<http://www.whitehouse.gov/the-press-office/2014/10/15/fact-sheet-getting-long-term-unemployed-americans-back-work>.
Wooldridge, J.M. (2010), Econometric Analysis of Cross Section and Panel Data, The MIT Press. Cambridge.
World Bank Report (2006), “Turkey Labor Market Study”, by Poverty Reduction and Economic Management Unit for Europe and Central Asia Region, Report No. 33254-TR.
162
Appendix Table: 1 List of the Variables
1. “Urban” is a dummy variable taking value 1 if a man or woman lives in a town of more than 20,000 inhabitants and 0 otherwise
2. “Female” is a dummy variable taking value 1 if the sex is female and 0 otherwise
3. “Fem*Mar” is an interaction dummy taking value 1 if the gender is female and marital status is married and zero
otherwise.
4. “Married” is a dummy variable taking value 1 if the survey respondent is married and 0 otherwise 5. “Head” is a dummy variable taking value of 1 the survey respondent is head of household and 0 otherwise
6. Education consists of a set of six dummies: The reference category includes those who are illiterate plus those who are literate but did not graduate from a school (Non-Graduate). The other education categories are “Primary School”, “Middle School”, “High School”, “Vocational High School”, “University”.
7. Age is a set of six dummies: Age 15-19” (base category),”Age 20-24”, “Age 25-34”, “Age 35-44”, “Age 45-54”, “Age 55+” (Age 55 and over).
8. Occupation of the unemployed individuals consists of nine dummies: “Legist”: Legislators, senior officials and managers (base category), “Profes”: Professional and related workers
“Techn”: Technicians and associate professionals “Clerk”: Clerical and Related Workers,
“ServSale”: Service workers and shop and market sales workers, “Agr-Fish”: Skilled agricultural and fishery workers,
“Craft”: Craft and related trade workers,
“Plant”: Plant and machine operators and assemblers “Elementary”: Elementary occupations
9. “IMR” is Inverse Mills Ratio.
Variable used only in the selection into unemployment equation: 10. “N.of Individuals” is the number of individuals in the household