Hydra:
detecting fraud in financial transactions via
graph based representation and visual analysis
Yusuf Sait Canbaz Computer Eng. Dept.
Bilkent University Ankara, Turkey [email protected]
Uğur Doğrusöz Computer Eng. Dept.
Bilkent University Ankara, Turkey [email protected] Mehmet Çeliksoy Risk Management Turkcell Technology Istanbul, Turkey [email protected] Fatma Güngör Finance
Turkcell Ödeme Hizmetleri A.Ş. Istanbul, Turkey [email protected] Koray Kurban Risk Management Turkcell Technology Istanbul, Turkey [email protected]
Abstract—In this paper, we describe a web based tool named Hydra for analyzing financial transaction data with the aim to detect or verify fraudulent activities via visual analysis and graph based querying. Hydra exclusively uses graph based query algorithms to mine useful information in the transaction database, presents the results visually, facilitating interactive graphical analysis with state-of-the-art graph visualization technologies. We present the various components of Hydra and their aims. In addition, a number of different types of scenarios using these components for a network of prepaid card transactions are provided to illustrate the use of Hydra for detecting or verifying fraudulent activities.
Keywords—detecting fraud, financial transaction networks, visual analysis, graph visualization, graph algorithms, graph mining, graph databases, querying graph databases, web based software
I. INTRODUCTION
In all sectors worldwide, including finance, roughly 5% of revenues are lost to fraud [1]. Companies are more and more using varying techniques to detect and prevent fraud. These range from statistical methods (e.g., regression or gap analysis, time series analysis, and calculation of various statistical parameters such as averages or quantiles) to artificial intelligence and machine learning.
Nowadays, data is being accumulated at an exponential rate, from smart household appliances hooked up to the Internet, to financial transactions of various kinds. Analysis of such data can help organizations to make better decisions and develop new products, or improve the effectiveness and efficiency of existing ones as well as detecting or preventing fraud. Such data is typically stored in large databases for analysis. Lately, more and more organizations are making use of a graph based representation with the key advances in the performance of graph databases within the past decade [2].
Data visualization is a key recurring requirement in big data analytics as the human brain can process images up to 60,000 times faster than words [3]. Visual analysis aids or supplements all above mentioned methods for detecting or preventing fraud by enabling operators to directly detect, to check the validity of any raised flags or to reveal unknown ones.
This paper introduces a highly customizable, web-based software tool named Hydra to aid detection or verification of fraud in financial transactions through some real-life
II. BASICS AND RELATED WORK A. Fraud Detection
In law, fraud is defined as the act of purposefully deceiving to obtain unlawful or unfair gain [8]. Fraud involving insurance, credit or prepaid card transactions, mobile communication, taxation, etc. represent significant problems for businesses or governments. In fact, organizations lose a hefty amount of money to fraudulent activities [1]. Specialized techniques in areas such as statistics, machine learning, data mining and knowledge discovery are employed to discover such fraudulent activities to reduce such losses.
Statistical methods range from validation or correction of missing or incorrect data to time-series analysis of time dependent data to classification and clustering to discover patterns or associations in groups of data [5].
A very common way to deal with fraud is via expert systems that encode expertise for detecting fraud in the form of rules [9].
Although traditional data analysis techniques mentioned earlier enable organizations to get better insights into the processes behind the available data, they heavily rely on human analysts [10]. In recent years, in order to take this a step further and equip the analysis systems with a substantial amount of background knowledge, performing reasoning tasks, researchers have started shifting their focus to ideas in graph mining and machine learning.
A graph G = (V , )E is composed of a non-empty node set V and an edge set E . An edge, e = { x, y} (or simply ),joinsnodes and . is said to beincidentwith both y
x x y e
and . Node and are called neighbors of each other.
x y x y
A path between two nodes n0 and nk is a non-empty graph P = (V ,′E′) with V′= {n ,0 n1, ..,. nk} and
, where are all distinct. n n , n , .., n }
E′= { 0 1 n1 2 . nk−1 k ni n0 and nk are called the end points of path P = n0 1n ...nk, whose length, denoted by |P |is the number of edges on it.
If G′= (V ,′ E′) is a subgraph of G = (V , )E , and G′ contains all the edges yx ∈ E with ,x y∈ V′, then G′ is an induced subgraph of .G
One way graph mining can be achieved through queries performed on the database via traversals and graph based algorithms.
A more recent way in which transaction data may be exploited for detecting fraud is through a machine learning technique called Graph Convolutional Networks [6].
B. Graph Databases
A graph database is one where objects and their relationships are stored as is, which facilitates easy traversal of relations to quickly form semantic queries to explore these relations [12]. In a sense, graph databases portray your data as you view it conceptually.
In the past, graph databases had substantial performance and scalability problems and were not the choice of big data analysts. With the advances in graph database technologies, however, organizations are now using more and more graph based databases to store large amounts of data [11]. Finance and financial transaction data is no exception.
Neo4j is one of many graph database management systems. This ACID-compliant transactional database with native graph storage and processing [14] is currently the most popular graph database according to DB-Engines ranking [15]. Neo4j is implemented in Java and is accessible from software written in many other languages using the Cypher query language and associated API [14].
C. Graph Visualization
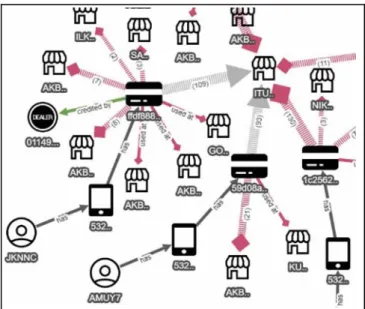
Regardless of the technique used for storing data and detecting suspicious activities within that data, one would like to take a deeper look at any suspicious activity discovered. One of the most effective ways of doing this is through visualization (Fig. 1). It’s crucial that a graph is nicelylaid out before presented to the user as a poorly laid out graph confuses the user. A graph based visual analysis is naturally suited for this especially when the data is stored in the form of a graph in your database. The benefit is two-fold. One is to verify that the suspicious activity is indeed fraudulent. And the other is to reveal any anomaly through visualization to detect fraud.
Fig. 1. Part of an example visualization of a graph based data,
where customers, their accounts and prepaid cards along with their transactions are shown visually.
Cytoscape.js [16] is a web-based graph visualization and analysis library implemented in JavaScript. Through its
extension mechanism, the library can be enriched for a fully-fledged visualization software. Visuall, a proprietary software component based on Cytoscape.js and its extensions using modern technologies such as Angular [18] and Bootstrap [19] aims to enable software developers to quickly put together web based visual analysis components by providing easy customization mechanisms [17]. Visuall comes with many state-of-the-art visualization mechanisms from built-in integration and query support for Neo4j databases to complexity management support to time-based visual analysis. It also supports various automatic layout algorithms through Cytoscape.js extensions.
III. HYDRA METHODS AND FEATURES
Hydra is a web based software built on Visuall for visual graph based analysis of financial transaction data to especially verify or detect fraudulent activities (Fig. 2). Even though the tool can be easily modified to work with any kind of transaction based data, within the scope of this paper we will present and illustrate the features of Hydra with an application for financial transactions of a prepaid card.
Fig. 2. Hydra architecture.
A. Hydra Data Model and Setup
A sample Hydra graph model contains the following object types, which could be easily modified:
● Customer: A customer of a financial firm with a unique identifier. Some useful properties of a customer include their activation date and address. ● Account: Each customer is to have at least one account to be able to acquire a prepaid card. Each account is to have a unique identifier, and other useful properties such as an activation date. ● Card: A prepaid card associated with an account.
Each card is to have a unique identifier, and other useful properties such as an activation date. ● Dealer: Dealers are authorized sellers of prepaid
cards. They also can perform certain types of transactions on these prepaid cards. Each dealer is to have a unique identifier and other useful properties such as address.
● Merchant: Stores where these prepaid cards may be used for purchases. Each merchant is to have a
unique identifier along with other useful properties such as address and category.
Edges in Hydra’s graph model are of two types:
ownership relations and financial transactions.
● A Customer owns an Account ● An Account owns a Card ● A Dealer sells a Card ● A Card is used at a Merchant ● A Card is credited by a Dealer ● A Card is credited by an Account ● A Card is refunded by an Account ● A Card is refunded by a Merchant ● A Card transfers funds to another Card
Each transaction edge is to have a date and an amount (including currency when applicable). Other useful transaction edge properties include a status (whether it was successful or not) and a channel (through what channel the transaction was performed).
Through Visuall’s application description file (a JSON file), this graph model can be described rather quickly. We assume a server side central graph database such as a Neo4j instance is being fed with such data on a regular basis, and fraud operators are able to access this database through Hydra within their browsers.
B. Rule Based Database Queries
A usual way to access the data in the database is through rule based queries. Hydra inherits Visuall’s built-in query component which allows nested (using logical operators) advanced rules for querying the database.
Fig. 3 shows an example query to find all dealers in Ankara which sold more than 1000 cards.
Fig. 3. An example query using the logical operator AND to form
a more complex rule to query the database.
This query could be constrained to a limited time (say during the last 24 hours) either by adding additional conditions or simply changing the global parameter “Limit database queries to time range” under Settings to these specific dates. Such a high and unusual number of transactions within a short amount of time is one simple way to detect suspicious activities.
These rules could be formed in any level of nesting (through logical operators AND and OR) and could be persisted for use on a regular basis.
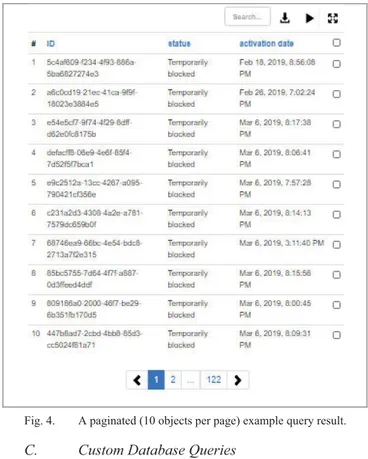
Results of a query to the Neo4j database may be either directly displayed as a graph (with an option to merge and highlight the results to the existing network), which is automatically laid out before rendered, or could be first listed in a table with pagination (Fig. 4). Without pagination, large query results might result in loss of interactivity with the tool as automatic layout of query results might take rather long. Tables in Hydra are searchable and entries may be ordered by a field of user’s choice. The results may also be persisted on disc as comma separated values.
Fig. 4. A paginated (10 objects per page) example query result.
C. Custom Database Queries
Graph queries described in the previous section come out of the box with Visuall . This library also allows users to implement their own graph queries to the database through Cypher or via a Java program with an API to the Neo4j database. In the sample application of Hydra, we implemented many custom queries as exemplified below:
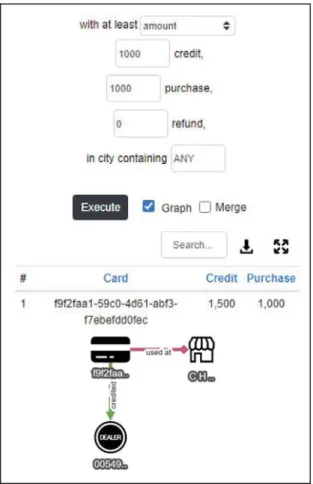
● Transactions by Cards: This custom query allows the user to query the transactions with a specified amount / count of a prepaid card during a certain time period. The user might like to search the entire database for such cards or instead specify the cards to consider. For instance, one might query only refunds from a specific group of cards with amounts more than 1000 TL during last week.
Fig. 5. An example transaction query to find all cards with
1000TL or more usage within a specified day. In this example,
the result contains two such cards and the details of the usage of one such card is inspected through an Object inspector.
● Cards with High Activity: This custom query combines multiple types of activities with specific counts / amounts as well as an address city. So, the user could for instance query all cards which were credited at least 100 times during the past month and got refunds at least 50 times in Ankara.
Fig. 6. An example query to identify all cards which were
credited at least 1000TL and spent at least the same amount
during the same day (which was set in a separate tab). The
result does contain such a card as displayed. D. Time Based Client Side Analysis
Another component Hydra directly inherits from Visuall is its timebar, which is a component designed for time-based filtering and analysis of graph-based information. Main capabilities of the time bar are filtering graph objects based on their lifetimes, and showing the transaction network evolving over a specified time range.
Hydra customizes the timebar to filter transactions based on their timestamps and allows the user to investigate suspicious activities during specific intervals. For instance, Fig 7. shows a prepaid card transaction network over a specific time period, displaying network size as statistics.
Fig. 7. A prepaid card transaction network shown weekly for the
weeks of November 12, 19, and 26.
E. Graph Theoretic Client Side Analysis
Hydra facilitates analysis of financial networks through graph theoretic properties [20]. The users could choose one of the following to display a particular graph theoretic property of each individual object in the network:
● Degree centrality ● Closeness centrality
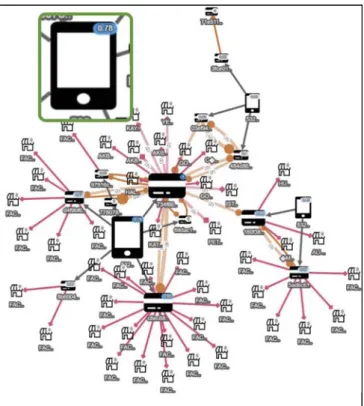
Values calculated with all these types of properties could be normalized if desired. An example network where an account with a high degree centrality can be easily identified through visualization (Fig. 8). Such an account might be playing a key role in fraudulent activities, requiring further investigation.
Fig. 8. An example where normalized degree centrality of the
network was calculated to determine relatively more important /
involved entities in the network. The nodes are resized with respect to
their score to enhance easy comprehension. F. Customizing Hydra
Hydra inherits its packaging structure from Visuall, which puts all custom content in a single specialized directory. It also provides a convenient mechanism to modify the data model (what nodes/edges should be in our model and what properties these graph objects should have). Using a so-called application description file, the developer may not only define their data model but also automatically get the functionality of most of the components presented earlier based on this model. Through this file the look and feel of the user interface from tool name and logo to context menus and tabs could easily be tailored for a specific application as well.
Hence, Hydra could easily be “cloned” to create another financial transaction application for performing similar analysis activities.
IV. DISCUSSION AND FUTURE WORK
Hydra is an easily customizable and web based tool for visual fraud analysis that works on modern browsers without requiring any installation. With state-of-the-art visualization libraries behind it, Hydra enables fraud operators to quickly gain insight into indirect relations in financial transaction networks, and detect or verify fraudulent activities.
As we test Hydra, we discover many potential ways to help detect fraudulent activities and we plan to implement these as custom queries in the future. Some examples of these include:
● Identify all cards performing a high amount / count of credit transactions followed by high amount / count of usages within a limited amount of time
● Identify all cards with a high number of unsuccessful transactions within a limited amount of time
● Identify all cards performing a high amount / count of transactions at a high number of merchants within a limited amount of time
Alternative way to querying the graph database via rules is the graph based queries. We plan to adapt the common stream and graph of interest queries used in the context of biological pathways [13]. Example usages of these queries includetransfers to a common card : Here the goal is to see if there is a common target card where the fraud money gets collected. To query this situation, we can find all common cards in the downstream of a group of cards known to be fraudulent or suspicious.
Another particular major area of improvement for Hydra is the use of machine learning. Recent machine learning methods such as graph convolutional networks [6][7] could be used to predict potential fraud customers / cards based on fraud scores available for a number of existing customers / cards.
ACKNOWLEDGMENT
The work of the Bilkent team was supported in part by Turkcell Teknoloji Research & Development Inc.
REFERENCES
[1] Association of Certified Fraud Examiners, “The 2018
Report to the Nations on Occupational Fraud and Abuse”, 2018.
[2] R.K. Kaliyar, "Graph databases: A survey," International
Conference on Computing, Communication & Automation, Noida, pp. 785-790, 2015.
[3] G. Arnold, “5 Reasons Why Images Speak Louder Than
Words,”
https://www.linkedin.com/pulse/5-reasons-why-images-speak-louder-than-words-gabe-arnold/, last accessed September 15, 2020.
[4] R. Bolton and D. Hand, “Statistical fraud detection: A
review,” Statistical Science 17 (3), pp. 235-255, 2002.
[5] A.M. Al-Khatib, "Electronic Payment Fraud Detection
Techniques". World of Computer Science and Information
Technology Journal. 2(4), pp. 137, 2012.
[6] T.N. Kipf, and M. Welling, “Semi-supervised classification
with graph convolutional networks,” in 5th International Conference
on Learning Representations (ICLR-17), 2016.
[7] J. Jiangyz et al., “Anomaly Detection with Graph
Convolutional Networks for Insider Threat and Fraud Detection”, 2019 IEEE Military Communications Conference (MILCOM), 2019.
[8] law.com, “Legal Dictionary: fraud", last accessed
September 15, 2020.
[9] A. Dal Pozzolo, O. Caelen, Y. Le Borgne, S. Waterschoot
and G. Bontempi, “Learned lessons in credit card fraud detection
from a practitioner perspective,” Expert systems with applications,
41(10), pp. 4915–4928, 2014.
[10] “Data analysis techniques for fraud detection”,
https://en.wikipedia.org/wiki/Data_analysis_techniques_for_fraud_de tection, last accessed September 15, 2020.
[11] D. Dominguez-Sal et al., “Survey of Graph Database
Performance on the HPC Scalable Graph Analysis Benchmark,” International Conference on Web-Age Information Management, WAIM 2010: Web-Age Information Management, pp 37-48, 2010.
[12] R. Angles and C. Gutierrez, "Survey of graph database
models," ACM Computing Surveys, 40(1), pp. 1–39, 2008.
[13] U. Dogrusoz, A. Cetintas, E. Demir and O. Babur,
"Algorithms for Effective Querying of Compound Graph-Based Pathway Databases," BMC Bioinformatics, 10:376, 2009.
[14] “Neo4j Graph Database”, https://neo4j.com/. Neo Technology, last accessed September 15, 2020.
[15] “DB-Engines Ranking of Graph DBMS”.
https://db-engines.com/en/ranking/graph+dbms. DB-Engines, last accessed September 15, 2020.
[16] M. Franz, C.T. Lopes, G. Huck, Y. Dong, O. Sumer, G.D. Bader, “Cytoscape.js: a graph theory library for visualisation and analysis,” Bioinformatics, 32 (2), pp.309-311, 2016.
[17] “Visuall: instantly build visual network analysis components”, https://bit.ly/3mVaGjk, i-Vis Research Lab, Bilkent University, 2020.
[18] “Angular: One framework. Mobile & desktop,”
https://angular.io/, last accessed September 15, 2020.
[19] “Build fast, responsive sites with Bootstrap,”
https://getbootstrap.com/, last accessed September 15, 2020.
[20] L. Freeman, “A set of measures of centrality based on