https://doi.org/10.1177/1534735419876334 Integrative Cancer Therapies Volume 18: 1 –12
© The Author(s) 2019 Article reuse guidelines: sagepub.com/journals-permissions DOI: 10.1177/1534735419876334 journals.sagepub.com/home/ict
Creative Commons Non Commercial CC BY-NC: This article is distributed under the terms of the Creative Commons Attribution-NonCommercial 4.0 License (http://www.creativecommons.org/licenses/by-nc/4.0/) which permits non-commercial use, reproduction and distribution of the work without further permission provided the original work is attributed as specified on the SAGE and Open Access pages (https://us.sagepub.com/en-us/nam/open-access-at-sage).
Research Article
1Bezmialem Vakif University, Istanbul, Turkey
2Advanced Research and Application Center of Traditional and
Complementary Medicine, Istanbul, Turkey
3Uludag University, Bursa, Turkey 4Medipol University, Istanbul, Turkey
Corresponding Author:
Abdurrahim Kocyigit, Department of Medical Biochemistry, Medical Faculty, Bezmialem Vakif University, Fatih/Istanbul 34093, Turkey. Email: [email protected]
Quercus pyrenaica Honeydew Honey
With High Phenolic Contents Cause
DNA Damage, Apoptosis, and Cell Death
Through Generation of Reactive Oxygen
Species in Gastric Adenocarcinoma Cells
Abdurrahim Kocyigit, MD, PhD
1,2, Gokhan Aydogdu
3, Ezgi Balkan, MSc
1,
Vildan Betül Yenigun, PhD
1, Eray Metin Guler, PhD
1, Huri Bulut, PhD
1,
Fatmanur Koktasoglu, PhD
1, Ahmet Ceyhan Gören, PhD
1,
and Ali Timucin Atayoglu, MD, PhD
4Abstract
Many studies have shown that honey with high phenolic contents prevents cancer formation. Furthermore, recent studies have demonstrated that honey can be used for the treatment of cancer as well as cancer prevention. Antineoplastic effects of honey are often associated with their antioxidant phenolic contents. However, very few studies have dealt with the association of phenolic contents of honeys in terms of antiproliferative effects. The aim of this study was, therefore, to elucidate the cytotoxic, genotoxic, apoptotic, and reactive oxygen species (ROS) generating effects of honey samples on the basis of their phenolic and flavonoid contents. Fourteen different honey varieties were collected from various parts of Turkey, and their characteristics regarding total phenols, flavonoids, and antioxidant contents were determined to test their effects on gastric cancer cells (AGS). For convenience, 2 honey varieties were selected, namely, Ida Mountains Quercus pyrenaica honeydew honey (QPHH-IM) having the highest phenolic and antioxidant content and Canakkale multifloral honey (MFH-C) with the lowest phenolic and antioxidant content. Levels of 11 different phenolic compounds in QPHH-IM and MFH-C samples were determined by LC-MS/ MS. AGS cells were incubated with different concentrations of QPHH-IM and MFH-C for 24 hours, then the cell viability, DNA damage, apoptosis, and generation of ROS were determined. We found that QPHH-IM had more cytotoxic, genotoxic, and apoptotic effects than that of MFH-C. We think that these effects are probably related to pro-oxidant activities due to the high phenolic contents present. Therefore, further research on high-phenolic honey may contribute to the future development of cancer therapeutics.
Keywords
Quercus pyrenaica, honey, gastric carcinoma, apoptosis, DNA damage, reactive oxygen species, apitherapy Submitted March 13, 2019; revised July 11, 2019; accepted August 7, 2019
Introduction
Gastric cancer (GC) is one of the most common cancer types and an important health problem as the second
lead-ing cause of cancer death worldwide.1 Adenocarcinoma is
the most common type in approximately 90% of diagnosed GC cases. Given the current limitations in chemotherapy, radiotherapy, and surgical treatment, there is an increasing interest in complementary/alternative medicine approaches
for gastric and other types of cancer.2 The most important concern with anticancer drugs is their toxicity as side effects after treatments. However, natural compounds have been considered to be less toxic.
Honey is a natural product of honey bees, Apis
mel-lifera. Honeydew honey (HH) is a type of honey obtained
from the excretions of plant-sucking insects found on liv-ing parts of the plant or from their secretions from the
living parts of plants.3 Polyphenolic compounds and
phe-nolic acids found in honey vary according to geographical and climatic conditions. Some of these compounds have been reported as a specific marker for the botanical origin
of honey.4 Due to its geographic location and ideal
cli-matic conditions, Turkey is one of the most important producers of honey in the world.
Recently, honey has been tested and approved for its functional and biological properties such as antioxidant, anti-inflammatory, antibacterial, antiviral, anti-ulcer activities as well as antilipidemic and anticancer
proper-ties.5 In particular, the antioxidant properties of honey
were shown to contribute to the prevention of various acute and chronic disorders such as diabetes,
inflamma-tory disorders, and cancer.6 Phenolic acids and flavonoids
are responsible for the antioxidant activity of honey.6
Flavonoids are well known to have antineoplastic effects
due to their ability to scavenge free radicals.7 However, in
recent years, researchers have focused on antiprolifera-tive, genotoxic, and apoptotic effects as well as antioxi-dant and antineoplastic properties of honey. Antiproliferative effects have been demonstrated in a
variety of cancer cell lines and tissues such as breast,8
colorectal, prostate, endometrial, and oral cancer.9
Furthermore, polyphenolic compounds in honey have also been considered to be one of the main factors respon-sible for the antiproliferative activity. However, the mechanisms of these opposite effects and their relation to the type and polyphenolic contents of honeys have not been elucidated in detail.
The aim of this study was to investigate the cytotoxic, genotoxic, apoptotic, and reactive oxygen species (ROS) generating effects of 2 different honey samples that were selected on the basis of their phenolic and flavonoid con-tents on GC cells.
Materials and Methods
Honey Samples
Fourteen different honey samples derived from chestnut, pine, cedar, oak, and multifloral were obtained from honey manufacturers from different regions of Turkey in 2018. The honey samples were stored at 4°C in the dark until analyses and dissolved with distilled water just before use for the biochemical and molecular analysis.
Chemicals
Human AGS cells were purchased from the American Type Culture Collection (ATCC; Manassas, VA). Fetal bovine serum, penicillin-streptomycin (10 000 U/mL), 0.25% tryp-sin-EDTA, and phenol red were supplied by Life Technologies (Carlsbad, CA). Ham’s F-12K (Kaighn’s) medium was obtained from Gibco/Invitrogen Corporation (Carlsbad, CA). Bax, Bcl-2, caspase-3, and P-53 primer antibodies were provided by Santa Cruz Biotechnologies (Santa Cruz, CA), and ATP-Glo cell viability assay kit was provided by Promega (Madison, WI). Other chemicals such
as 2′,7′-dichlorodihydrofluorescein-diacetate (DCFH2-DA),
ethidium bromide (EB), acridine orange (AO), ninhydrin,
acetic acid, aluminum chloride (AlCl3), cadmium chloride
hemi (pentahydrate), (+)-catechin, methanol sodium hydrox-ide (NaOH), gallic acid, L-leucine,
2,4,6-tripyridyl-S-tri-azine (TPTZ), sodium nitrite (NaNO2), potassium persulfate
(K2SO4), ferric chloride (FeCl3), sodium chloride (NaCl),
sodium carbonate (Na2CO3), ammonium ferrous sulfate,
phosphoric acid (H3PO4), Coomassie Brilliant Blue, and
2,2′-azinobis-(3-ethylbenzothiazoline-6-sulfonate) (ABTS) were purchased from Sigma-Aldrich Chemie GmbH (Steinheim, Germany). Chloroform, acetone, and methanol were purchased from Merck (Darmstadt, Germany). Standards in liquid chromatography–tandem mass spec-trometry (LC-MS/MS) analysis were caffeic acid (98%, Sigma-Aldrich), p-coumaric acid (98% Sigma Aldrich), kaempferol (99%, Sigma-Aldrich), penduletin (95%, Supelco), apigenin (95%, Sigma-Aldrich), acacetin (95%, Sigma-Aldrich), luteolin (95%, Sigma-Aldrich), diosmetin (95%, Sigma-Aldrich), nepetin (98%, Supelco), taxifolin (85% Sigma-Aldrich), and eupatilin (98%, Sigma-Aldrich).
Determination of Total Polyphenol, Flavonoid,
Antioxidant, Glucose, and Fructose Contents of
Honey Samples
The Folin-Ciocalteu method10 was used to determine total
phenolic content of honey samples. One gram of honey sam-ple was dissolved in 10 mL of distilled water and filtered through filter paper. Fifty microliters of filtered honey sample and 250 µL of 0.2 N Folin-Ciocalteu reagent was mixed with vortex and kept for 5 minutes at room temperature. Then, it
was mixed with 200 µL of 0.7 mol L−1 Na
2CO3. After
incuba-tion at room temperature for 2 hours, the absorbance of the reaction mixture was measured at 760 nm against a blank using a Varioskan Flash Multimode Reader (Thermo
Scientific, Waltham, MA). Gallic acid (0-300 mg L−1) was
used as standard to produce the calibration curve. The mean of 3 readings was used, and the total phenolic content was expressed in mg of gallic acid equivalents per100 g honey.
The total flavonoid content of the honey samples was deter-mined according to colorimetric assay method developed by
Zhishen et al.11 Fifty microliters of filtered honey samples was
mixed with 250 µL of distilled water and 15 µL of a 5% NaNO2
solution. After 6 minutes, 30 µL of 10% AlCl3 solution was
added, then 100 µL 1 mol L−1 NaOH was added, and the
solu-tion was incubated for a further 5 minutes at room temperature. The reaction mixture was mixed well, and the intensity of the red flavonoid-aluminum complex was measured at 510 nm using a Varioskan Flash Multimode Reader (Thermo Scientific). A standard curve of catechin was drawn within a concentration range of 5 to 50 mg/L. Total flavonoid content was expressed as mg of (+)-catechin equivalents per 100 g of honey.
The total antioxidant capacity was determined according
to the photometric method developed by Erel.12 Briefly, 1 g
of honey sample was dissolved by stirring in 1 mL of dis-tilled water and then 5 µL of sample was added to 500 µL of
ABTS+ reagent. The mixture was incubated at room
tem-perature for 90 seconds, and the color inhibition of the
ABTS+ radical was measured at 734 nm using a Varioskan
Flash Multimode Reader (Thermo Scientific). Results were expressed in mmol trolox equivalents per 100 g of honey.
The amount of glucose present in honey samples was determined using the commercial kit working with the glu-cose oxidase method (Abbott Diagnostics, Lake Forest, IL). For measurement, 5 µL of sample or standard was mixed with 500 µL of reagent and incubated for 10 minutes at 37°C. The absorbance of the samples or standards was read against a blank within 60 minutes at 520 nm using a Multimode Reader (Varioskan Flash, Thermo Scientific).
Fructose levels in honey samples were measured by
pho-tometric method.13 For the samples solution, 0.2 mL of
res-orcinol reagent was added to the honey sample and mixed well. Then, 0.2 mL of dilute HCl was added to it. For the
standard solutions, 0.4, 0.6, 0.8, and 1.0 mg mL−1 fructose
were prepared in 0.2 mL resorcinol and 0.2 mL of diluted HCl. The blank consisted of 0.2 mL resorcinol and 0.2 mL of diluted HCl. The standard, blank, and the sample tubes were incubated in a water bath at 80°C for about 10 min-utes, and then the tubes were removed from the water bath and cooled down with tap water for 5 minutes. It was then read against the blank at 520 nm in 30 minutes using the Varioskan Flash Multimode Reader (Thermo Scientific).
Measurement of Phenolic Contents of Honeys
by High-Performance LC-MS/MS
Ten grams of honey samples were extracted with 3 × 40 mL
n-BuOH-water-CHCl3. After the separation of phases, the
organic phase was collected and evaporated until dryness. The residue was weighed to 10 mL in a volumetric flask and dissolved in 5 mL of MeOH in ultrasonic bath. Then, 100 µL of curcumin solution (from 100 ppm stock solution) was added as an internal standard and diluted to the volume with mobile phase, mixed and warmed to get a clear solution. The solution was filtered through a 0.45-µm Millipore
Millex-HV filter, and the final solution (1 mL) was trans-ferred into a capped auto sampler vial, from which 10 µL of sample was injected to LC for each run. The samples in the
auto sampler were kept at 15°C during the experiment.14,15
LC-MS/MS experiments were performed on a Zivak Multitasker and Zivak Tandem Gold Triple quadrupole (Istanbul, Turkey) mass spectrometer equipped with a Fortis C18 column (150 × 3.0 mm id, 5 µm particle size). The mobile phase was composed of water (A, 0.1% formic acid) in water (B, 0.1% formic acid in methanol), the gradient program of which was 0 to 1.00 minute 70% A and 30% B, 1.01 to 20.00 minutes 100% B, and finally 20.01 to 25.00 minutes 70% A and 30% B. The flow rate of the mobile phase was 0.30 mL/min, and the column temperature was
set to 30°C. The injection volume was 10 µL.15,16
The best mobile phase solution was determined to be a gradient of acidified methanol and water system. Such a mobile phase was found to be satisfactory for the ionization abundance and separation of the compounds. The best ion-ization of small and relatively polar antioxidants was
obtained by electrospray ionization (ESI) source.16,17 The
optimum ESI parameters were determined as 2.40 mTorr CID gas pressure, 5000.00 V ESI needle voltage, 600.00 V ESI shield voltage, 300.00°C drying gas temperature, 50.00°C API housing temperature, 55 psi nebulizer gas pressure, and 40.00 psi drying gas pressure.
During the validation experiments, curcumin was used as an internal standard. The validation parameters consisted of linearity, repeatability, recovery, limit of detection, and limit of quantification experiments. The linearity for each compound for the reported method was determined by ana-lyzing standard solutions (discussed later). A detailed meth-odology of uncertainty evaluations are available in the
literature.15,16
Cell Culture Studies
Quercus pyrenaica Honeydew Honey from Ida Mountains
(QPHH-IM) and multifloral honey from Canakkale (MFH-C) possessing the highest and lowest phenolic, flavonoid, and antioxidant contents, respectively, were selected from 14 honey types, and cytotoxic, genotoxic, apoptotic, and ROS generating effects were tested on AGS cells via in vitro cell culture studies.
Human AGS cells are commonly used as a GC model for human stomach research. These cells were cultured in Ham’s F-12 (Kaighn’s) medium. In our study, the medium was supplemented with 10% fetal bovine serum and antibi-otics (100 U/mL penicillin, 100 µg/mL streptomycin). The cells were incubated at 37°C in a humidified atmosphere of
5% CO2. When the cells became almost confluent in 75 cm2
plastic flasks, they were harvested weekly. For the experi-ments, the AGS cells were plated in a 96-well plate at a
density of 15 × 103 cells mL−1 and a 6-well plate at a density
of 18 × 104 cells mL−1.
Cell Viability Assay
Cell Titer-Glo Luminescent Cell Viability Test Kit (Promega) was used to measure cell viability level. This method deter-mines the degree of cell viability in proportion to the amount
of ATP. For analysis, AGS cancer cells (1.5 × 10³ cells well−1)
were plated on 96-well plates. After 24 hours, the cells were incubated with different concentrations (range = 0.25% to 5% w/v) of QPHH-IM and MFH-C. After incubation, the luciferin derivative and cell lysis solution were added as sub-strates. The luciferin derivative converts a light signal pro-portional to the current amount of ATP. Luminescence was measured using a Varioskan Flash Multimode Reader (Thermo Scientific) and normalized to control.
Intracellular Reactive Oxygen Species
Measurement
The intracellular ROS production levels were measured by fluorometric method using a probe,
2′,7′-dichlorofluores-cein diacetate (H2DCF-DA, Sigma, MO). Cells (1.5 × 10⁵
cells/well) were seeded in each well of 96 wells. After 24 hours, they were treated with QPHH-IM and MFH-C at dif-ferent concentrations (0.25% to 5%) and incubated for another 24 hours. The cells were washed with
phosphate-buffered saline (PBS) and incubated with 5 µM H2DCF-DA
for 30 minutes at 37°C in the dark. The cells were then washed, resuspended in PBS, and measured for the ROS contents using a fluorimeter (Varioskan Flash Multimode Reader, Thermo Scientific) and normalized to control.
Genotoxicity Assay
Alkaline single cell gel electrophoresis assay (Comet Assay) was carried out with a slight modification of the method of
Singh et al18 to assess the genotoxic effects of honey on AGS
cells. AGS cells were plated on 6-well cell culture plates
(approximately 2 × 10⁵ cells per well) containing cell culture
medium and incubated at 37°C in 5% CO2 for 24 hours.
Then, the honey samples below IC50 (50% inhibitory)
con-centrations were added and incubated for another 24 hours. Cells were rinsed with PBS after incubation, collected using trypsin/EDTA for 4 minutes at 4°C, and centrifuged at 400g for 5 minutes at 4°C. The cells were rinsed with PBS after incubation, collected using trypsin/EDTA, and centrifuged at 400g for 5 minutes at 4°C. The supernatant was drained, and
the cell density was adjusted to 2 × 10⁵ cells/mL using cold
PBS. Ninety microliters of 0.6% low melting point agarose and 10 µL cell suspension were mixed and placed on 1% nor-mal melting point agarose precoated slides. They were allowed to solidify on a cold tray for a few minutes, and the
slides were then placed in lysis buffer, pH 10 (1% Triton
X-100, 2.5 M NaCl, 10 mmol L−1 Tris, 0.1 mol L−1 EDTA,
Sigma-Aldrich) for 1 hour on ice in dark conditions. The slides were then incubated in alkaline solution (0.3 M NaOH, 1 mM EDTA, Sigma-Aldrich) for 40 minutes at dark condi-tions in the presence of cooling blocks to unwind the DNA. Electrophoresis was performed at 0.72 V/cm (26 V, 300 mA) for 25 minutes at 4°C. The slides were neutralized in Tris buf-fer (0.4 M Tris, pH = 7.5) for 5 minutes and then dehydrated with ethanol before staining. The slides were then stained
with EB (2 µg/mL in distilled H2O, 70 µL/slide), coated with
a coverslip, and scored with a fluorescence microscope (Leica DM 1000, Solms, Germany) using the Comet assay IV software (Perceptive Instruments, Suffolk, UK).
Measurements of Apoptosis Indicators
Acridine orange/EB are DNA-specific dyes. AO/EB double
staining was developed by McGahon et al.19 The cells
undergoing apoptosis are differentiated from the viable cells by the morphological changes of apoptotic nuclei. AO and EB are DNA-intercalating dyes. AO is taken up by both living and dead cells and stains double-stranded and
single-stranded nucleic acids.20 AO spreads green fluorescence on
stimulation at 480 to 490 nm from live cells while being
diffused into dsDNA. Briefly, 2 × 10⁵ cells/well were seeded
in 6-well plates and incubated for 24 hours. Then, the honey
samples below IC50 concentrations were added and
incu-bated for another 24 hours. Following honey treatment, the cells were collected and washed with PBS followed by staining with 1:1 mixture of AO/EB (100 µg/mL). Triplicate samples of 100 cells each were counted and scored for the incidence of apoptotic chromatin condensation using a fluo-rescent microscope (Leica DM 1000, Solms, Germany).
Immunoblotting Analysis
AGS cancer cells were seeded on 6-well plates at 1.5 × 10⁵ cells
per well and incubated for 24 hours. They were then treated
with honeys according to their IC50 values. After 24 hours of
incubation, the cells were harvested and prepared in NP-40 cell lysis buffer (2 mM Tris-HCl pH 7.5, 150 mM NaCl, 10% glyc-erol, and 0.2% NP-40 plus a protease inhibitor cocktail) for 30 minutes on ice and centrifuged at 14 000 × g (Beckman Coulter, Krefeld, Germany) for 10 minutes at 4°C. The final supernatant was then used as the cytosolic fraction. The protein concentra-tion of the supernatant was determined using the Bradford
pro-tein assay method.21 Proteins from cellular supernatants were
separated on 8% to 10% polyacrylamide gel and transferred to a nitrocellulose membrane using the Trans-blot SD semiperme-able electrophoretic transfer cell (Bio-Rad, Hercules, CA). Tris-HCl buffered saline with Tween 20 (TBST) with 5% nonfat milk were used for blocking the membrane. The primary
were used after a night incubation (4°C). All samples were also blotted for β-actin to normalize protein amounts. TBST was used for washing the membrane and incubated with horseradish peroxidase–conjugated secondary antibodies (Cell Signaling Technology, Danvers, MA) for another hour. Immunolabelled proteins were visualized with Pierce ECL Western staining sub-strate (Thermo Scientific) and captured with an imaging system (Vilber Lourmat Sté, Collégien, France).
Statistical Data Treatment
The experiments were repeated 3 times, and the results were expressed as mean value ± standard deviation (mean ± SD). Statistical evaluation was performed using analysis of variance (1-way ANOVA). Differences with a probability value of P <
.05 were considered statistically significant. IC50 values of
honeys over the cell lines were calculated by nonlinear regres-sion analysis. The statistical analysis was performed by using Statistical Package for Social Sciences (SPSS) version 21.
Results
Total Phenol, Flavonoids, Antioxidant, and
Carbohydrate Contents
Total phenol and flavonoid contents of 14 different honey samples were compared in terms of phenol, flavonoid, and antioxidant content as well as glucose and fructose. From the different honey types, QPHH-IM showed the highest activity while MFH-C showed the lowest activity (Table 1). Hence, these 2 honey types were selected for further analysis.
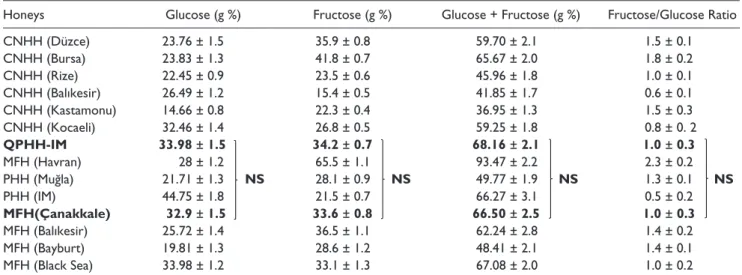
Sugar is known to affect cell proliferation. Therefore, glu-cose and fructose contents of all honeys were also measured to exclude the possible effects of sugar on the cells. The results of the glucose and fructose contents and fructose/glucose ratios of the honey samples are presented in Table 2.
As shown in Table 2, there was no significant difference in terms of glucose and fructose levels between QPHH-IM and MFH-C; these honey types exhibited the highest and lowest phenolic contents (Table 1).
Eleven different phenolic compound levels of QPHH-IM and MFH-C samples were determined by LC-MS/MS method, and related data are shown in Table 3. Detailed information on method validation and uncertainty evalua-tion, LC-MS/MS parameters, and representative chromato-grams for QPHH-IM and MFH-C samples are given in supplementary material (Supplement 1, available online).
As seen from Table 3, of the 11 phenolic compounds, only 2 phenolic compounds were found in light-colored MFH-C above the detection limit, while in dark-looking QPHH-IM only eupatilin levels were below the detection limit. Hence, these 2 honey types were selected for further analysis. Salicylic acid level was 14-fold higher, and acacetin level was 3-fold higher in QPHH-IM than in MFH-C samples.
Cell Viability Assessment
The cell viability test was performed with AGS cells for 24 hours to evaluate the effect of QPHH-IM and MFH-C on cell growth. After incubation, the cytotoxic effect of honey was measured by ATP cell viability test. When cell viability of the control cells was accepted as 100%, the cell viability increased
Table 1. Total Phenol and Flavonoid Contents and the Antioxidant Capacity for 14 Different Honey Samples. Ida Mountains Quercus
pyrenaica Honeydew Honey (QPHH-IM), Chestnut Honeydew Honey (CNHH), Pine Honeydew Honey (PHH), Multifloral Honey
(MFH).
Honeys Total Phenolic Content (mg GAE/100 g) Total Flavonoid Content (mg QE/100 g) Total Antioxidant Capacity (Inhibition of ABTS %)
CNHH (Düzce) 79.96 ± 6.02 45.39 ± 4.80 85.96 ± 0.35 CNHH (Bursa) 89.52 ± 5.51 48.38 ± 8.00 86.75 ± 0.36 CNHH (Rize) 84.50 ± 4.01 46.52 ± 3.12 85.81 ± 0.22 CNHH (Balıkesir) 75.36 ± 5.10 48.43 ± 5.95 85.73 ± 0.19 CNHH (Kastamonu) 98.83 ± 10.15 53.59 ± 3.02 86.07 ± 0.15 CNHH (Kocaeli) 76.36 ± 6.15 46.31 ± 4.85 85.66 ± 0.29 QPHH-IM 115.41 ± 9.95* 77.36 ± 7.25* 89.36 ± 0.16* MFH (Havran) 90.36 ± 4.15 47.37 ± 4.95 85.98 ± 0.05 PHH (Muğla) 77.63 ± 7.51 45.16 ± 5.01 85.71 ± 0.18 PHH (IM) 78.40 ± 6.95 49.84 ± 4.65 86.07 ± 0.24 MFH (Çanakkale) 67.66 ± 2.87 42.69 ± 2.71 84.09 ± 0.20 MFH (Balıkesir) 74.36 ± 3.95 54.25 ± 4.15 88.23 ± 0.17 MFH (Bayburt) 88.36 ± 3.95 52.84 ± 2.61 88.68 ± 0.06 MFH (Black Sea) 75.36 ± 5.00 48.13 ± 3.95 88.39 ± 0.05
*The significant difference between total phenol, flavonoid and antioxidant contents of QPHH-IM and MFH. Honey samples with highest and lowest phenolic, flavonois and antioxidant contents demonstrated with boldface.
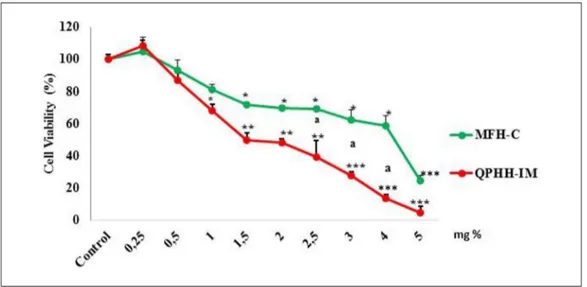
to 108% at a concentration of 0.25% relative to the control 24 hours after addition of the honeys. At doses above this con-centration, cytotoxic activity increased in a concentration-dependent manner (P < .001). Higher doses of QPHH-IM resulted in greater cellular death than in MFH-C in AGS cells
(P < .05). The IC50 concentrations were calculated as 17 and
45 mg/mL (1.7% and 2.5% w/v) for the QPHH-IM and for the MFH-C in AGS cells, respectively (Figure 1). These data indi-cate that both QPHH-IM and MFH-C have proliferative effects at lower concentrations; on the other hand, QPHH-IM with high phenolic content was more cytotoxic than MFH-C with low phenolic content at their higher concentration.
Reactive Oxygen Species Generation Assessment
We measured intracellular ROS formation by fluorometricmethod using the H2DCF-DA probe. Low dose of honey
samples (0.25%) decreased the intracellular ROS produc-tion in cancer cells (P < .05). However, ROS producproduc-tion significantly increased at higher doses of the samples (1.5% for QPHH-IM and 5% for MFH-C [Figure 2]).
There were close negative relationships between cell viability and ROS generating activity in both honeys (r = −0.839, P < .001, for QPHH-IM and r = −0.853, P < .001, for MFH-C in AGS cells).
Genotoxic Assessment
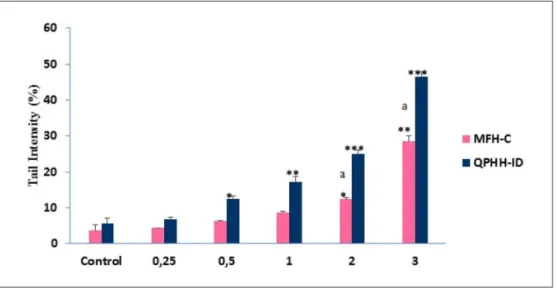
For DNA damage analysis, AGS cells were treated with dif-ferent doses of honey samples for 24 hours and the DNA damage was measured via the Comet Assay method. Damaged DNA appears in a bright head and comet, while undamaged DNA appears to be only round. After incuba-tion, the % tail intensity significantly increased with the
Table 2. Glucose, Fructose, Fructose + Glucose Levels in 100 g Honey Samples and Fructose/Glucose Ratio of the Samples.
Honeys Glucose (g %) Fructose (g %) Glucose + Fructose (g %) Fructose/Glucose Ratio
CNHH (Düzce) 23.76 ± 1.5 35.9 ± 0.8 59.70 ± 2.1 1.5 ± 0.1 CNHH (Bursa) 23.83 ± 1.3 41.8 ± 0.7 65.67 ± 2.0 1.8 ± 0.2 CNHH (Rize) 22.45 ± 0.9 23.5 ± 0.6 45.96 ± 1.8 1.0 ± 0.1 CNHH (Balıkesir) 26.49 ± 1.2 15.4 ± 0.5 41.85 ± 1.7 0.6 ± 0.1 CNHH (Kastamonu) 14.66 ± 0.8 22.3 ± 0.4 36.95 ± 1.3 1.5 ± 0.3 CNHH (Kocaeli) 32.46 ± 1.4 26.8 ± 0.5 59.25 ± 1.8 0.8 ± 0. 2 QPHH-IM 33.98 ± 1.5 34.2 ± 0.7 68.16 ± 2.1 1.0 ± 0.3 MFH (Havran) 28 ± 1.2 65.5 ± 1.1 93.47 ± 2.2 2.3 ± 0.2 PHH (Muğla) 21.71 ± 1.3 NS 28.1 ± 0.9 NS 49.77 ± 1.9 NS 1.3 ± 0.1 NS PHH (IM) 44.75 ± 1.8 21.5 ± 0.7 66.27 ± 3.1 0.5 ± 0.2 MFH(Çanakkale) 32.9 ± 1.5 33.6 ± 0.8 66.50 ± 2.5 1.0 ± 0.3 MFH (Balıkesir) 25.72 ± 1.4 36.5 ± 1.1 62.24 ± 2.8 1.4 ± 0.2 MFH (Bayburt) 19.81 ± 1.3 28.6 ± 1.2 48.41 ± 2.1 1.4 ± 0.1 MFH (Black Sea) 33.98 ± 1.2 33.1 ± 1.3 67.08 ± 2.0 1.0 ± 0.2
Abbreviations: CNHH, chestnut honeydew honey; QPHH-IM, Ida Mountains Quercus pyrenaica honeydew honey; MFH, multifloral honey; PHH, pine honeydew honey. Selected two honey samples according to the total phenol and flavonoid content showed with boldface.
Table 3. Validation and Uncertainty Parameters of for LC-MS/MS Method.
Compound Linear Regression R2 Recovery LOD/LOQ (mg/kg) U
95 (%) QPHH-IM (mg/kg) MFH-C (mg/kg) Salicylic acid y = +0.2121x + 0.04 0.99 94.3 0.7/3.5 18.2 60.4 4.4 Caffeic acid y = +0.2543x + 0.01 0.96 92.8 1/5.0 20.6 6.0 <LOQ Kaempferol y = +0.0095x − 0.00 0.96 93.3 0.3/1.5 12.1 15.2 <LOQ Penduletin y = +0.1385x − 0.00 0.99 100.1 0.6/3.1 7.8 1.2 <LOQ Apigenin y = +0.1329x + 0.05 0.98 99.7 1.1/6.0 10.8 5.9 <LOQ Acacetin y = +0.6369x + 0.07 0.98 95.3 1.2/6.0 5.7 7.0 2.5 Luteolin y = +0.2217x + 0.03 0.98 99.8 0.7/3.5 4.2 3.7 <LOQ Diosmetin y = +1.1820x + 0.32 0.98 100.2 0.6/3.0 3.8 0.7 <LOQ Taxifolin y = +0.0735x + 0.000 0.97 91.8 3.1/15.0 10.1 4.2 <LOQ Eupatilin y = +0.5231x + 0.07 0.98 96.2 0.9/4.0 15.7 <LOQ <LOQ Nepetin y = +0.3282x − 0.06 0.98 100.1 2.2/11.0 10.6 0.6 <LOQ
Abbreviations: LC-MS/MS, liquid chromatography–tandem mass spectrometry; LOD, limit of detection; LOQ, limit of quantification; QPHH-IM, Ida Mountains Quercus pyrenaica honeydew honey; MFH-C, Canakkale multifloral honey.
increasing doses of honey samples and, when compared with MFH-C, DNA damage levels were significantly higher in QPHH-IM at higher concentrations (Figure 3).
These findings indicate that DNA damage level in cancer cells is related to the honey sample concentrations and their phenolic contents.
Apoptosis Assessment
Apoptosis is important in determining tumor formation and resistance to treatment. In our study, we performed AO/EB double staining and Western blot methods in
order to evaluate apoptotic effects of different concentra-tions of honeys in cancer cells. AGS cells were incubated with both honey for 24 hours to demonstrate the morpho-logical characteristics of apoptosis on cells. Cells were then stained with AO/EB double staining and examined under fluorescence microscopy (Figure 4). As shown in Figure 4, after 24 hours of incubation, as the adminis-tered dose of both honeys increased, the green-looking viable cell ratios decreased and the yellow-orange–look-ing apoptotic cell ratios increased. High doses of QPHH-IM caused more apoptosis in cancer cells than MFH-C (Figure 4).
Figure 1. Cells were treated with 0, 0.25, 0.5, 1, 1.5, 2, 2.5 3, 4, and 5% mg Canakkale multifloral honey (MFH-C) and Ida Mountains
Quercus pyrenaica honeydew honey (QPHH-IM) and incubated for 24 hours. The ATP cell viability test was used to assess the cell
viability. The percentage of cell viability was calculated by normalizing with a control panel. Significant differences compared with the control are indicated by *P < .05 and **P < .01.
Figure 2. Effects of Canakkale multifloral honey (MFH-C) and Ida Mountains Quercus pyrenaica honeydew honey (QPHH-IM) on the
morphological changes in AGS cells. Cells were incubated with various concentrations of honeys for 24 hours and stained with AO/EB to observe the morphology. Significant differences compared with the control are indicated by *P < .05 and **P < .01.
Western Blotting Results
In order to investigate the relationship between the cyto-toxic effects of honeys and apoptosis signaling pathways, the expression levels of P-53, caspase-3, Bax, Nf-κB, and Bcl-2 proteins were analyzed by the Western blotting method. For this purpose, AGS cells were treated with honey at different concentrations for 24 hours. Cell extracts were used for Western blotting. The β-tubulin was used as control. The results showed that both MFH and QPH increased expression levels of P-53, caspase-3, and Bax
protein in AGS cancer cells, while decreasing expression levels of Nf-κB and Bcl-2 (Figure 5).
However, expression levels were significantly higher in QPHH-IM than in MFH-C at increasing honey sample concentrations.
Discussion
The biological properties of honeys have been studied extensively. While most of the previous studies related to honey’s antioxidant and free radical scavenging properties,
Figure 3. AGS cells were treated with different concentrations of Ida Mountains Quercus pyrenaica honeydew honey (QPHH-IM) and
Canakkale multifloral honey (MFH-C) for 24 hours, and there were significant changes in the tail % of DNA according to the control with the increasing concentrations. Significant differences are indicated by *P < .05, **P < .01, and ***P < .001. Significant differences between QPHH-IM and MFH-C are indicated by “a.”
Figure 4. Apoptotic activity of honeys on AGS cell lines. Cells were treated with different concentrations of honeys (0.25% to 5%)
for 24 hours. Acridine orange/ethidium bromide (AO/EB) method was used and apoptotic and live cells were analyzed by fluorescence microscopy. Data presented were mean ± SD (n = 3). According to the control, significant differences are indicated by *P < .05, **P < .01, and ***P < .001. Significant differences between Ida Mountains Quercus pyrenaica honeydew honey (QPHH-IM) and Canakkale multifloral honey (MFH-C) are indicated by “a.”
studies on prooxidant properties have recently increased.22 In general, these adverse effects have been associated with phenolic contents of honey. However, the mechanism(s) of these opposite effects have not yet been fully understood. In addition, there is no study investigating the relationship between the therapeutic effects of honey on gastric adeno-carcinoma cells and their phenolic contents. Some studies consider that dark honeys, including the HH, tend to have
higher amounts of phenolic compounds,23,24 but studies on
this issue are doubtful. Therefore, we selected these 2 types of honey (QPHH-IM and MFH-C) based on total phenol, flavonoid, and antioxidant contents from 14 different hon-eys. In addition, we also measured 11 different phenolic compounds in both QPHH-IM and MFH-C samples. These results demonstrated that total and separately measured phenolic compound levels supported each other and that QPHH-IM has a very rich content relative to MFH-C in terms of phenolic compounds.
Cancer cells have a different metabolism than normal cells, and glucose is the primary source of energy for the
growth and proliferation of these cells.25 Diets that are high
in sugar may potentially cause a metabolic switch from oxi-dative phosphorylation to glycolysis in tumor cells, which confers the ability to grow in hypoxic environments, fuels
tumor growth and invasion, and prevents apoptosis.26
Carbohydrates are the main constituents, comprising about 95% of the honey dry weight, and the main sugars are the
monosaccharides fructose and glucose.27 To rule out the
possible effects of sugar on the cells, we measured the glu-cose and fructose content of honeys before cell culture anal-ysis. There was no significant difference between QPHH-IM and MFH-C in terms of glucose and fructose content. Therefore, we think that biological effects of both honeys on AGS cells may be caused by other substances such as non-sugar phenolic compounds.
We investigated cytotoxic, genotoxic, and apoptotic activities and ROS production capacity in human gastric adenocarcinoma cells in order to understand the relationship between phenolic contents and antiproliferative effects. We have demonstrated that QPHH-IM inhibit cell proliferation significantly at concentrations as low as 0.4% (w/v) in AGS cells and antiproliferative activity increased in a dose-depen-dent manner. We found 50% inhibition after 24 hours incu-bation of AGS cells with the 1.7% final concentration for QPHH-IM and 2.5% for MFH-C using ATP-Glo cell viabil-ity assay kit. The well-known honeys that have
antiprolifera-tive activity on different cancer cells are manuka honey,28
tualang honey,29 and gelam honey.30 Cytotoxic doses of
these honeys were quite different and vary according to the
cell types. Fernandez-Cabezudo et al31 found inhibition of
cell proliferation at final concentrations of 0.6% manuka honey. They found 40% inhibition after 24 hours incubation of MCF-7 cells with 5% final concentration of honey. Tualang honey was also shown to exhibit antiproliferative
Figure 5. Proapoptotic and antiapoptotic signal pathways AGS cells were treated with Ida Mountains Quercus pyrenaica honeydew
honey (QPHH-IM) and Canakkale multifloral honey (MFH-C) for 24 hours. A, indicates western blotting images; B, graphic indicates caspase-3; C, graphic indicates Bax; D, graphic indicates P-53; E, graphic indicates Nf-κB; F, graphic indicates Bcl-2. Cell lysate were used to demonstrate apoptotic and antiapoptotic signaling pathways protein expression. Significant differences according to the control are indicated by *P < .05, **P < .01, and ***P < .001.
effects on oral squamous and osteosarcoma cell lines and
IC50 concentration of 4% (oral squamous cell line) and 3.5%
(osteosarcomas cell line).32 These results demonstrated that
QPHH-IM can be a more potent cytotoxic to cancer cells than manuka and tualang honeys.
To better understand the mechanisms of antiproliferative effects of these honeys, we analyzed genotoxic, apoptotic, and ROS production activities on gastric adenocarcinoma cells. We have shown that QPHH-IM decreased ROS gen-eration at the concentration of 0.25% (w/v) in AGS cells, and above this concentration, ROS levels begun to increase in a dose-dependent manner. ROS generating activity was higher in QPHH-IM–exposed cells than in MFH-C. In addi-tion, there was a close negative relationship between cell viability and ROS generating activity (r = −0.839, P < .001, for QPHH-IM and r = −0.853, P < .001, for MFH-C on AGS cells). Generally, it has been known that honeys have phenolic compounds that are the main source of
antioxida-tive and free radical scavenging effects.33 On the other
hand, honey increases ROS production and shows cell death activity in cancer cells with indications that phenolic com-pounds are responsible for the increases of ROS production
by the prooxidant activity of honey.34 In fact, there is
sup-portive evidence that ROS may have a proliferative or cyto-toxic effect on cancer cells. It has been shown that low
levels of ROS increase cell proliferation.35 On the other
hand, high levels of ROS increase DNA damage, apoptosis,
and cell death.36 Normally, phenolic compounds are
anti-oxidants and may inhibit oxidative damage as a conse-quence of their ability to inhibit ROS. Under certain conditions, however, such as low pH, high phenolic concen-trations, and the presence of redox-active transition metals (Fe and Cu), phenolic compounds exhibit prooxidant
activ-ity. In particular, the Cu+2 concentration in cancer cells is
higher than normal cells, making them more susceptible to the prooxidant activity of phenolic compounds. In the
pres-ence of Cu2+, the prooxidant activity of phenolic compounds
is supposed to progress via generating OH− radical in a
Fenton-type reaction, which eventually leads to DNA
dam-age and apoptosis in cancer cells.37
DNA damage has been investigated in order to under-stand the mechanisms by which high doses of honeys in cancer cells cause cytotoxicity. We used the comet assay technique to measure the genotoxic effects of both honeys on AGS cells. This is one of the most important methods for the evaluation of DNA damage of different active
sub-stances in different cells.38 In this study, we found that
QPHH-IM levels above 0.5% caused DNA damage and the same QPHH-IM doses resulted in higher DNA damage than MFH-C in AGS cells. As far as we know, there is no prior experimental evidence that high doses of honeys in GC cells cause DNA damage. The vast majority of the studies have been concerned with the protective effects of honey on
DNA damage.39 However, it has been shown that gelam and
tualang honeys induced DNA damage in different cancer
cells in a dose-dependent manner.40 Our results are
consis-tent with the results of these studies.
Morphological, biochemical, and molecular changes related to apoptosis in cells can be measured by different methods. In the study, apoptosis was analyzed by AO/EB double staining. Apoptotic, necrotic, and living cells can be distinguished by this method. The results of the present work revealed that while high doses of honeys increased apoptosis in AGS cancer cells, QPHH-IM with high pheno-lic content induced apoptosis more than that of MFH-C with low phenolic content. It has been reported that the anti-cancer drugs can kill the anti-cancer cells by stimulating the
apoptotic pathways.41 Phenolic compounds can affect the
cellular redox status because of their prooxidant properties. This can lead to cell death as a result of DNA damage and
apoptotic activity.41 Our results are consistent with the
results of other recent studies.42 The vast majority of
chemo-therapists used in cancer treatment show their effects by
inducing apoptosis.43 Although the mechanism has not yet
been fully understood, studies have shown that honey has antiproliferative effects by inducing apoptosis in cancer
cells as well as by multiple cell signaling pathways.44 A
recent study to understand honey’s molecular mechanism of colon cancer cell growth inhibition has shown that honey-induced apoptosis upregulates P-53 and is accompanied by modulating the expression of proapoptotic and
antiapop-totic proteins.45 Our results are similar to previous studies.
We also found that both honey species cause a decrease in Bcl-2 signal expression and an increase in apoptotic P-53, Bax, and caspase-3 signal expression levels. These effects of QPHH-IM were more pronounced than MFH-C, espe-cially at high doses.
NF-κB has an important role in the regulation of intra-cellular signal transduction and protein expression of
vari-ous genes in the cell nucleus.46 Exceptional NF-κB
activation is associated with the stimulation of proliferation
and protection against apoptosis in malignant cells.47 Recent
studies have focused on the inhibitory effect of honey on
inflammatory-mediated NF-κB activation.48,49 We also
showed that NF-κB expression levels decreased with the increasing concentrations of honey, and the degree of inhi-bition with QPHH-IM was significantly higher than MFH-C, especially at high doses. These results show that honey has not only inhibitory effect on inflammation but also anti-proliferative effect on cancer cells.
Conclusion
Data showed that low concentrations of honey samples had proliferative effects due to their antioxidant activity, whereas high concentrations had cytotoxic, genotoxic, and apoptotic effects due to their prooxidant activities in cancer cells. All these effects were higher with QPHH-IM application
possessing the high phenolic content when compared with that of MFH-C, which possesses low phenolic content on AGS cancer cells. These preliminary results suggest that high-phenolic honey may contribute to the future develop-ment of cancer therapeutics.
Declaration of Conflicting Interests
The author(s) declared no potential conflicts of interest with respect to the research, authorship, and/or publication of this article.
Funding
The author(s) received no financial support for the research, authorship, and/or publication of this article.
ORCID iD
Abdurrahim Kocyigit https://orcid.org/0000-0003-2335-412X
Supplemental Material
Supplemental material for this article is available online.
References
1. Siegel RL, Miller KD, Jemal A. Cancer statistics, 2016. CA
Cancer J Clin. 2016;66:7-30.
2. Kotecha R, Takami A, Espinoza JL. Dietary phytochemicals and cancer chemoprevention: a review of the clinical evi-dence. Oncotarget. 2016;7:52517-52529.
3. Pita-Calvo C, Vázquez M. Differences between honeydew and blossom honeys: a review. Trends Food Sci Technol. 2017;59:79-87.
4. Tomás-Barberán FA, Martos I, Ferreres F, Radovic BS, Anklam E. HPLC flavonoid profiles as markers for the botan-ical origin of European unifloral honeys. J Sci Food Agric. 2001;81:485-496.
5. Estevinho L, Pereira AP, Moreira L, Dias LG, Pereira E. Antioxidant and antimicrobial effects of phenolic compounds extracts of Northeast Portugal honey. Food Chem Toxicol. 2008;46:3774-3779.
6. Hassan MI, Mabrouk GM, Shehata HH, Aboelhussein MM. Antineoplastic effects of bee honey and Nigella sativa on hepatocellular carcinoma cells. Integr Cancer Ther. 2012;11: 354-363.
7. Yao H, Xu W, Shi X, Zhang Z. Dietary flavonoids as cancer prevention agents. J Environ Sci Health C Environ Carcinog
Ecotoxicol Rev. 2011;29:1-31.
8. Fauzi AN, Norazmi MN, Yaacob NS. Tualang honey induces apoptosis and disrupts the mitochondrial membrane potential of human breast and cervical cancer cell lines. Food Chem
Toxicol. 2011;49:871-878.
9. Tsiapara AV, Jaakkola M, Chinou I, et al. Bioactivity of Greek honey extracts on breast cancer (MCF-7), prostate can-cer (PC-3) and endometrial cancan-cer (Ishikawa) cells: profile analysis of extracts. Food Chem. 2009;116:702-708.
10. Singleton VL, Orthofer R, Lamuela-Raventós RM. [14] Analysis of total phenols and other oxidation substrates and antioxidants by means of folin-ciocalteu reagent. Methods
Enzymol. 1999;299:152-178.
11. Zhishen J, Mengcheng T, Jianming W. The determination of flavonoid contents in mulberry and their scavenging effects on superoxide radicals. Food Chem. 1999;64:555-559. 12. Erel O. A novel automated direct measurement method for
total antioxidant capacity using a new generation, more stable ABTS radical cation. Clin Biochem. 2004;37:277-285. 13. AOAC International. Sugars and Sugar Products. Vol 2.
Gaithersburg, MD: AOAC International; 2000:22-33.
14. Baki S, Tufan AN, Altun M, Özgökçe F, Güçlü K, Özyürek M. Microwave-assisted extraction of polyphenolics from some selected medicinal herbs grown in Turkey. Rec Nat
Prod. 2017;12:29-39.
15. Yılmaz H, Çarıkçı S, Kılıç T, Dirmenci T, Arabacı T, Gören AC. Screening of chemical composition, antioxidant and anticholinesterase activity of section Brevifilamentum of
Origanum (L) species. Rec Nat Prod. 2017;11:439-455.
16. Han H, Yılmaz H, Gülçin İ. Antioxidant activity of flaxseed (Linum usitatissimum L) shell and analysis of its polyphenol contents by LC-MS/MS. Rec Nat Prod. 2018;12:397-402. 17. Çarıkçı S, Kılıç T, Özer Z, Dirmenci T, Arabacı T, Gören AC.
Quantitative determination of some phenolics in Origanum
laevigatum Boiss extracts via validated LC-MS/MS method
and antioxidant activity. J Chem Metrol. 2018;12:121-127. 18. Singh NP, McCoy MT, Tice RR, Schneider EL. A simple
technique for quantitation of low levels of DNA damage in individual cells. Exp Cell Res. 1988;175:184-191.
19. McGahon AJ, Martin SJ, Bissonnette RP, et al. The end of the (cell) line: methods for the study of apoptosis in vitro.
Methods Cell Biol. 1995;46:153-185.
20. Ribble D, Goldstein NB, Norris DA, Shellman YG. A simple technique for quantifying apoptosis in 96-well plates. BMC
Biotechnol. 2005;5:12.
21. Bradford MM. A rapid and sensitive method for the quantita-tion of microgram quantities of protein utilizing the principle of protein-dye binding. Anal Biochem. 1976;72:248-254. 22. Scepankova H, Saraiva JA, Estevinho LM. Honey health
benefits and uses in medicine. In: Alvarez-Suarez JM, ed.
Bee Products—Chemical and Biological Properties. Cham,
Switzerland: Springer; 2017:83-96.
23. Al ML, Daniel D, Moise A, Bobis O, Laslo L, Bogdanov S. Physico-chemical and bioactive properties of different floral origin honeys from Romania. Food Chem. 2009;112:863-867. 24. Bertoncelj J, Doberšek U, Jamnik M, Golob T. Evaluation
of the phenolic content, antioxidant activity and colour of Slovenian honey. Food Chem. 2007;105:822-828.
25. Klement RJ, Kämmerer U. Is there a role for carbohydrate restriction in the treatment and prevention of cancer? Nutr
Metab (Lond). 2011;8:75.
26. El Mjiyad N, Caro-Maldonado A, Ramírez-Peinado S, Muñoz-Pinedo C. Sugar-free approaches to cancer cell kill-ing. Oncogene. 2011;30:253-264.
27. Bogdanov S, Jurendic T, Sieber R, Gallmann P. Honey for nutri-tion and health: a review. J Am Coll Nutr. 2008;27:677-689. 28. Afrin S, Giampieri F, Gasparrini M, et al. The inhibitory
effect of manuka honey on human colon cancer HCT-116 and LoVo cell growth. Part 1: the suppression of cell prolifera-tion, promotion of apoptosis and arrest of the cell cycle. Food
Funct. 2018;9:2145-2157.
29. Syazana MSN, Halim AS, Gan SH, Shamsuddin S. Antiproliferative effect of methanolic extraction of tualang
honey on human keloid fibroblasts. BMC Complement Altern
Med. 2011;11:82.
30. Hakim L, Alias E, Makpol S, Ngah WZW, Morad NA, Yusof Y. Gelam honey and ginger potentiate the anti cancer effect of 5-FU against HCT 116 colorectal cancer cells. Asian Pac J
Cancer Prev. 2014;15:4651-4657.
31. Fernandez-Cabezudo MJ, El-Kharrag R, Torab F, et al. Intravenous administration of manuka honey inhibits tumor growth and improves host survival when used in combination with chemotherapy in a melanoma mouse model. PLoS One. 2013;8:e55993.
32. Ghashm AA, Othman NH, Khattak MN, Ismail NM, Saini R. Antiproliferative effect of tualang honey on oral squamous cell carcinoma and osteosarcoma cell lines. BMC Complment
Altern Med. 2010;10:49.
33. Aljadi AM, Kamaruddin MY. Evaluation of the phenolic con-tents and antioxidant capacities of two Malaysian floral hon-eys. Food Chem. 2004;85:513-518.
34. Afrin S, Forbes-Hernandez TY, Gasparrini M, et al. Strawberry-tree honey induces growth inhibition of human colon cancer cells and increases ROS generation: a compari-son with manuka honey. Int J Mol Sci. 2017;18:E613. 35. Sauer H, Wartenberg M, Hescheler J. Reactive oxygen
spe-cies as intracellular messengers during cell growth and dif-ferentiation. Cell Physiol Biochem. 2001;11:173-186. 36. Kocyigit A, Guler EM. Curcumin induce DNA damage and
apoptosis through generation of reactive oxygen species and reducing mitochondrial membrane potential in melanoma cancer cells. Cell Mol Biol. 2017;63:97-105.
37. Azmi AS, Bhat SH, Hadi S. Resveratrol-Cu (II) induced DNA breakage in human peripheral lymphocytes: implications for anticancer properties. FEBS Lett. 2005;579:3131-3135. 38. Liao W, McNutt MA, Zhu WG. The comet assay: a
sensi-tive method for detecting DNA damage in individual cells.
Methods. 2009;48:46-53.
39. Cheng N, Wang Y, Cao W. The protective effect of whole honey and phenolic extract on oxidative DNA damage in mice lymphocytes using comet assay. Plant Foods Hum Nutr. 2017;72:388-395.
40. Wen CTP, Hussein SZ, Abdullah S, Karim NA, Makpol S, Yusof YAM. Gelam and nenas honeys inhibit proliferation of HT 29 colon cancer cells by inducing DNA damage and apop-tosis while suppressing inflammation. Asian Pac J Cancer
Prev. 2012;13:1605-1610.
41. Khan N, Afaq F, Mukhtar H. Apoptosis by dietary factors: the suicide solution for delaying cancer growth. Carcinogenesis. 2007;28:233-239.
42. Jubri Z, Narayanan NNN, Karim NA, Ngah WZW. Antiproliferative activity and apoptosis induction by gelam honey on liver cancer cell line. Int J Appl Sci Technol. 2012;2:135-141. 43. Earnshaw WC. Nuclear changes in apoptosis. Curr Opin Cell
Biol. 1995;7:337-343.
44. Kumar Jaganathan S, Balaji A, Vellayappan MV, et al. A review on antiproliferative and apoptotic activities of natural honey. Anticancer Agents Med Chem. 2015;15:48-56. 45. Afrin S, Giampieri F, Forbes-Hernández TY, et al. Manuka
honey synergistically enhances the chemopreventive effect of 5-fluorouracil on human colon cancer cells by inducing oxidative stress and apoptosis, altering metabolic phenotypes and suppressing metastasis ability. Free Radic Biol Med. 2018;126:41-54.
46. Chen L, Teng H, Jia Z, et al. Intracellular signaling pathways of inflammation modulated by dietary flavonoids: the most recent evidence. Crit Rev Food Sci Nutr. 2018;58:2908-2924. 47. Ahn KS, Aggarwal BB. Transcription factor NF-kappaB:
a sensor for smoke and stress signals. Ann N Y Acad Sci. 2005;1056:218-233.
48. Hamad R, Jayakumar C, Ranganathan P, et al. Honey feed-ing protects kidney against cisplatin nephrotoxicity through suppression of inflammation. Clin Exp Pharmacol Physiol. 2015;42:843-848.
49. Kim HN, Park SB, Kim JD, Jeong HJ, Jeong JB. Acacia honey exerts anti-inflammatory activity through inhibition of NF-kB and MAPK/ATF2 signaling pathway in LPS-Stimulated RAW264. 7 cells. Paper presented at: International Symposium on Natural Products Industry and 2018 Autumn Conference of Korean Society of Plant Resources; September 17-19, 2018; Seoul, Korea.